


1 INTRODUCTION
Nearly 60% or more of the Solar neighborhood stars are binaries or multiple systems (Duquennoy & Mayor Reference Duquennoy and Mayor1993). Binaries are important for astrophysicists not only because they over populate single stars, but also because they provide basic stellar parameters as independent observed quantities used in testing astrophysical theories. Stellar masses can be determined directly via application of Kepler’s law for the visual binaries if apparent orbital parameters were calibrated to be real. A calibration is possible for a visual pair if its distance (parallax) is known. Reliable stellar masses could also be obtained from the radial velocity curves without distance, but only if orbital inclinations were known. The resolved double stars (visual binaries confirmed to be spectroscopic binaries), therefore, are a special case to provide reliable stellar masses, since the orbital inclinations are from the apparent orbit and the absolute orbital sizes are from the radial velocity curves.
Gainfully, the light curves of eclipsing binaries could provide orbital inclinations and the radii relative to the semi-major axis of the orbit. But, if both stars are resolved spectroscopically, accurately determined radii and masses could be obtained from the simultaneous solutions of the light and the radial velocity curves. In addition to the radii, which are not available from visual binaries, the eclipsing spectroscopic binaries provide masses, effective temperatures, and the absolute dimensions of the orbit, from which absolute brightness could be calculated. Provided with a parallax, either the physical parameters or the parallax could mutually be tested by comparing the photometric and the trigonometric distance moduli. Otherwise, a proper solution would provide not only the most reliable stellar parameters, but also a reliable photometric distance (parallax) as an independent quantity.
The critical compilations of stellar parameters and absolute dimensions of binary components were initiated, and continued with increasing quantity and quality, especially by Popper (Reference Popper1980) and Harmanec (Reference Harmanec1988). Andersen (Reference Andersen1991) collected accurate stellar masses and radii with uncertainties less than 2% from the detached, double-lined eclipsing systems. The list contained 45 (90 stars) binaries which are all non-interacting, so that each star could be accepted as if evolved as single stars. Accuracies of 1%–2% were found to be significant for deeper astrophysical insight than merely improving the spectrum of masses and radii. Due to great sensitivity of other parameters, only limited amount of useful results could be extracted up to ± 5% uncertainties.
Malkov (Reference Malkov1993) announced a catalogue of astrophysical parameters of binary systems containing 114 systems including all pre- and out-of-main-sequence, contact, and semi-contact systems. Gorda & Svechnikov (Reference Gorda and Svechnikov1998) collected stellar masses and radii with accuracies better than 2%–3% from photometric, geometric, and absolute elements of 112 eclipsing binaries with both components on the main sequence, for studying the mass-luminosity and mass-radius relations. Ages and metallicities for the components of 43 eclipsing binaries with lines of both components visible on the spectra were studied by Kovaleva (Reference Kovaleva2001).
As the number of stars with reliable physical parameters is increasing, the studies concentrated more on the precision and accuracy. Therefore, Ibanoǧlu et al. (Reference Ibanoǧlu, Soydugan, Soydugan and Dervişoǧlu2006) did not combine 74 double-lined detached eclipsing Algols and 61 semi-detached Algols when plotting mass-radius, mass-T $_{\text{eff}}$
, radius-T
$_{\text{eff}}$
, radius-T $_{\text{eff}}$
, and mass-luminosity data. Lastennet & Valls-Gabaud (Reference Lastennet and Valls-Gabaud2002) compiled 60 non-interacting, well-detached systems with typical errors smaller than 2% for masses and radii, while 5% for the effective temperatures. The core of the sample was the large catalogue of Andersen (Reference Andersen1991). As being satisfied with 10% accuracy for the main-sequence stars, Hillenbrand & White (Reference Hillenbrand and White2004) studied dynamical mass constraints on pre-main-sequence evolutionary tracks with 148 stars, 88 are on the main-sequence, 27 are on the pre-main-sequence, and 33 are on the post-main-sequence, where the source of data were Andersen (Reference Andersen1991), Ribas et al. (Reference Ribas, Jordi, Torra and Giménez2000), and Delfosse et al. (Reference Delfosse, Forveille, Ségransan, Beuzit, Udry, Perrier and Mayor2000). Despite, the number of eclipsing binaries was 6 330 in ‘the catalogue of eclipsing binaries’ by Malkov et al. (Reference Malkov, Oblak, Snegireva and Torra2006), but Malkov (Reference Malkov2007) was able to select only 215 stars (114 binaries) which are detached-main-sequence and double-lined eclipsing binary with uncertainties for masses, radii,
$_{\text{eff}}$
, and mass-luminosity data. Lastennet & Valls-Gabaud (Reference Lastennet and Valls-Gabaud2002) compiled 60 non-interacting, well-detached systems with typical errors smaller than 2% for masses and radii, while 5% for the effective temperatures. The core of the sample was the large catalogue of Andersen (Reference Andersen1991). As being satisfied with 10% accuracy for the main-sequence stars, Hillenbrand & White (Reference Hillenbrand and White2004) studied dynamical mass constraints on pre-main-sequence evolutionary tracks with 148 stars, 88 are on the main-sequence, 27 are on the pre-main-sequence, and 33 are on the post-main-sequence, where the source of data were Andersen (Reference Andersen1991), Ribas et al. (Reference Ribas, Jordi, Torra and Giménez2000), and Delfosse et al. (Reference Delfosse, Forveille, Ségransan, Beuzit, Udry, Perrier and Mayor2000). Despite, the number of eclipsing binaries was 6 330 in ‘the catalogue of eclipsing binaries’ by Malkov et al. (Reference Malkov, Oblak, Snegireva and Torra2006), but Malkov (Reference Malkov2007) was able to select only 215 stars (114 binaries) which are detached-main-sequence and double-lined eclipsing binary with uncertainties for masses, radii, $\log T_{\text{eff}}$
, logL, and logM were assumed to be 10, 10%, 0.03, 0.03, and 0.1 mag or better respectively.
$\log T_{\text{eff}}$
, logL, and logM were assumed to be 10, 10%, 0.03, 0.03, and 0.1 mag or better respectively.
Eclipsing binaries are not only recognised with their accuracy, but also known to have larger spectrum of mass range, especially towards larger masses in compared to visual binaries including Hipparcos detections (Malkov Reference Malkov2003). Improvements in observing and analysis techniques never stop, and collection of reliable light and radial velocity curve solutions continues. Recently, Torres et al. (Reference Torres, Andersen and Giménez2010) updated the critical compilation of detached, double-lined eclipsing binaries with accurate masses and radii. Superseding Andersen (Reference Andersen1991) list, this new list contains 190 stars (94 eclipsing binaries and α Cen). In order to fill the gaps in different mass ranges, further compilations on the accurate absolute dimensions of the eclipsing double-lined spectroscopic binaries are inevitable.
The aim of this paper is to present our compilation of 514 stars which are from 257 detached eclipsing double-lined spectroscopic binaries (SB2) of the Milky Way. The number of stars in our list with reliable masses, spectroscopic mass ratios, orbital inclinations, radii, $T_{\text{eff}}$
, logg, and vsini values as collected from the literature supersede similar compilations before. Selecting criteria and data collection from binaries and the descriptions of the quality of the data are given in Section 2. The H-R diagram, space distributions, and how good a typical single star represented are discussed in Section 3, and finally, conclusions are provided in Section 4.
$T_{\text{eff}}$
, logg, and vsini values as collected from the literature supersede similar compilations before. Selecting criteria and data collection from binaries and the descriptions of the quality of the data are given in Section 2. The H-R diagram, space distributions, and how good a typical single star represented are discussed in Section 3, and finally, conclusions are provided in Section 4.
2 THE CATALOGUE
2.1 Selecting criteria and data collection
The basic stellar (masses, radii, $T_{\text{eff}}$
, logg, vsini) and orbital (radial velocity amplitudes K
1, K
2, mass ratio q, orbital period
$T_{\text{eff}}$
, logg, vsini) and orbital (radial velocity amplitudes K
1, K
2, mass ratio q, orbital period $P_{\text{orb}}$
, orbital inclination i, semi-major axis a, eccentricity e) parameters have been collected from the published material through literature from the simultaneous solutions of light and radial velocity curves of 257 detached eclipsing and double-lined spectroscopic binaries in our Galaxy. The collections were complete by the date 2013 January 2. The strict initial criterion was first to make an eye inspection to the light and the radial velocity curves, to make sure the system is detached, and have sufficient number of observed data on both curves to assure acceptable accuracy. The systems having W UMa- and β Lyr-type light curves, which are known as contact and semi-contact systems respectively, were avoided. The near contact systems showing noticeable proximity effects such as ellipticity and reflection on their light curves were also avoided. Another criterion was to make sure all systems are in the Milky Way, so as to avoid complexities involving extragalactic origins and to form a homogeneous sample.
$P_{\text{orb}}$
, orbital inclination i, semi-major axis a, eccentricity e) parameters have been collected from the published material through literature from the simultaneous solutions of light and radial velocity curves of 257 detached eclipsing and double-lined spectroscopic binaries in our Galaxy. The collections were complete by the date 2013 January 2. The strict initial criterion was first to make an eye inspection to the light and the radial velocity curves, to make sure the system is detached, and have sufficient number of observed data on both curves to assure acceptable accuracy. The systems having W UMa- and β Lyr-type light curves, which are known as contact and semi-contact systems respectively, were avoided. The near contact systems showing noticeable proximity effects such as ellipticity and reflection on their light curves were also avoided. Another criterion was to make sure all systems are in the Milky Way, so as to avoid complexities involving extragalactic origins and to form a homogeneous sample.
If there were such systems studied more than once, that is, the light and the radial velocity curves determined and solved in various studies, the most recent solutions which include or compare to the previous solutions were preferred. We were aware of the fact that some of the chromosphericaly active binaries are possible to fulfil the above criteria. For example, if a detached, double-lined eclipsing binary is one of the studied chromosphericaly active binaries with starspots, we were keen to accept stellar parameters only if spotless clean solutions exist, in order to avoid negative contribution of starspots on the stellar parameters. Therefore, 24 binaries in the current collected sample are also contained in third edition of the catalogue of Chromosphericaly Active Binaries (CABs) by Eker et al. (Reference Eker2008).
2.2 Impact of selecting criteria and observational bias
Binaries have numerous advantages over single stars when determining basic stellar parameters, like masses, radii, effective temperatures, etc., through observations. Direct measurements of stellar radii come only from the light curve analysis of eclipsing binaries. Therefore, the first selection criterion is to require eclipses.
After many years of observational experience today for recognising eclipsing nature of a light curve, it’s always useful for one to remember the famous debate, binary versus pulsation (Shapley Reference Shapley1914; Eddington Reference Eddington1918; Hall Reference Hall1994), in the beginning of the 20th century. Even if one is sure, the light curve is in eclipsing nature, the light curve alone is not sufficient to extract absolute sizes of the orbit and radii of the component stars unless apparent angular size and distance of the eclipsing system are known independently. Radial velocity curves of eclipsing SB2 binaries not only could confirm consistency of eclipses but also provide the absolute size of the orbit by using the value of orbital inclination from the light curve analysis. Consequently, absolute sizes of radii could be computed from the eclipse durations and absolute size of the orbit. Therefore, for the second selection criterion, each eclipsing binary must be an SB2 system.
Eclipsing light curves and radial velocity curves of SB2, however, do not always assure basic stellar parameters (mass, radius, effective temperature, surface gravity, luminosity, etc.) as accurate as usable by the theoretical astronomers to compare and test their astrophysical theories. Therefore, complex cases associated with these two basic criteria must be removed by additional selection rules. So, the third selection criterion is established as ‘avoiding extragalactic systems’ in order to form a homogeneous sample representing binaries in the Milky Way and in the Solar neighborhood.
Most stellar astrophysical theories start with the simplest assumptions, e.g. being single, spherical, non-rotating, not-pulsating, etc. Complexities, such as mass loss, convective overshoot, rotation, pulsation, etc. were added later. Today there are many theoretical stellar evolution models (i.e. Pols et al. Reference Pols, Schröder, Hurley, Tout and Eggleton1998; Demarque et al. Reference Demarque, Woo, Kim and Yi2004; Girardi et al. Reference Girardi2010; Ekstrom et al. Reference Ekstrom2012) competing. Apparently those models, which involve single stars, were tested and/or improved by comparing observational parameters mostly comes from binaries advantageous to provide most accurate data. Moreover, single star evolution becomes invalid if it is an interactive binary and experience mass transfer. Therefore, similar kinds of data from single stars are not only poor thus not useful but also not free from many severe complexities. For example, one can never be sure a single star is really single and evolved as a single. de Mink, Langer, & Izzard (Reference de Mink, Langer and Izzard2011) claimed ‘the only unambiguous identification of true single stars is possible in detached binaries, which contain two main-sequence stars’. Therefore, for the fourth selection criterion in this study, ‘avoid interacting binaries known to be involving mass transfer, such as W UMa and β Lyr types’.
Near contact binaries, with strong proximity effects, still introduce complexities involving strong tidal synchronisation, deformation of shapes, and mutual irradiations of the component stars. So, fifth selection criterion, ‘avoid systems with proximity effects’, must be added.
Active solar-type stars with starspots may introduce minor but unavoidable complexity causing determined radii, relative temperatures to be less accurate. Therefore, sixth selection criterion, ‘avoid stellar activity, accept the spotless solutions’.
2.3 Description and quality of the data
The catalogue is available in an electronic format (Table S1, available online). The content of the catalogue is organised as a table of 257 rows and 60 columns. Thus, each row of data belongs to a detached eclipsing binary, which is an SB2 system. The columns and their descriptions were given in Table 1, where one may notice the data were carefully referenced for interested readers who want to see original sources. Original sources, however, are heterogeneous to use the older and the newer values of GM ⊙ and R ⊙ when deriving the observed masses and radii. Since contributing uncertainty of those constants is not entirely negligible (0.23%) as estimated by Torres et al. (Reference Torres, Andersen and Giménez2010), by means of their formulae, the collected masses and radii were homogenised using GM ⊙ = 1.3271244 × 10²⁰ m3 s− 2 (Standish Reference Standish1995) and R ⊙ = 6.9566 × 10⁸m (Haberreiter, Schmutz, & Kosovichev Reference Haberreiter, Schmutz and Kosovichev2008). Next, surface gravities and luminosities recomputed from the homogenised quantities. Those re-evaluated quantities and their associated errors are listed in Table 2 where columns are self explanatory.
Table 1. Column descriptions of the catalogue data.
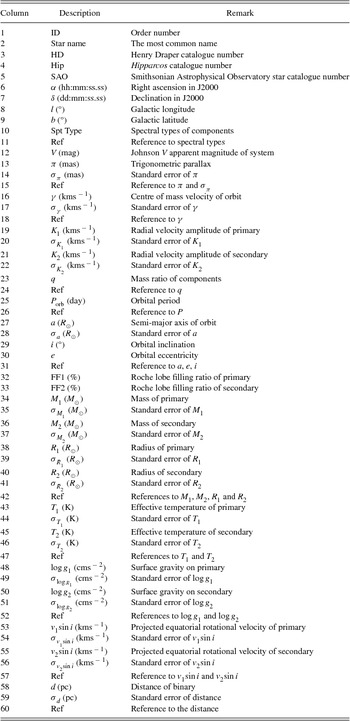
Table 2. Homogenized parameters and orbital sizes of detached, double-lined eclipsing binaries.
Containing 514 stars (257 binaries), the present catalogue supersedes the most recent collection by Torres et al. (Reference Torres, Andersen and Giménez2010) with 190 stars (94 eclipsing systems and α Cen). Both catalogues are similar in a sense, containing detached eclipsing binaries with an exception that α Cen being astrometric binary is excluded. Moreover, extragalactic binary OGLE 051019, which is in the list of Torres et al. (Reference Torres, Andersen and Giménez2010), is also excluded because it is not in our Galaxy. As a result, only 93 binaries are common in both catalogues, hence there is substantial amount of excess (257 − 93 = 164) in the present catalogue. However, it is prudent to compare the quality of the data rather than a plain number. Torres et al. (Reference Torres, Andersen and Giménez2010) preferred to collect binaries with the masses and radii of both stars to be known within errors of ± 3% accuracy or better. Rather than binaries, present study concentrates on component stars and collects individual stars with most accurate masses and radii. In the present sample, the number of stars with both mass and radius within ± 3% accuracy or better is 311. The number implies 67% more stars than Torres et al. (Reference Torres, Andersen and Giménez2010) with similar accuracy. Among the 311, 292 stars are matched binaries, thus the number of Galactic binaries with similar accuracy increased from 93 to 146 (57%) in this study. When comparing the most accurate data, that is, the number of individual stars with both mass and radius with accuracies ± 1% or better are 93 and 43 in the present list and in the list of Torres et al. (Reference Torres, Andersen and Giménez2010), respectively. Such improvements justify the publication of the present catalogue.
Among the 93 binaries which are common between the present catalogue and the catalogue of Torres et al. (Reference Torres, Andersen and Giménez2010), only one binary, EW Ori, has been re-studied later by Clausen et al. (Reference Clausen, Bruntt, Olsen, Helt and Claret2010). Thus, 92 binaries in both catalogues have common references from which catalogue parameters were taken. Therefore, catalogue values and accuracies must be similar. Nevertheless, we have noticed few small negligible differences most probably originating from the preferences among the multiple references. Additionally, few limited non-negligible differences exist because of identifying the primary and the secondary, which will be explained below while discussing the mass ratio (q) distribution of the present sample.
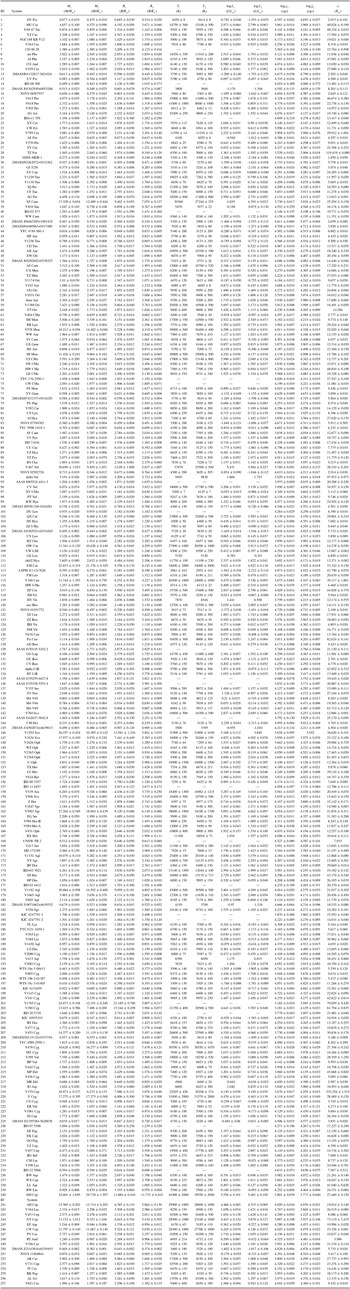
Statistics of masses, radii, effective temperatures, surface gravities, luminosity of individual stars, orbital semi-major axis (a), and mass ratio of binaries in the present sample are summarised in Table 3. Maximum and minimum values of those data with the identified star or the system are given in the first four rows. Following are mean, mode, and median values. Maximum, minimum, mean, mode, and median values of the associated errors are given in the last five lines. Relative errors are indicated by % sign after the value, otherwise the errors are absolute. Being related with characteristics of the present sample, some of the distributions will be discussed below.
Table 3. Summary statistics of the present sample.
(1) Primary of DH Cep; (2) primary of V1765 Cyg; (3) primary of V1182 Aql; (4) secondary of 2MASS J04463285+1901432; (5) V379 Cep; (6) V885 Cyg; (7) secondary of NSVS 07394765; (8) secondary of 2MASS J04463285+1901432; (9) secondary of KIC 10935310; (10) secondary of TZ For; (11) SDSS-MEB-1; (12) TYC3121-1659-1.
2.3.1 Apparent magnitude and period distributions
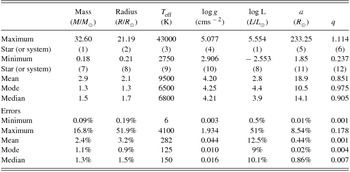
Apparent magnitude distribution of the present sample (257 systems) is shown in Figure 1. Large range of apparent magnitudes, from very bright (1.89 mag, β Aur) to dimmest (19.92 mag, SDSS-MEB-1), display a peak at V = 9 mag, thus most of the systems are contained at 8, 9, or 10 mag.
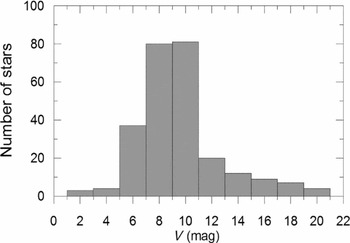
Figure 1. Apparent brightness distribution of 257 systems.
The orbital period of the sample covers a range from $P_{\text{orb}}=0.30$
d (DV Psc) to
$P_{\text{orb}}=0.30$
d (DV Psc) to $P_{\text{orb}}=99.7638$
d (V379 Cep). The distribution on the logarithmic scale is displayed in Figure 2. Accordingly, the most common orbital periods are close to 2.5 d. For a given mass, bigger orbital periods mean larger orbital sizes. Larger orbital size, however, decreases the probability of having eclipses. Since, our sample contains only eclipsing binaries, the decrease towards longer periods in Figure 2 is clear and it must be effected by the probability of eclipses. Researchers prefer to study short-period systems because they are easier to observe. This is an additional bias to increase the number of systems towards the short periods. However, according to Figure 2, starting from
$P_{\text{orb}}=99.7638$
d (V379 Cep). The distribution on the logarithmic scale is displayed in Figure 2. Accordingly, the most common orbital periods are close to 2.5 d. For a given mass, bigger orbital periods mean larger orbital sizes. Larger orbital size, however, decreases the probability of having eclipses. Since, our sample contains only eclipsing binaries, the decrease towards longer periods in Figure 2 is clear and it must be effected by the probability of eclipses. Researchers prefer to study short-period systems because they are easier to observe. This is an additional bias to increase the number of systems towards the short periods. However, according to Figure 2, starting from $\log P_{\text{orb}}$
(days) = 0.4, the number of systems decreases quickly towards the short periods. This could be explained by the fact that decreasing orbital period means decreasing the orbital sizes. Decreasing orbital size, however, increases the proximity effects such as, reflection and deviation from spherical shapes. Avoiding systems with proximity effects must be the main cause of the decrease towards short periods starting from the peak period
$\log P_{\text{orb}}$
(days) = 0.4, the number of systems decreases quickly towards the short periods. This could be explained by the fact that decreasing orbital period means decreasing the orbital sizes. Decreasing orbital size, however, increases the proximity effects such as, reflection and deviation from spherical shapes. Avoiding systems with proximity effects must be the main cause of the decrease towards short periods starting from the peak period $P_{\text{orb}}=2.5$
d.
$P_{\text{orb}}=2.5$
d.
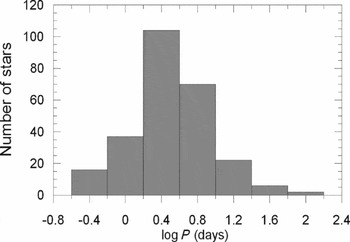
Figure 2. Orbital period distribution of 257 systems.
Distribution of orbital periods among the spectral types (primary components) is given in Table 4. Shortest orbital periods (0.30 to 0.63 d) could be found among F and later spectral types. Such small orbital periods do not exist for the binaries with spectral types O, B, and A. The system with the smallest orbital period ( $P_{\text{orb}}=0.30$
d, DV Psc) has components of spectral types K4V+M1V (Zhang & Zhang Reference Zhang and Zhang2007).
$P_{\text{orb}}=0.30$
d, DV Psc) has components of spectral types K4V+M1V (Zhang & Zhang Reference Zhang and Zhang2007).
Table 4. Distribution of orbital periods among the spectral types of the primary components.
Among the O-type binaries, the shortest orbital period is 1.62 d which belongs to V1182 Aql (Mayer, Drechsel, & Lorenz Reference Mayer, Drechsel and Lorenz2005), while the longest orbital period is only 4.24 d for V1292 Sco (Sana, Gosset, & Rauw Reference Sana, Gosset and Rauw2006). It appears odd to find the maximum orbital period of O-type systems as short as 4.24 d. The long period cut-off for the B-type systems is at 99.76 d which is the orbital period of V379 Cep (Harmanec et al. Reference Harmanec2007). Normally, larger radii would increase the probability of eclipses, thus, one would expect to see more O-type systems, and thus the median values of the orbital periods (Table 4) must increase towards earliest spectral types. However, the median $\log P_{\text{orb}}$
decrease from G-type to O-type. Moreover, according to Table 4 (column 9), there are 247 binaries from B to M types. Consequently, 8 out of 247 with
$\log P_{\text{orb}}$
decrease from G-type to O-type. Moreover, according to Table 4 (column 9), there are 247 binaries from B to M types. Consequently, 8 out of 247 with $\log P_{\text{orb}}$
(days) > 1.4, and 32 out of 247 with
$\log P_{\text{orb}}$
(days) > 1.4, and 32 out of 247 with $\log P_{\text{orb}}>1;$
hence, probability to have chance 0 out of 10, which is the case for O-type systems, is 0.72 (
$\log P_{\text{orb}}>1;$
hence, probability to have chance 0 out of 10, which is the case for O-type systems, is 0.72 ( $\log P_{\text{orb}}$
(days) > 1.4) and 0.25 (
$\log P_{\text{orb}}$
(days) > 1.4) and 0.25 ( $\log P_{\text{orb}}$
(days) > 1), which is not compellingly low. These numbers might be biased somehow to very high values, but even computing only on the B-type stars (disadvantage of smaller subset), 1 out of 52 and 8 out of 52, gives probabilities of 0.82 (
$\log P_{\text{orb}}$
(days) > 1), which is not compellingly low. These numbers might be biased somehow to very high values, but even computing only on the B-type stars (disadvantage of smaller subset), 1 out of 52 and 8 out of 52, gives probabilities of 0.82 ( $\log P_{\text{orb}}$
(days) > 1.4) and 0.19 (
$\log P_{\text{orb}}$
(days) > 1.4) and 0.19 ( $\log P_{\text{orb}}$
(days) > 1) to have no O-type stars at longer periods. The apparent lack of O-type stars at longer periods suffers from statistical significance because of the small size of this subset. However, inspecting the median values of mass ratios (Table 4), one may notice that the median value of mass ratio (q), is almost constant (median q = 0.92) for late spectral types (G, K, M), but it decreases from F-type to O-type as low as median q = 0.708. This implies that, O-type stars have higher probability to have a secondary with less massive than the primary. Combining this with faster rotation, the odds of detecting the secondary due to rotational broadening increases. Thus, faster rotation of O-type stars appears to be the main reason of finding them with the least number and smallest upper cut-off for the orbital periods on the Table 4.
$\log P_{\text{orb}}$
(days) > 1) to have no O-type stars at longer periods. The apparent lack of O-type stars at longer periods suffers from statistical significance because of the small size of this subset. However, inspecting the median values of mass ratios (Table 4), one may notice that the median value of mass ratio (q), is almost constant (median q = 0.92) for late spectral types (G, K, M), but it decreases from F-type to O-type as low as median q = 0.708. This implies that, O-type stars have higher probability to have a secondary with less massive than the primary. Combining this with faster rotation, the odds of detecting the secondary due to rotational broadening increases. Thus, faster rotation of O-type stars appears to be the main reason of finding them with the least number and smallest upper cut-off for the orbital periods on the Table 4.
2.3.2 Masses and radii
The distributions of masses and radii of 514 stars are shown in Figure 3. Similar appearance of both distributions is not a coincidence. This is because, almost all of the stars of the present sample are on the main sequence, only a few exceptions, e.g. BW Aqr, V379 Cep, RT CrB, TZ For, AI Hya, and V1292 Sco appear to have evolved components. Similar appearance implies a strong relation, which is commonly known as the main sequence mass-radius relation.
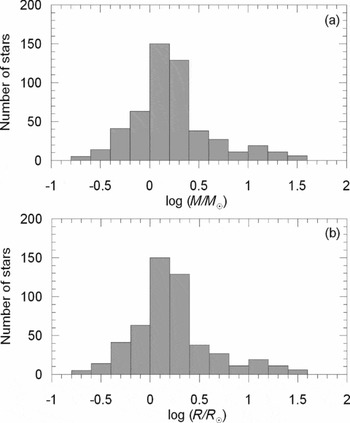
Figure 3. Distributions of masses (a) and radii (b) of 514 stars from 257 binaries.
The uncertainty distributions of masses and radii are displayed in Figure 4. Figures 4a and 4c are in the accumulated form and Figures 4b and 4d are ordinary histograms showing the number of stars in 1% bin up to 20% uncertainty. Figures 4a and 4c indicate that in the sample there are 193 stars with masses better than 1% , 390 stars with masses better than 3% , and 443 stars with masses better than 5% uncertainties. Regarding the radii in the sample, there are 158 stars with radii better than 1% , 379 stars with radii better than 3% , and 437 stars with radii better than 5% uncertainties. The uncertainty range up to 20% includes all mass data, while the radii data contain 98% of sample stars in the same range. That is, there are only nine stars with uncertainties larger than 20% in radius.
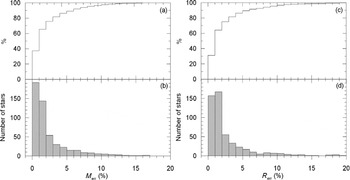
Figure 4. Uncertainty distributions of masses (a, b) and radii (c, d).
2.3.3 Mass ratio and spectral types
The spectroscopic mass ratio (q) of the components is one of the most fundamental parameter of binary systems. It is conventionally defined as mass of the secondary divided by the mass of the primary. If the secondary is the less massive component, q is always less than one. Here, the light curve approaches are adopted; the primary is the eclipsed star during the primary minimum which is the deeper one of the two minima. Consequently, all mass ratios are determined spectroscopically from the radial velocity amplitudes as K 1/K 2.
The mass ratio distribution of the sample stars is displayed in Figure 5. The most common mass ratio of the sample is close to 0.9 and it is distributed within the range 0.2 to 1.2. The values q < 1 indicate more massive hotter primary and a cooler less massive secondary. This is the case for young unevolved binaries on the main sequence. On the other hand, the values q > 1 implies evolved pairs that more massive component cooler than the less massive secondary. Even when there would be no evolved pairs, some empirical mass ratios above unity are expected because of less precise systems with a q near unity. According to Figure 5, there are 21 systems with q > 1. Examining their positions on the H-R diagram, seven systems (TZ For, V1130 Tau, AI Hya, GZ Leo, RT CrB, V2368 Oph, V885 Cyg) were found for sure to have evolved cooler components. The rest have some ambiguity because one cannot identify the primary and the secondary due to component masses and/or temperatures so close.
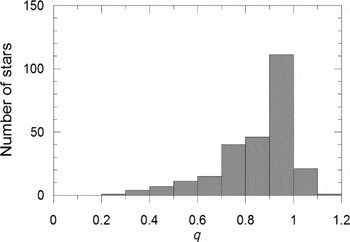
Figure 5. Mass ratio distribution of the sample. The median of q is 0.905.
Using published spectral types (Table S1) and counting each component as a single star, spectral-type distribution of 514 stars (257 pairs) is shown in Figure 6. Except for O-types, there exist statistically sufficient number of stars at all spectral types. The most crowded spectral types are F, A, and B. So, with an abrupt increase at B, number of stars increase until F, then there is a considerable sudden decrease to G, then gradual decrease towards M. Readers should be aware of that the papers announcing those spectral types (Table S1) use different kinds of estimates, from professional MK(K) types to very rough estimates, even from photometric indices.
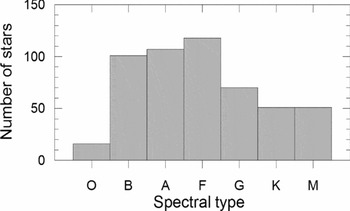
Figure 6. Distribution of 514 stars (257 pairs) according to spectral types.
The hottest star in the sample has an effective temperature of 43 000K which is the O-type primary of V1182 Aql (Mayer et al. Reference Mayer, Drechsel and Lorenz2005), while the coldest star in the sample has an effective temperature of 2 750 K which is M-type secondary of KIC10935310 (Çakırlı, İbanoǧlu, & Sipahi Reference Çakırlı, İbanoǧlu and Sipahi2013).
3 DISCUSSION
3.1 H-R diagram
The H-R diagram is a primary tool to demonstrate and study stellar evolution. Representing the stars with most accurate mass and radius, the present sample on the H-R diagram has been investigated. Taking the effective temperatures ( $\log T_{\text{eff}}$
) from the catalogue (Table S1) and using the homogenised luminosities (logL
⊙) from Table 2, the positions of 472 (236 binaries) stars on the H-R diagram are shown in Figure 7. Theoretical lines marking Zero Age Man Sequence (ZAMS) and Terminal Age Main Sequence (TAMS) from Pols et al. (Reference Pols, Schröder, Hurley, Tout and Eggleton1998) are drawn to indicate evolutionary status of the current sample. Almost the entire sample appears to be within the main-sequence band. Evidently, there are no supergiants despite the selection criteria not implying such a result directly. Considering the fact that evolved stars could be observed at larger distances than their main-sequence counterparts and the probability of having eclipses is higher if the radii of the components are larger, the absence of giants and supergiants in the present sample needs to be explained. Smaller number of evolved stars, which is a consequence of shorter lifetime of evolved phases, and low probability of evolving both components to the sizes comparable to each other, which permits the detection of eclipses, must be more effective than the eclipse favouring conditions. Obviously, much smaller size of companion stars exists, and/or huge difference of brightness between the components leave out some giants and supergiants to be detected as SB2 eclipsing binaries.
$\log T_{\text{eff}}$
) from the catalogue (Table S1) and using the homogenised luminosities (logL
⊙) from Table 2, the positions of 472 (236 binaries) stars on the H-R diagram are shown in Figure 7. Theoretical lines marking Zero Age Man Sequence (ZAMS) and Terminal Age Main Sequence (TAMS) from Pols et al. (Reference Pols, Schröder, Hurley, Tout and Eggleton1998) are drawn to indicate evolutionary status of the current sample. Almost the entire sample appears to be within the main-sequence band. Evidently, there are no supergiants despite the selection criteria not implying such a result directly. Considering the fact that evolved stars could be observed at larger distances than their main-sequence counterparts and the probability of having eclipses is higher if the radii of the components are larger, the absence of giants and supergiants in the present sample needs to be explained. Smaller number of evolved stars, which is a consequence of shorter lifetime of evolved phases, and low probability of evolving both components to the sizes comparable to each other, which permits the detection of eclipses, must be more effective than the eclipse favouring conditions. Obviously, much smaller size of companion stars exists, and/or huge difference of brightness between the components leave out some giants and supergiants to be detected as SB2 eclipsing binaries.
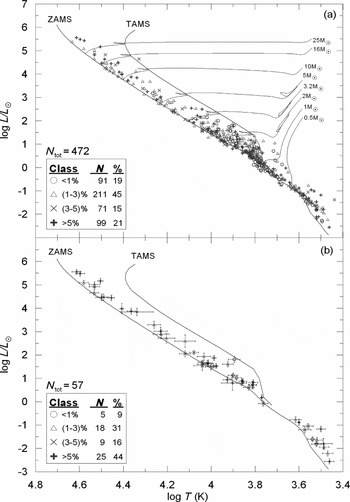
Figure 7. H-R diagram of 472 stars (a) and error bars (b) of 57 least accurate stars of the sample. Displayed error bars imply that most of the error bars in (a) are smaller than the symbols printed.
Although there are 514 stars (257 binaries) in the present sample, we are able to place 472 stars (236 binaries) with effective temperatures on the H-R diagram. This is because the catalogue (Table S1) has 21 systems (42 stars have no published temperatures; see Table S1) without temperatures. When solving the light and the radial velocity curves, some authors, who are not trusting stellar temperature determinations, are satisfied with the temperature ratios rather than absolute temperatures (i.e. Helminiak et al. Reference Helminiak, Konacki, Ratajczak and Muterspaugh2009). The obtained masses and radii for those 21 systems are still reliable. Therefore, they were included in the catalogue.
Sample stars on H-R diagram were displayed as four sub-samples according to accuracy limits. The four sub-samples [both mass and radius up to ± 1% accuracy (91 stars), between ± 1% and ± 3% (211 stars), between ± 3% and ± 5% (71 stars) and worse than ± 5% (99 stars)] were shown in Figure 7a with different symbols in order to investigate if there are any preferred positions among the data of different classes of accuracy. Except for the most accurate sub-sample (91 stars) which covers a spectral range from A0 to M3 corresponding to a temperature range 10 000 K to 3 000 K, the other sub-samples have full ranges covering spectral types from O5 to M3 and temperatures from 43 000 K to 3 000 K. Preference of certain locations by certain sub-samples cannot be noticed except for the most accurate sub-sample. All other sub-samples appear to be evenly distributed along the main-sequence band.
In order to investigate accuracy and precision of the positions on the H-R diagram (Figure 7), the published uncertainties of radii and temperatures have been propagated to estimate the uncertainty of the luminosities. Among the 472 stars (236 binaries) plotted on Figure 7a, the seven systems (2MASS J01542930+0053266, 2MASS J16502074+4639013, 2MASS J19071662+4639532, GZ Leo, HY Vir, δ Vel, V415 Aql) do not have published uncertainties for their temperatures and seven systems (V467 Vel, IQ Aqr, SZ Cam, RX Her, V2083 Cyg, MR Del, AE For) were found to have uncertainty of temperatures only for their secondaries. Leaving the systems without any temperature uncertainty out, and assigning same uncertainty to the primary temperature for those having only uncertainty for the secondary temperatures, the relative uncertainties of luminosities for 458 stars (229 binaries) were computed by the method of error propagation. All computed uncertainties are less than 51% except for one star, which is the secondary of V1292 Sco. The 18.8% uncertainty of the temperature and 51.9% uncertainty on the radius propagate to be 128% for the luminosity of this star. Among 458 stars, 87.6% (401 stars) have relative errors less than 20%. The rest, 57 stars are placed on the H-R diagram with their error bars (Figure 7b) in order to investigate if certain locations are preferred by the stars with the biggest error bars. Even distribution along the main-sequence band covering the full range of spectral types is clear. However, one must remember that the most accurate sub-sample (91 stars) does not mean to have the most accurate positions on the H-R diagram because an uncertainty at an effective temperature contributes at both axes. Consequently there are contributions from all sub-samples to Figure 7b. Nevertheless, it is interesting to notice that the least accurate sub-sample dominates (44%) although it occupies only 21% (99 stars) among 472 stars in Figure 7a. The contributions to Figure 7b from the other three sub-samples are 5, 18, and 9, which sum up to be 56%, respectively from the groups of 91, 211, and 71 stars of the most accurate and the other two sub-samples in Figure 7a.
Determination of observed temperatures appears to be the biggest obstacle of observational astrophysics to study stellar evolution on the H-R diagram. Considering the fact that, some authors prefer to publish internal errors, which could be unrealistically small, e.g. the effective temperatures of AE For $T_{\text{eff}}$
(pri) = 4100 ± 6 K and
$T_{\text{eff}}$
(pri) = 4100 ± 6 K and $T_{\text{eff}}$
(sec) = 4055 ± 6 K (Rozyczka et al. Reference Rozyczka, Pietrukowicz, Kaluzny, Pych, Angeloni and Dékány2013), XY UMa
$T_{\text{eff}}$
(sec) = 4055 ± 6 K (Rozyczka et al. Reference Rozyczka, Pietrukowicz, Kaluzny, Pych, Angeloni and Dékány2013), XY UMa $T_{\text{eff}}$
(pri) = 5200 ± 7 K and
$T_{\text{eff}}$
(pri) = 5200 ± 7 K and $T_{\text{eff}}$
(sec) = 4125 ± 7 K (Pribulla et al. Reference Pribulla, Chochol, Heckert, Errico, Vittone, Parimucha and Teodorani2001), and DV Psc
$T_{\text{eff}}$
(sec) = 4125 ± 7 K (Pribulla et al. Reference Pribulla, Chochol, Heckert, Errico, Vittone, Parimucha and Teodorani2001), and DV Psc $T_{\text{eff}}$
(pri) = 4450 ± 8 K and
$T_{\text{eff}}$
(pri) = 4450 ± 8 K and $T_{\text{eff}}$
(sec) = 3614 ± 8 K (Zhang & Zhang Reference Zhang and Zhang2007), many of the uncertainties on the effective temperatures of the present sample are optimistic. But still, the present sample has the most accurate stellar positions on the H-R diagram ever obtained from the simultaneous solutions of light and radial velocity curves of detached eclipsing binaries and the stellar parameters would be the most reliable, thus, empirical relations and astrophysical theories could be tested.
$T_{\text{eff}}$
(sec) = 3614 ± 8 K (Zhang & Zhang Reference Zhang and Zhang2007), many of the uncertainties on the effective temperatures of the present sample are optimistic. But still, the present sample has the most accurate stellar positions on the H-R diagram ever obtained from the simultaneous solutions of light and radial velocity curves of detached eclipsing binaries and the stellar parameters would be the most reliable, thus, empirical relations and astrophysical theories could be tested.
3.2 Space distributions
Distributions of the present sample on the equatorial and the Galactic coordinates are displayed in Figure 8. Although 257 systems appear to be homogeneously distributed, a significant asymmetry between northern and southern hemispheres is indicated by the numbers in the lower right corner of Figure 8a. There exist 168 northern binaries with positive declinations (δ ⩾ 0°), while there are nearly half number of binaries in the southern hemisphere, that is, 89 systems with negative declination (δ < 0°). Detailed analysis is not in the scope of the present paper, but in the first approximation, the excess in the northern hemisphere could be explained by overpopulation of the northern telescopes and/or astronomers to the southern ones. Concentration of stars towards the Galactic plane is noticeable even on the equatorial coordinates that the Galactic plane drawn on Figure 8a, where the Galactic centre is marked by a star symbol.
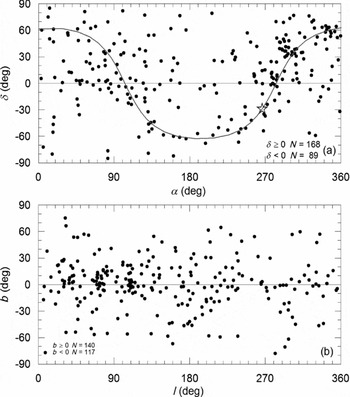
Figure 8. Distributions on the equatorial (a) and the Galactic (b) coordinates. Sinusoidal line in the upper panel is the Galactic plane, where the Galactic centre is marked as a big star symbol.
Although a negligible north–south asymmetry is indicated by the numbers at the lower left corner, nearly symmetric distribution with respect to Galactic plane is shown in Figure 8b. It is also noticeable that there are regions on the Galactic plane where the stars appear to be grouping towards the Galactic longitudes 30, 70, and 110. These are the directions associated with the local arms structure of our Galaxy. On the other hand, less populated, ‘empty region’ towards l = 250, b = −45° are also noticeable in Figure 8b.
Among the 257 systems in the present sample, 205 systems were found to have distances published in articles from where catalogue data were taken. Therefore, we had to search extra sources for the distances of 52 systems, where 24 of them were found to have Hipparcos parallaxes (van Leeuwen Reference van Leeuwen2007). For the rest with no trigonometric parallaxes, the formulae by Bilir et al. (Reference Bilir2008a) were used in estimating distances. Finally, the distance distribution of the sample in the Solar neighborhood is presented in Figure 9. Figure 9b indicates the number of systems within each incremental 200 pc bins. Accumulated form of the same data (Figure 9a) indicates that 90% of sample stars are contained within 1 kpc from the Sun, where the rest are located at distances up to 4.6 kpc. Such distances are far more than the detection limit of Hipparcos (Perryman et al. Reference Perryman1997). In fact, excluding the parallaxes with large relative errors (e.g. σπ/π > 0.5) in the sample, there are 119 systems (46.3%) with reliable parallaxes, thus, more than half (53.7%) of the sample had to rely on the photometric distances. Compared to other field stars, the present sample is advantageous to provide the most accurate photometric distances together with physical parameters.
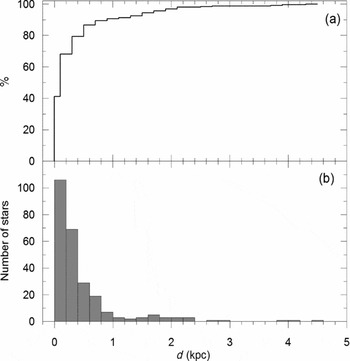
Figure 9. Distance distributions of the sample stars in the Solar neighborhood. (a) is in cumulative and (b) is in frequencies.
Figure 10 displays space distribution of the sample in the Solar neighbourhood on the Galactic plane (X–Y), where X is towards the Galactic centre and Y is towards Galactic rotation. With a median distance of 1 528 pc, O-type binaries are the most distant objects. Closest one is SZ Cam which is 870 pc away (Tamajo et al. Reference Tamajo, Munari, Siviero, Tomasella and Dallaporta2012), the most distant one is DH Cep with 2 767 pc (Hilditch, Harries, & Bell Reference Hilditch, Harries and Bell1996). There exist 10 binaries with O-type primary in the present sample. The distant stars, mostly O-B type binaries on the X–Y plane were interesting (Figure 10a) as if to imply one of the local Galactic arms. Indeed, after plotting O-type binaries in our sample on Figure 11, which shows Galactic arm structure by Xu et al. (Reference Xu, Voronkov, Pandian, Li, Sobolev, Brunthaler, Ritter and Menten2009), the position of O-type binaries and the Sun on the Galactic plane became clear. The present sample is mostly located within 1 kpc in the Solar neighborhood which is itself positioned between the two local arms, Carina-Sagittarius and Orion Spur. The Orion spur itself is situated between the Perseus and Carina-Sagittarius arms.
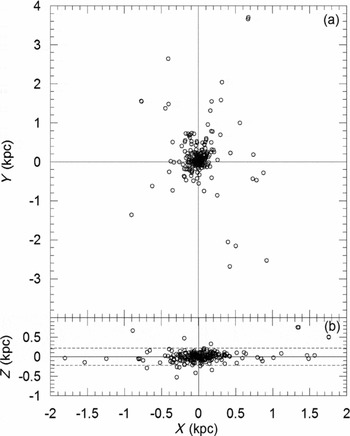
Figure 10. Distribution on the Galactic plane (a). X in the direction towards the Galactic centre, Y in the Galactic rotation. Distribution on the plane (X–Z) perpendicular to the Galactic disc (b). Dashed line represents the scaleheight of the thin disc. The scaleheight of the thin disc (H = 220 pc) is taken from Bilir et al. (Reference Bilir, Karaali, Ak, Yaz and Hamzaoğlu2006a, Reference Bilir, Karaali and Gilmore2006b).
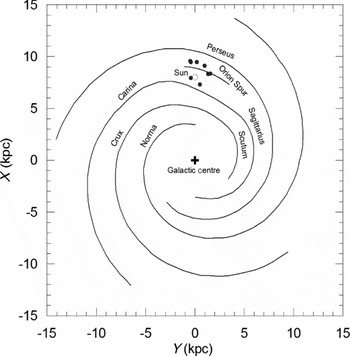
Figure 11. O-type binaries on the Galactic plane. The position of the spiral arms taken from Xu et al. (Reference Xu, Voronkov, Pandian, Li, Sobolev, Brunthaler, Ritter and Menten2009). It is assumed that the distance to the Galactic centre of the Sun is 8 kpc.
Figure 10b shows the distribution perpendicular to the Galactic plane, where the scaleheight of the thin disc is H = 220 pc according to Bilir et al. (Reference Bilir, Karaali, Ak, Yaz and Hamzaoğlu2006a), Bilir, Karaali, & Gilmore (Reference Bilir, Karaali and Gilmore2006b), and Bilir et al. (Reference Bilir, Cabrera-Lavers, Karaali, Ak, Yaz and López-Corredoira2008b). Distant systems, mostly with O-B type binaries on the Galactic plane are distinguishable from the concentrated central region.
On a closer look, the space distribution of the concentrated region was shown in Figure 12. Unlike large-scale appearance, the very central region within 300 pc could be described evenly spread over the space. Nevertheless, even in this closer look the local Galactic disc structure is noticeable when the scaleheight lines were drawn in Figure 12b. One may easily notice that all local binaries (d ⩽ 300 pc) are contained within the thin-disc scaleheight limit except for only three systems.
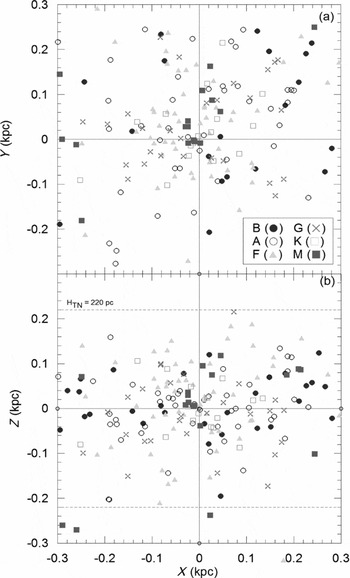
Figure 12. Nearby distributions of sample binaries within 300 pc.
3.3 How good single stars were represented?
The components of close binary systems with proximity effects are flattened at various degrees by fast rotation and tidally elongated towards each other by the mutual gravity in addition to irradiation effects. All these effects may be negligible in the case of detached binaries, where single star evolution could be applied to each component in better approximation. It is advantageous to know how good the present sample represents non-rotating spherical single stars of a given mass. However, the flattening due to rotation and the mass loss due to stellar winds may not be ignorable even for the case of single stars.
The tidal evolution forces the components of close binaries into tidal synchronisation. For interested readers, the catalogue contains projected rotational velocities (vsini), from which one can compute if tidal synchronisation was achieved. More importantly, rotation and Roche lobe filling ratio are two indicators for the component stars deviating from sphericity. For the sake of confidence, the sphericity of the present sample was inspected by computing the Roche model of each binary.
Mass, mass ratio, and orbital period determine the sizes and the shapes of the Roche lobes (Kopal Reference Kopal1978). Classical definition of close (interacting) binary systems was given as R 1 + R 2 ⩾ 0.1a, where a is the semi-major axis of the orbit and R 1, 2 are the radii of the components, the subscripts are for the primary and the secondary. The counter definition used for non-interacting binaries, R 1 + R 2 < 0.1a, however, implies the components are well-detached and very far from the proximity effects. Being well contained in the Roche lobes, their shapes are believed to be spherical. Unfortunately, the number of such systems is only 24 in the present sample and much less in previous samples (four in the list of Torres et al. Reference Torres, Andersen and Giménez2010). In order to increase the number of detached systems, one prefers to loosen the condition R 1 + R 2 < 0.1a.
Equipotential surface of a component star is represented by four fractional radii defined as: r(side), r(back), r(point), and r(pole). The smallest of those is r(pole) and the largest one is r(point). The difference between those fractional radii increases by increasing filling ratio. In order to test and establish a well-structured limit for deviation from the sphericity we have computed Roche model of the sample binaries using Binary MakerFootnote 1 . This allowed us to compare fractional radii and make eye inspection of the shapes of the component.
Figure 13 displays how radii and shapes of the components change with respect to the Roche lobes from 60% filling to higher rates of filling factors (FF), which is defined as FF = $\bar{r}/\bar{r}_{RL}$
, where
$\bar{r}/\bar{r}_{RL}$
, where $\bar{r}$
is average radius, and
$\bar{r}$
is average radius, and $\bar{r}_{\text{RL}}$
is Roche-lobe radius relative to the semi-major axis. It can be deduced from an eye inspection that deviations from sphericity could be ignorable for small FF which can be up to 75% , a value corresponding to the difference between r(side) and r(pole) which is less than 1%. By the way, the difference between r(point) and r(side) being larger than 1% indicates tidal elongation and tidal synchronisation when
$\bar{r}_{\text{RL}}$
is Roche-lobe radius relative to the semi-major axis. It can be deduced from an eye inspection that deviations from sphericity could be ignorable for small FF which can be up to 75% , a value corresponding to the difference between r(side) and r(pole) which is less than 1%. By the way, the difference between r(point) and r(side) being larger than 1% indicates tidal elongation and tidal synchronisation when $P_{\text{rot}}=P_{\text{orb}}$
. By a careful look, eye could feel larger deviations (deviation > 1% corresponding FF > 75%), thus, non-spherical shapes of the component stars of V478 Cyg and DH Cep in Figure 13 are noticeable. On the other hand, with less FF (FF < 75%), component stars of AG Ari and V760 Sco appear spherical.
$P_{\text{rot}}=P_{\text{orb}}$
. By a careful look, eye could feel larger deviations (deviation > 1% corresponding FF > 75%), thus, non-spherical shapes of the component stars of V478 Cyg and DH Cep in Figure 13 are noticeable. On the other hand, with less FF (FF < 75%), component stars of AG Ari and V760 Sco appear spherical.
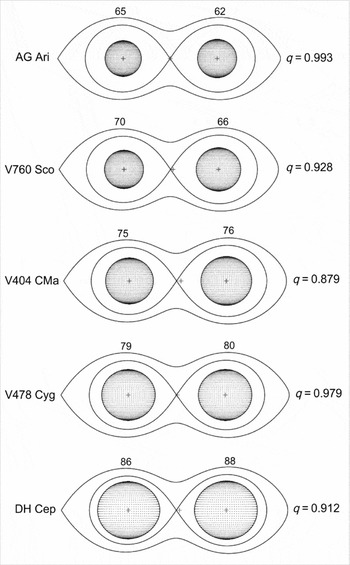
Figure 13. Examples of Roche lobe filling ratios. Names and mass ratios are at the sides, while filling ratio (FF, filling factor) is written on the top. By an eye inspection, one can notice sphericity spoils after FF 75.
The distribution of the filling ratios of the component stars in the present sample is displayed in Figure 14. Accordingly, 426 stars (82.9% of the sample) have FF less than 70% , which could be assumed to have spherical shapes. If one could expand sphericity limit to 75% FF , the number of spherical stars increases to 455 (88.5% of the sample). Overall, 20 binaries were found as both components exceed the limit of 75% FF , which includes seven O-type binaries. The number of binaries having at least one component above the limit 75% is 39, which includes nine O-type binaries. That is, 19 of these 39 binaries have only one component spherical, and the rest have both components non-spherical. We first attempted to discard the systems with non-spherical components. However, the number of O-type binaries was only 10 (3.9% of the sample). Among the 10, only one (Y Cyg, with $P_{\text{orb}}=2.996$
d) was found to have both components with spherical shapes. Therefore, we have decided not to discard the systems with more than 75% FF and left this choice to researchers, who may alter sphericity limit according to the their specific needs.
$P_{\text{orb}}=2.996$
d) was found to have both components with spherical shapes. Therefore, we have decided not to discard the systems with more than 75% FF and left this choice to researchers, who may alter sphericity limit according to the their specific needs.
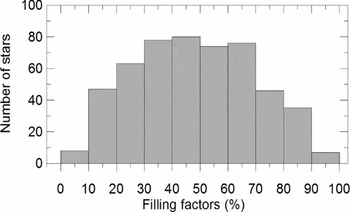
Figure 14. Distribution of the filling factors among 514 stars (257 binaries) of the sample.
4 CONCLUSIONS
-
• The most accurate stellar parameters (masses, radii, temperatures, surface gravities, luminosities, projected rotational velocities, radial velocity amplitudes, mass ratio, orbital period, orbital inclination, semi-major axis, eccentricity) were compiled from the simultaneous solutions of light and radial velocity curves of detached double-lined eclipsing binaries.
-
• The masses and radii were homogenised using most recent values of GM ⊙ = 1.3271244 × 10²⁰ m3 s− 2 (Standish Reference Standish1995) and R ⊙ = 6.9566 × 10⁸ m (Haberreiter et al. Reference Haberreiter, Schmutz and Kosovichev2008). Surface gravities and luminosities were recomputed using homogenised masses and radii.
-
• Apparent magnitudes, orbital periods, masses, radii, mass ratios, spectral types, and space distribution of the present sample were discussed.
-
• The number of stars with both mass and radius as accurate as 1% is 93, as accurate as 3% is 311, and as accurate as 5% is 388.
-
• Filling ratios of the current sample were studied. Thus, the geometrical shapes of the component stars were determined. Up to 75% of FF, stars are found almost spherical with 1% uncertainty.
-
• Giants and supergiants are missing in the present sample. Observational astronomers are encouraged to explore eclipsing binaries among giants and supergiants. Improving light curve observing techniques for discovering small amplitude SB2 eclipsing systems is a challenge
ACKNOWLEDGEMENTS
This work has been supported in part by the Scientific and Technological Research Council of Turkey (TÜBİTAK) grant numbers 106T688 and 111T224. Authors would like to thank anonymous referee who provided valuable comments for improving the manuscript and Mr. Muzaffer Karasulu for proof reading. This research has made use of the SIMBAD database, operated at CDS, Strasbourg, France and NASA’s Astrophysics Data System. We would like to thank Dr. Nilda Oklay for helping online material.


