


INTRODUCTION
A greater appreciation of the seasonal patterns of infectious intestinal disease (IID) may help to elucidate disease aetiology. Furthermore, understanding the association between variations in the incidence of gastroenteritis, climatic conditions and bathing water quality may provide important epidemiological information for health services, environmental planning and policy makers.
IIDs are caused by a variety of pathogens, ranging from acute bacterial and viral infections such as Campylobacter spp. and norovirus to chronic parasitoses such as cryptosporidiosis. Therefore, symptoms, mode of transmission, and incubation period vary depending on the agents of infection. The incidence of gastroenteritis has been shown in many studies to be seasonal and the pattern of seasonality varies depending on the causative pathogen. Several studies show strong associations between Campylobacter spp. and temperature [Reference Bi1–Reference Louis3] with incidence peaking in spring [Reference Kovats4, Reference Tam5]. Spatial differences in peak times have also been reported [Reference Nyelen6] while linear association between climatic factors and salmonellosis has also been reported [Reference Kovats7, Reference Zhang, Bi and Hiller8]. Colder temperature and lower humidity are known to be associated with increased admission to hospital for rotavirus infection [Reference D'Souza, Hall and Becker9, Reference Brandt10].
IID is known to be associated with temperature. Onozuka & Hashizume [Reference Onozuka and Hashizume11] found that the effect of temperature on paediatric infectious gastroenteritis is strongest at lower levels of temperature than at higher levels in Japan. A negative association was found between humidity and infectious gastroenteritis. Hall et al. [Reference Hall12] also found a positive trend in the temperature–gastroenteritis relationship in Australia where a 1°C increase was associated with a relative increase in the probability of gastroenteritis of 2·5%.
The association between health outcomes and recreational water quality has been studied by researchers for more than six decades [Reference Stevenson13, Reference Moore14]. Many studies have reported an increased risk of illness resulting from exposure to polluted bathing waters [Reference Pruss15, Reference Wade16]. In recognizing the health risks posed by exposure to polluted bathing waters, regulatory authorities have implemented legislation which sets quality standards for recreational waters. For example, the revised European Union Bathing Water Directive (2006/7/EC) [17] replaces Directive 76/160/EEC and makes specific provisions for monitoring, classification and management of bathing water quality and provision of information to the public. The overall objective of the 2006 Directive is to preserve, protect and improve the environment and for protection of public health. This objective has to be achieved across EU member states by 2015. The 2006 Directive specifies tighter microbiological standards that use more reliable indicator parameters for predicting microbiological health risks associated with bathing in marine and fresh waters [Reference Pruss15, 18].
The association between weather, bathing water quality and the incidence of IID in two Scottish NHS boards was investigated using routinely collected health, environmental and climate-related variables from 1998 to 2008.
METHODS
Data
Laboratory-confirmed cases of viral and non-viral gastrointestinal pathogens were supplied by Health Protection Scotland (HPS) for the period 1998–2008. For the purpose of this investigation, data from two NHS boards [Ayrshire & Arran (AA) and Glasgow & Clyde (GC)] were used.
Weather information was sourced from Weather Underground (www.wunderground.com). Monthly average temperature and humidity were used in the analysis. Humidity serves as a surrogate for rainfall which is not available for the two health boards. Routine data on bathing water quality from 22 designated bathing waters (shown in Fig. 1) geographically located within the two NHS Board areas were supplied by the Scottish Environment Protection Agency (SEPA). SEPA routinely sampled bathing waters at least twice monthly during the bathing season (May–September) and monthly during the off-season between 1998 and 2008. All data collected from the 22 bathing sites within this period were used in this investigation. Figure 1 depicts the geographical location of the bathing water sites used in this study. All the sites are along the same coastal line. The parameters measured to assess bathing water quality were faecal indicator organisms (FIOs), faecal coliform (FC) and faecal streptococci (FS), as colony-forming units per 100 ml (c.f.u./100 ml).
Fig. 1. Geographical locations of the bathing water designated sites used in this study.
Faecal indicator enumerations were mostly reported as actual counts. Censored data values, below limits of 2, 10 and 100, made up 18% (FS) and 14% (FC) of the data series. Imputation for these censored values was conducted using the regression on order statistics (ROS) method [Reference Lee and Helsel19].
Modelling approach
Monthly counts of viral and non-viral groups of gastro-pathogens for GC and AA Health Board areas were used. These counts were assumed to be Poisson distributed.
Based on a preliminary site-specific analysis, we observed that the variability, seasonality and trend in water quality measures across the 22 bathing sites were similar. Consequently, monthly averages across the 22 sites were obtained to produce a single monthly series for each of the water quality measures. We then used this series to separately model the relationship with gastrointestinal pathogens in the two NHS Board areas. The use of the single series for both NHS Boards is informed by the understanding that individuals residing in these areas could visit any of the bathing water locations. Log10 transformation of the FIOs were obtained and used in the model.
Generalized additive models (GAM) were fitted in R using the ‘mgcv’ package [Reference Wood20]. This approach is based on non-parametric procedures which estimate the regression curve without assuming any particular parametric form but allows the data greater flexibility to estimate the nature of the population mean curve. Hence, the fitted curve is obtained empirically and does not depend on any pre-specified or imposed structure on the data. The ‘mgcv’ package uses penalized cubic regression splines. The smoothing parameters were chosen using the unbiased risk estimation (UBRE) criterion [Reference Wahba21], where the smoothing parameters with the lowest risk estimate is selected.
Given that $Y_{it} \sim Poi(\lambda _{it} )$
then,
$Y_{it} \sim Poi(\lambda _{it} )$
then,
 $${\rm Log(}\lambda _{it} {\rm ) =} \alpha {\rm +} s{\rm (}{\rm month}_i ) + {\rm s(year}_t {\rm ),}$$
where Y it is the count of gastrointestinal infections in month i within year t; λ it is the expected value of the counts; intercept α is the average log count; s is a non-parametric smooth spline function which represents the flexible functional form of the association between each covariate and log count of gastrointestinal infections. A penalized cubic spline was used for all the model terms and a cyclic smoother was applied to the seasonal term. The smooth effect of month accounts for the seasonal pattern while year represents the long-term trend effect. Model 1 was used to examine the within-year and between-year variations in the infectious pathogens in the two NHS Boards.
Model 1 assumes a constant seasonal pattern over the years. A model that allows the seasonal pattern to vary within year was applied and an interaction term s(month i , year t ) was introduced. The bivariate smooth term for month and year was included to capture the differences in seasonal peaks across the years. Additional covariates such as temperature and humidity and FIO counts can also be incorporated as in models 2 and 3 below.
 $$\eqalign{{\rm Log(}\lambda _{it} {\rm ) =} \alpha {\rm +} s{\rm (}{\rm month}_i, {\rm year}_t ) + s{\rm (temp}_{it} {\rm ) +} s({\rm hum}_{it} )}\!. $$
Model 2 investigates the effect of weather on the mean number of cases of gastrointestinal infections in the two NHS Boards. Monthly average temperature and humidity were then introduced to the model.
 $$\eqalign{{\rm Log}(\lambda _{it}) = &\ \alpha+ s({\rm month}_i, {\rm year}_t ) + s{\rm (temp}_{it} )\cr\tab + s({\rm hum}_{it} )+ s(\log (F)_{it} ).}$$
Model 3 is the full model, incorporating the additive smooth effect of the FIOs. Note F = FS or FC.
The adequacy of each model was assessed by checking for systematic deficiencies of the fitted model using the residuals. There was no evidence of departure from modelling assumptions including over-dispersion. It is of interest to compare the three models in order to establish the model that best describes the data. Given that GAM minimizes the UBRE criterion, we compared the model UBRE score and Akaike's Information Criterion (AIC). The model with the lowest UBRE score and AIC was judged the better model. This is further confirmed using the generalized likelihood ratio test (GLRT) when selecting the best model or for assessing the significance of a covariate introduced into the model. For instance, comparing models 2 and 3 using GLRT will inform if the inclusion of the FIOs in model 3 is worthwhile.
RESULTS
Trends and seasonal patterns
Results from fitting the additive model 1 indicate statistically significant seasonal patterns and long-term trends for each pathogen group in the two NHS Boards. Results for the two pathogen groups are shown in Figure 2(a, b). Model estimates (dotted lines) are plotted with the observed cases (black lines) in the first panel of Figure 2(a, b).
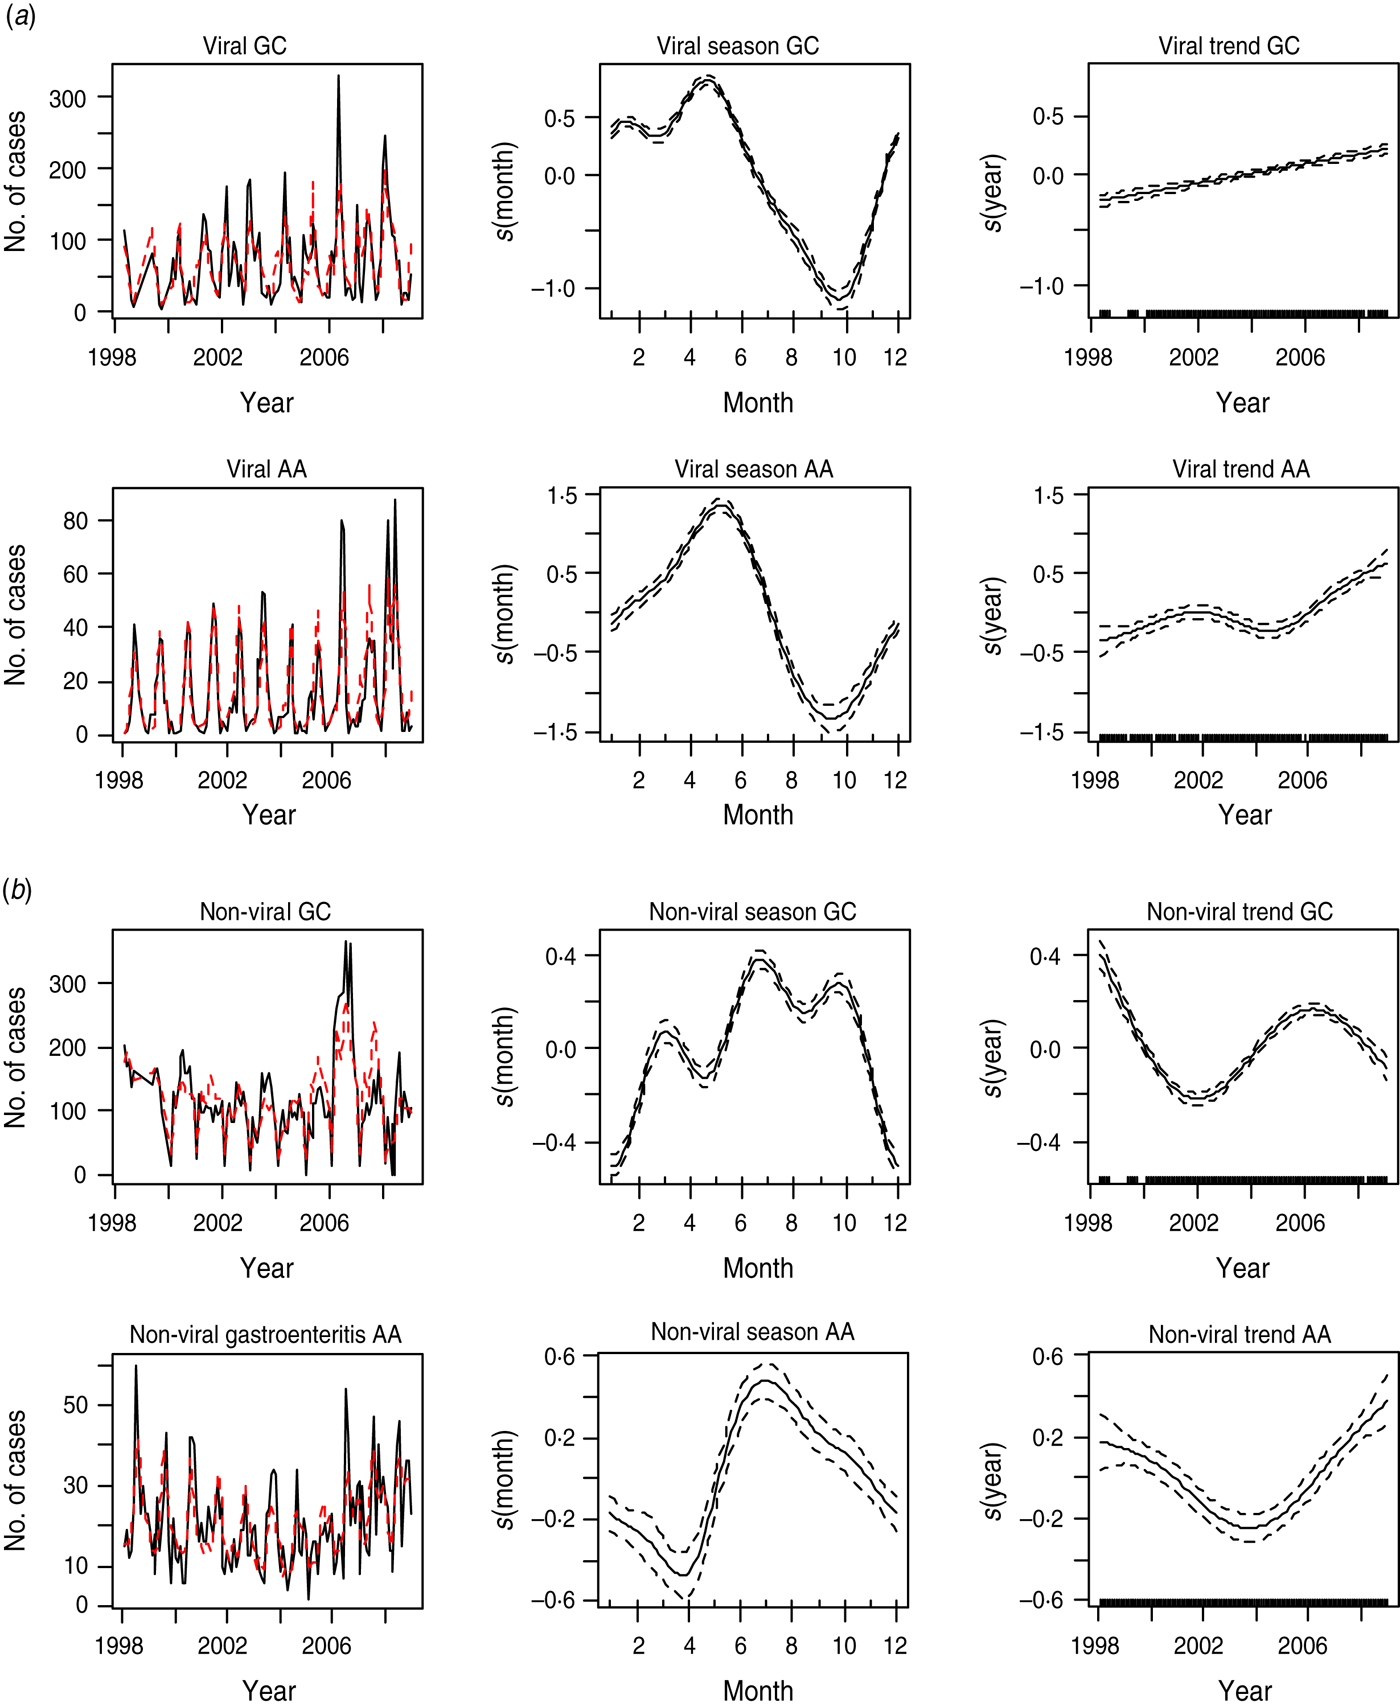
Fig. 2 [colour online]. (a) The first panel shows the observed monthly counts (solid line) and model estimates (dotted line) of viral gastroenteritis. The second and third panels show the seasonal and trend patterns, respectively, of viral intestinal infections in Glasgow & Clyde (GC) and Ayrshire & Arran (AA), respectively. (b) The first panel shows the observed monthly counts (solid line) and model estimates (dotted line) of non-viral gastroenteritis. The second and third panels show the seasonal and trend patterns, respectively, in GC and AA.
For the viral group, the peak incidence of infection, as depicted by the plots in the second panel of Figure 2 a, was in May and the lowest levels were in October. The trend generally increased in both NHS Boards over the years (third panel of Fig. 2 a).
Non-viral gastrointestinal infections (as shown in Fig. 2 b), peak in summer (July). The lowest levels of infection were in winter. On average, the number of cases declined between 1998 and 2002 in GC after which they increased until 2006 and declined thereafter. The trend has generally been increasing in AA since 2004 after declining between 1998 and 2004 (rightmost panel of Fig. 2 b).
The seasonal plot for non-viral infection in GC suggests the existence of a trimodal peak. The peaks occurred in March, July and September, respectively, with July having the highest peak. This may be due to variations in seasonality in the individual pathogens that make up this non-viral group.
Relationship with weather
Figure 3 shows time-series plots of monthly counts of viral gastroenteritis with average monthly temperature and relative humidity for AA. It can be observed from these plots that average peaks of viral gastrointestinal infections occur before temperature peaks and when relative humidity is at its lowest. Seasonal peaks of viral gastroenteritis differ for different years and appear to be influenced by very low levels of humidity and moderate levels of temperature.
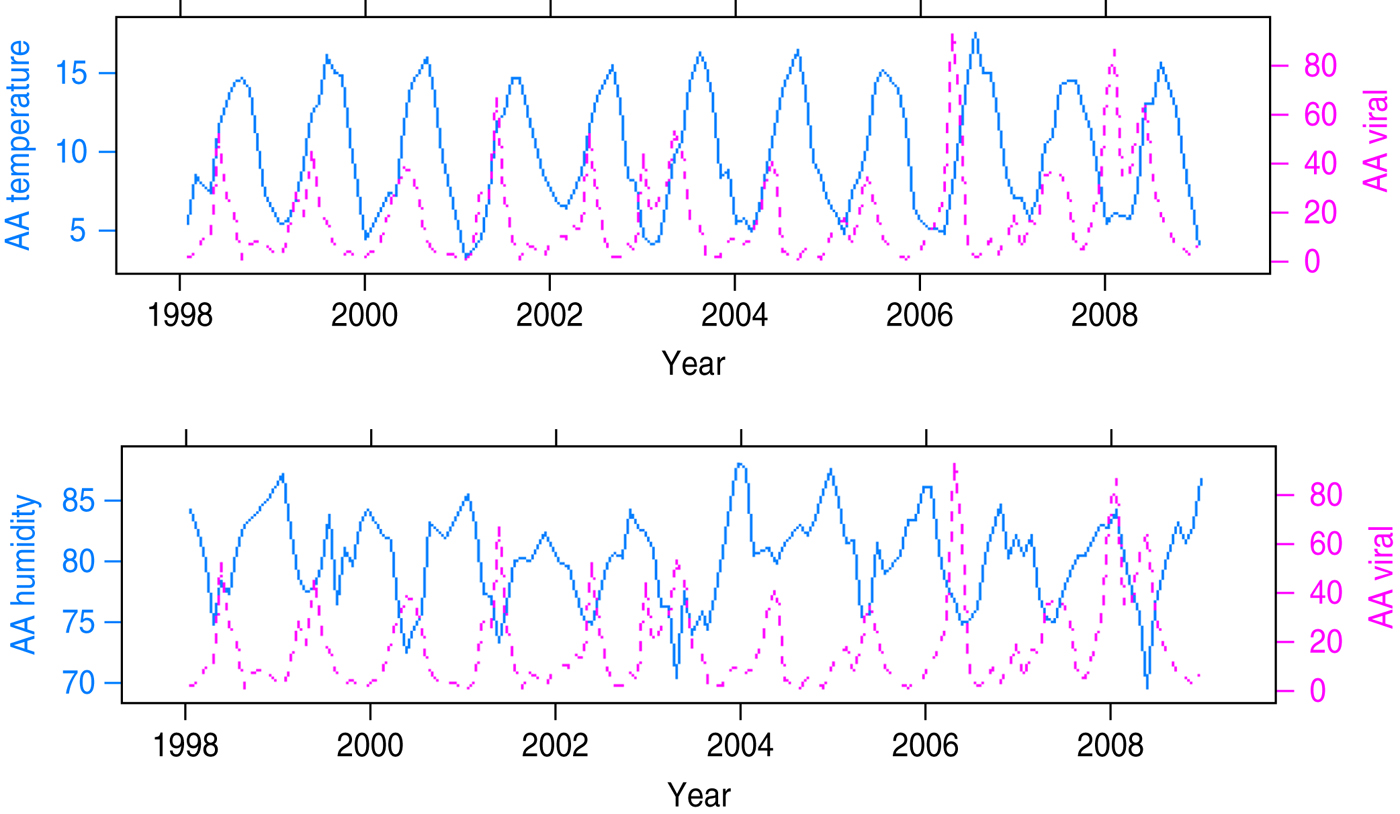
Fig. 3 [colour online]. Seasonal patterns of temperature, humidity (solid lines) and viral gastroenteritis (dotted lines) in Ayrshire and Arran (AA).
Figure 4 is a summarized version of Figure 3 and depicts plots of the average seasonal cycle of the intestinal pathogens against those of temperature and relative humidity.
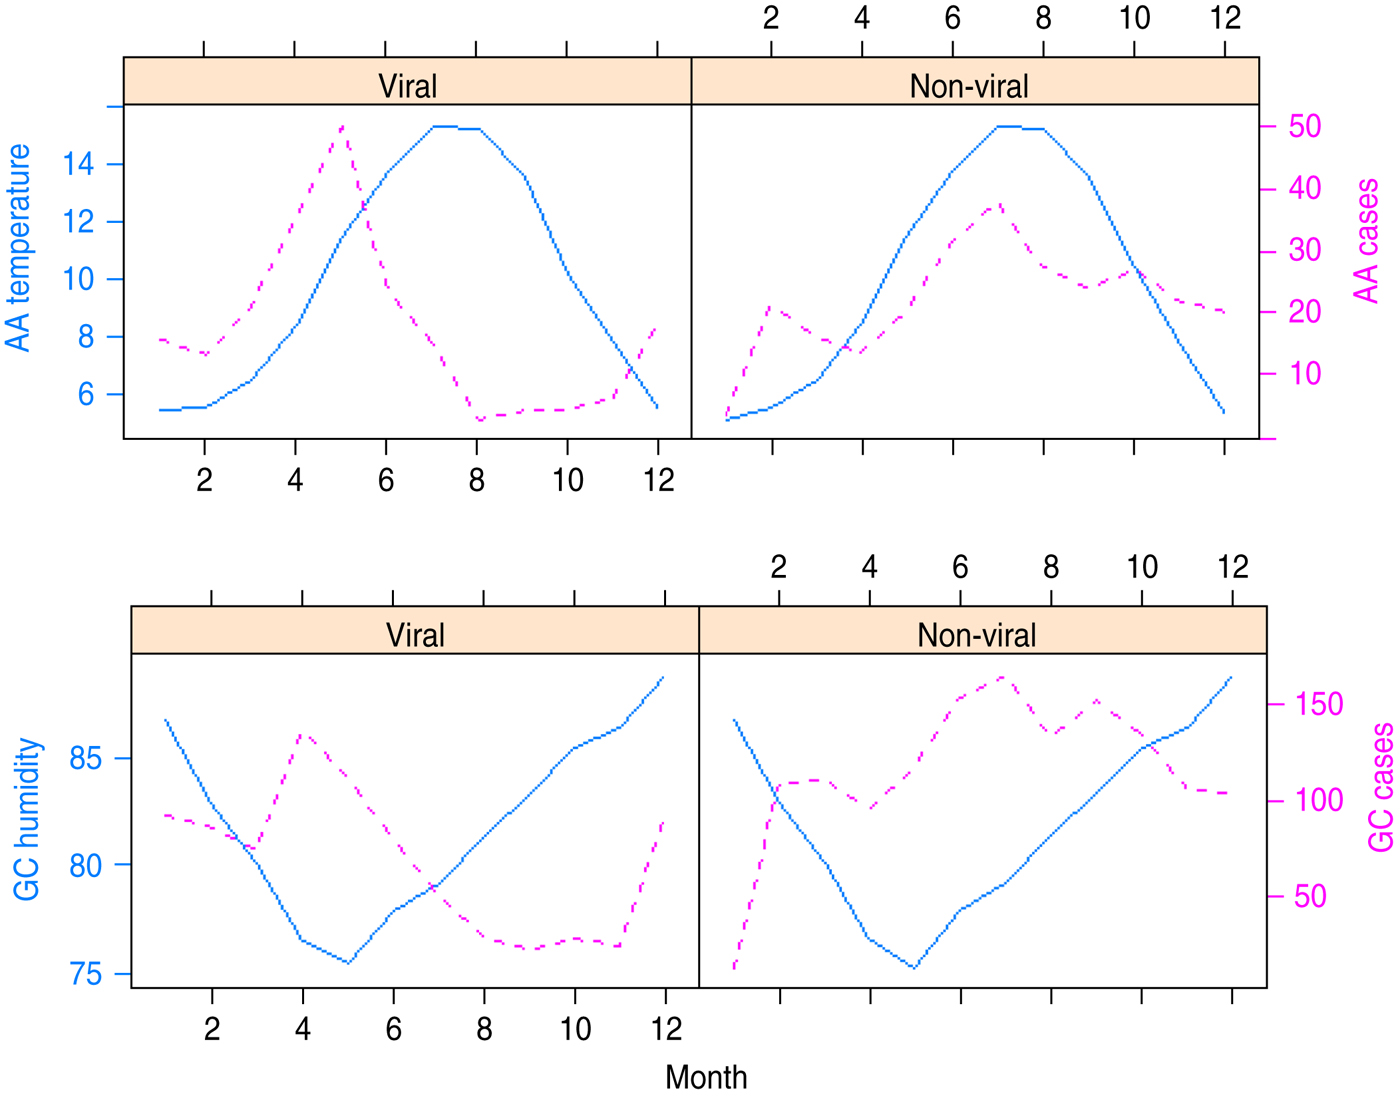
Fig. 4 [colour online]. The rows show average seasonal patterns of temperature and humidity (represented with solid lines) in Ayrshire & Arran (AA) and Glasgow & Clyde (GC), respectively. Viral and non-viral gastroenteritis for the two areas are shown by the dotted lines. The trimodal peaks of non-viral gastroenteritis is obvious in the two areas.
The relationship between viral gastrointestinal infection and humidity is more sharply defined in Figure 4. Viral intestinal infections increased as humidity declined and reached the highest level when humidity was at its lowest point. It then decreased as humidity increased above its minimum value. This describes an inverse association between humidity and viral intestinal infections.
The average number of monthly cases of non-viral infections peaked at a moderately high humidity threshold and decreased at levels higher than this threshold.
The plots in Figure 4 tend to suggest that peak average viral infections occurred when average temperature was ∼11°C and average relative humidity was 76% in GC and AA. Incidence appears to be on the decline for temperature and relative humidity above these threshold values.
The monthly average number of cases of non-viral intestinal infections is highest at moderately high temperature and relative humidity. The peak of non-viral intestinal infection seems to have occurred when the average temperature was ∼15°C and the average relative humidity was ∼80% in both GC and AA.
From Figure 4, it can be seen that the peak of viral intestinal infection occurs in May when humidity is lowest and temperature moderately low. Non-viral intestinal infections occur at moderately high temperature and humidity with peaks in March, July and September. However, the maximum value is in July. Results from model 2 indicate a statistically significant additive effect of temperature and humidity on the average number of cases of intestinal infections in both GC and AA NHS Boards as shown in Figure 5.
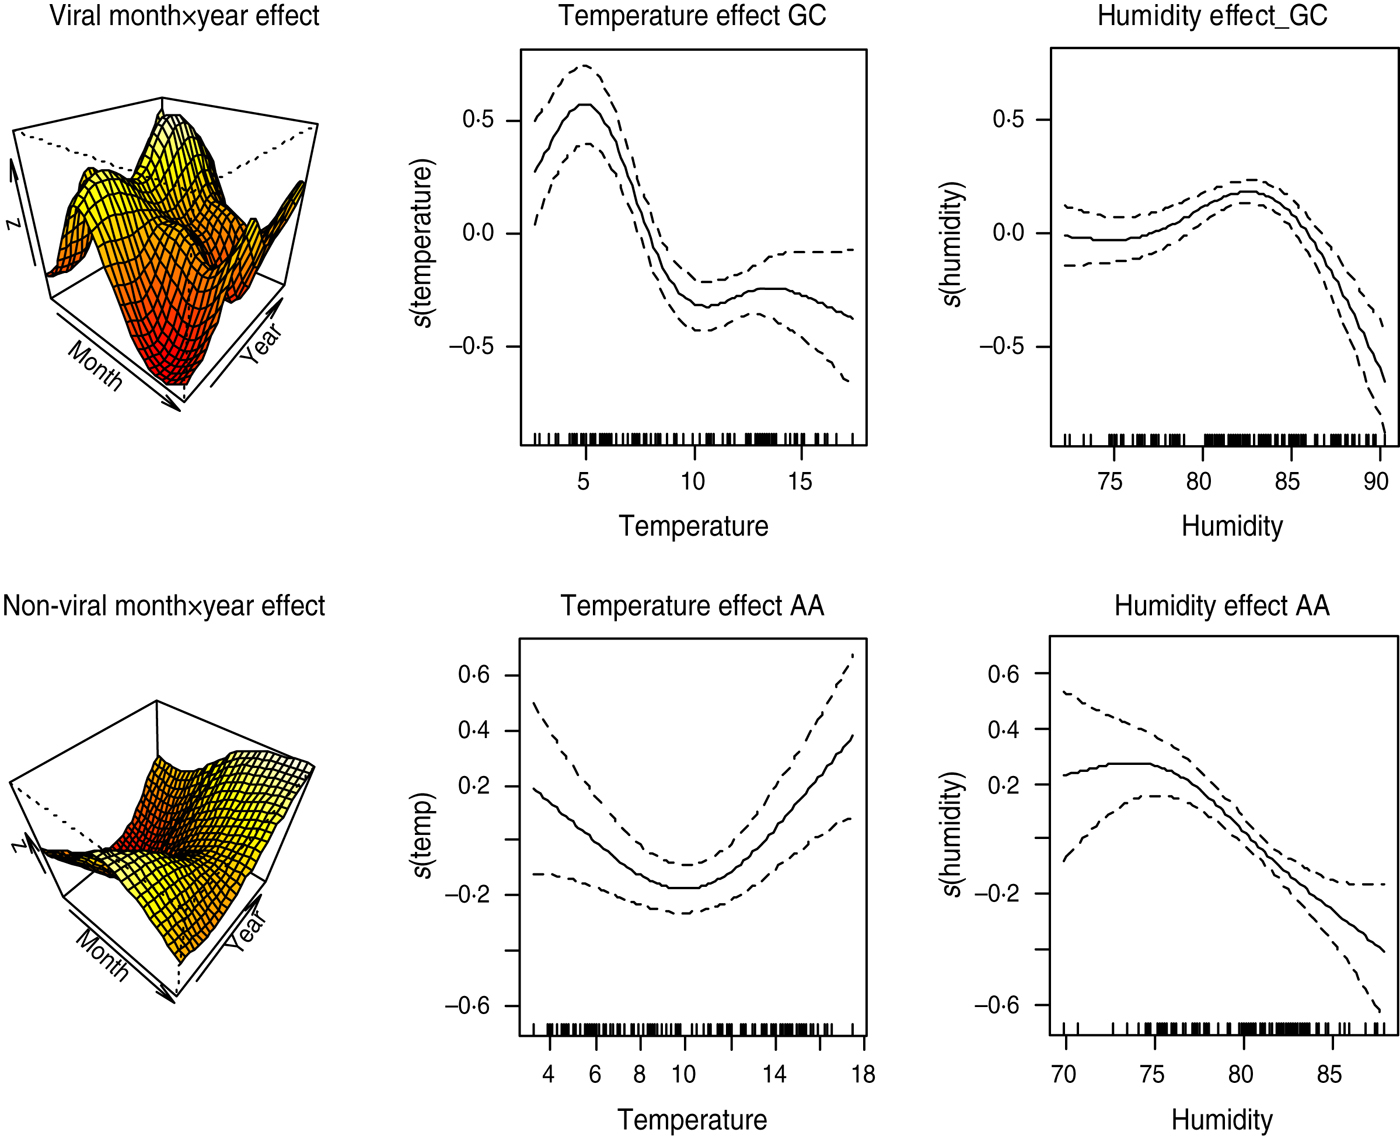
Fig. 5 [colour online]. Estimate of smooth effects from model 2. Month × year interaction effect and additive effects of humidity and temperature on viral and non-viral gastroenteritis in Glasgow & Clyde (GC) and Ayrshire & Arran (AA), respectively.
The plots of the additive smooth effects of temperature and humidity are shown in Figure 5. Temperature has a positive effect on the number of cases of non-viral infections. The second row of Figure 5 suggests that the effects of temperature and humidity on non-viral intestinal infections in AA increased sharply when temperature was > 10°C. The equivalent temperature level is as low as 5°C in GC. The converse is the case for viral intestinal infections. Thus, lower temperature and relative humidity levels are conducive for increased spread of viral intestinal infections.
The month×year interaction is also statistically significant. This indicates that seasonal peaks of the intestinal infectious pathogens are significantly different for different years. The differences in peaks over the years are captured by perspective plots in the first column of Figure 5.
Relationship with bathing water quality
The seasonal behaviours of FIOs are similar to the seasonal patterns exhibited by some of the gastrointestinal pathogens. Figure 6 shows the seasonal plots of FC (solid lines) with that of the non-viral intestinal pathogens (dotted lines) in the two NHS Board areas, respectively. Peak period of infections closely match the peak of FC and this coincides with the bathing season. The higher level of FIOs in the summer has been reported by Kay et al. [Reference Kay22] and could reflect impacts of seasonally specific land management and use.
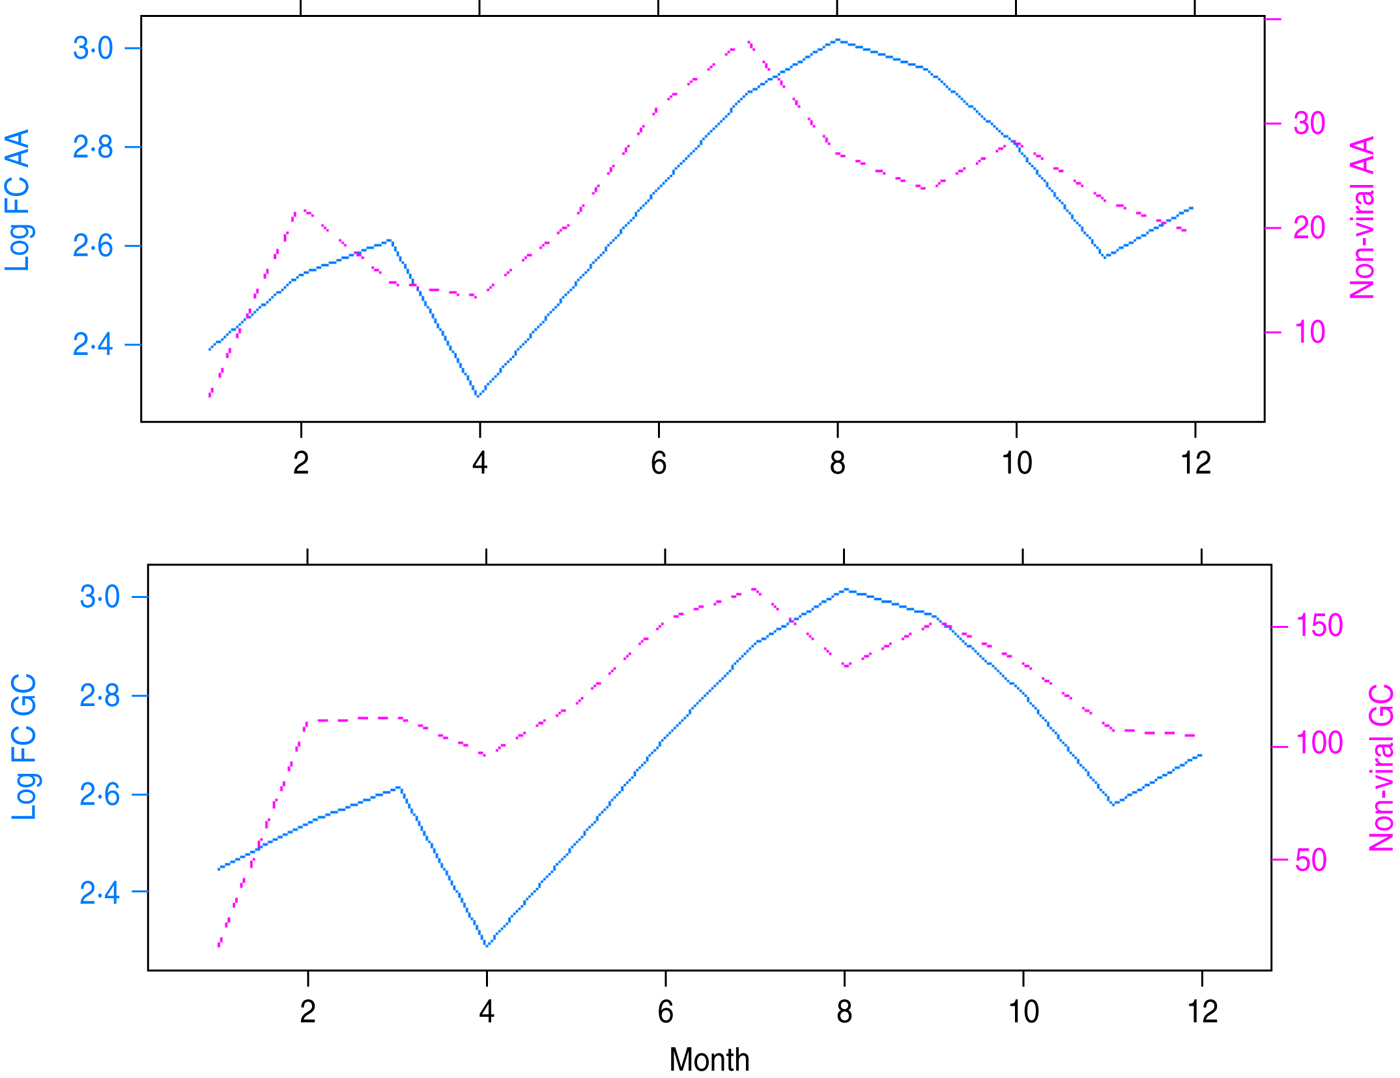
Fig. 6 [colour online]. Seasonal patterns of faecal coliform (FC) and non-viral gastroenteritis in Ayrshire & Arran (AA) and Glasgow & Clyde (GC), respectively. The dotted lines are the non-viral gastro-pathogens while the solid lines are FC.
Figure 7 shows results from model 3 fitted to viral infection in GC using FS as covariate and adjusting for season, trend, temperature and relative humidity effects. As shown in Table 1, the addition of FS into the model slightly improves the explained deviance and does not affect the significance of the weather variables.
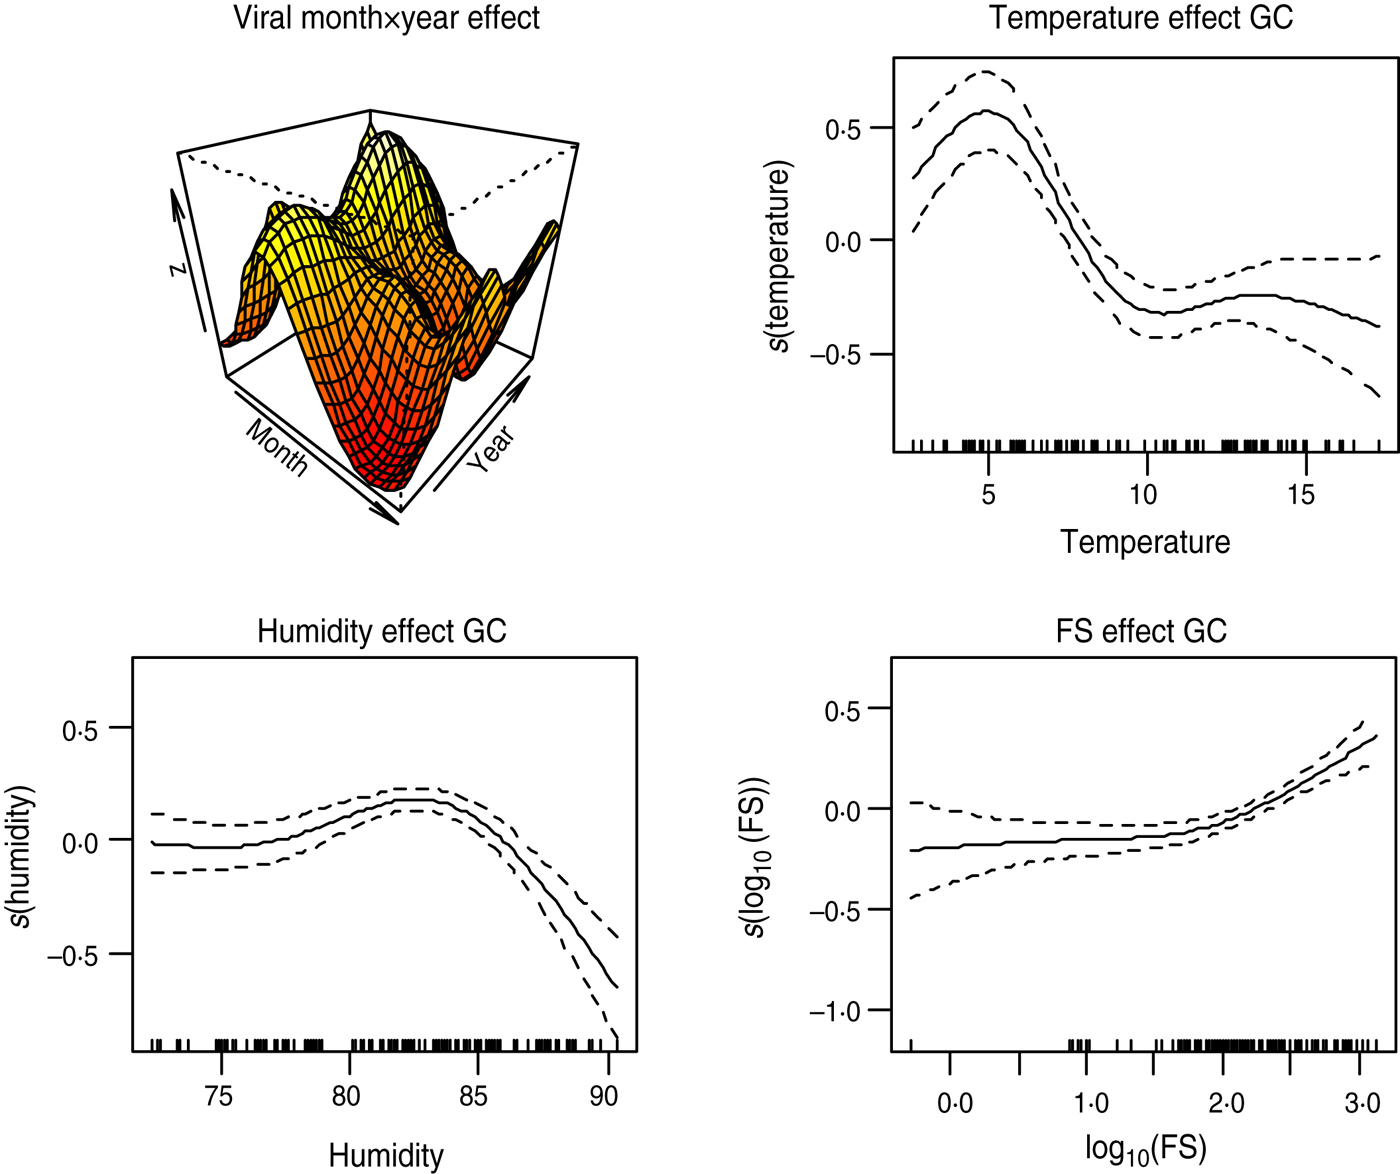
Fig. 7 [colour online]. Plot of smooth effects from model 3 showing month × year interaction, temperature, humidity and faecal streptococci (FS) effects on the viral intestinal infections in Glasgow & Clyde (GC).
Table 1. Comparing models fitted to viral intestinal infections in Glasgow & Clyde

AIC, Akaike's Information Criterion; UBRE, unbiased risk estimation; GLRT, generalized likelihood ratio test.
FS and FC have a statistically significant positive association with the number of viral infections in GC Health Board area after accounting for the effect of temperature and humidity. An increasing number of viral infections was associated with increasing levels of FC and FS in the area. However, the association between the two FIOs and viral intestinal infections in AA was negative.
Figure 7 suggests that the relationship between FS and viral infections can be approximated by a straight line. Therefore, fitting a semi-parametric model to viral gastroenteritis in GC with smooth functions for season, trend and temperature and a linear function for FS, shows that an increase in FS by 10 c.f.u./100 ml is associated with an increase in average monthly counts of viral gastroenteritis by 1·18 (95% confidence interval 1·12–1·26).
Positive association also exists between the two FIOs and non-viral intestinal infections. Figure 8 shows the plots of the smooth effect of the faecal indicators on non-viral intestinal infections in AA area, after accounting for the effects of weather.
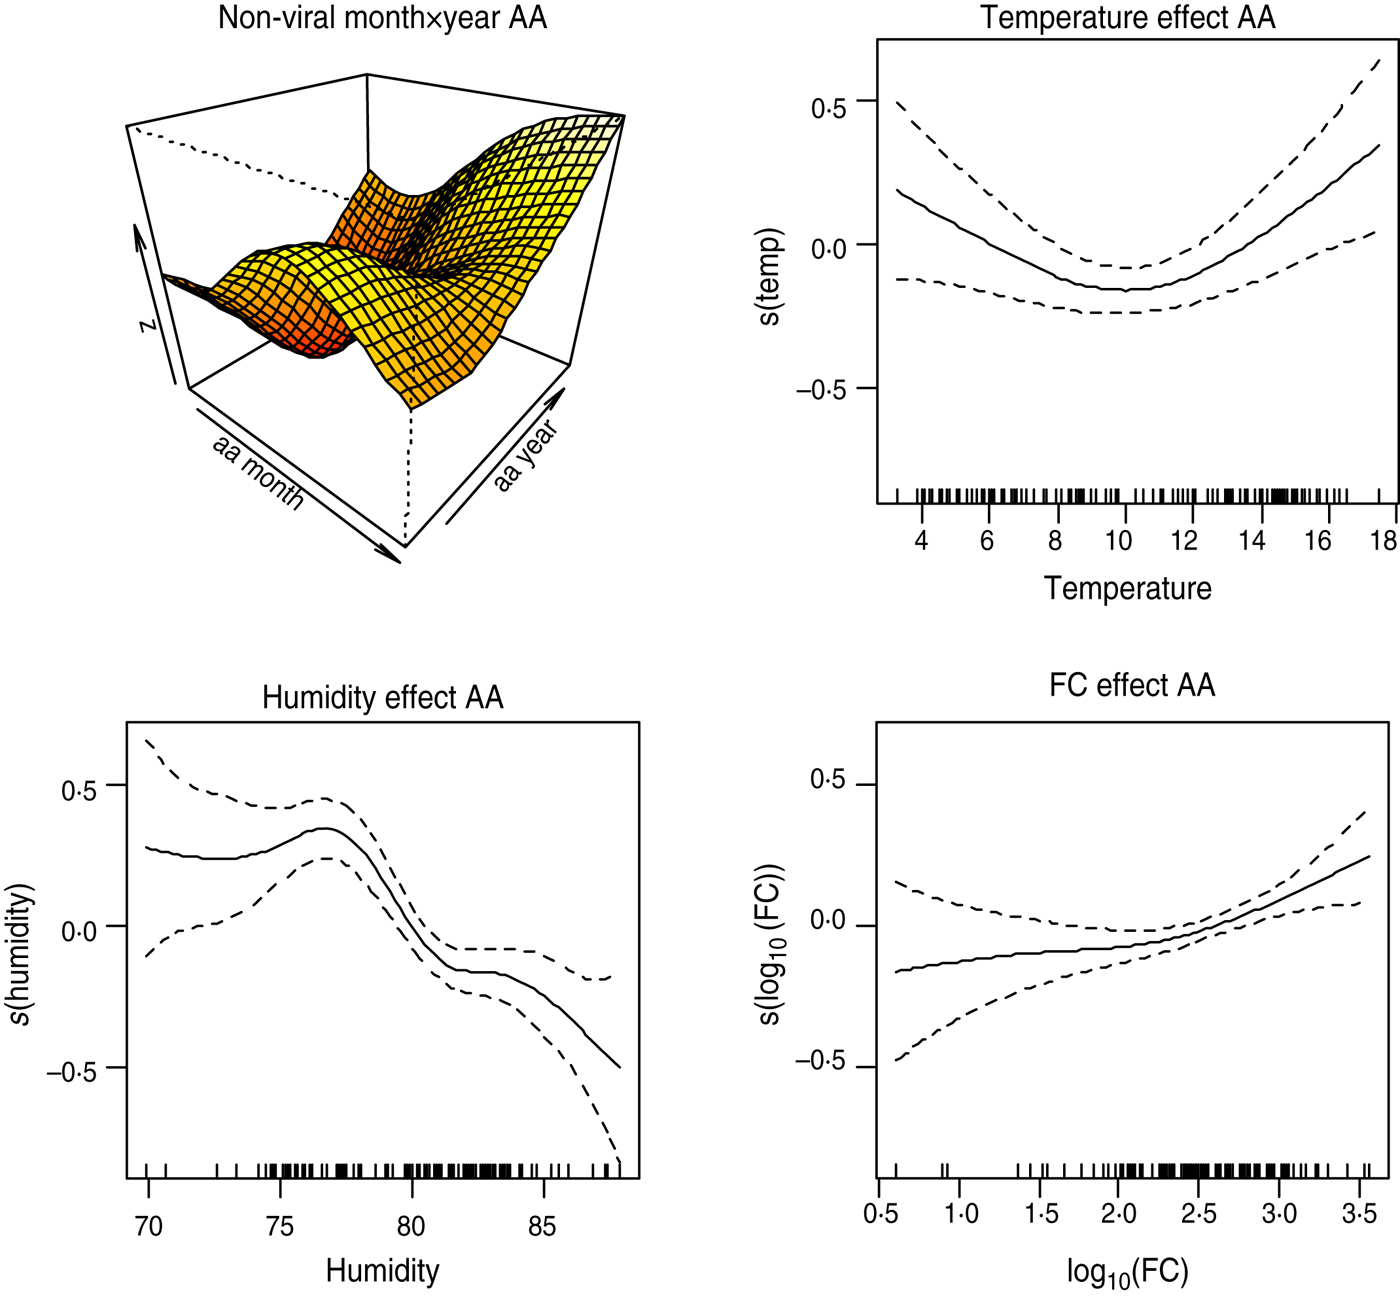
Fig. 8 [colour online]. Plot of smooth effects from model 3 showing month × year interaction, temperature, humidity and faecal coliform (FC) effects on the viral intestinal infections in Ayrshire & Arran (AA).
Model comparison
In order to justify the inclusion of additional terms in the model, or more generally, progressing from model 1 to model 2 or from model 2 to model 3, we compared model UBRE score or AIC. The better model is the model that minimizes these statistics. Using this approach, we found that model 2 is preferred to model 1, and model 3 to model 2. Table 1 shows parameters from the three models fitted to viral infection in GC. Marginal differences were observed between the parameters of models 2 and 3 but the GLRT indicated that the differences are statistically significant. Moreover, the explained deviance increased significantly as more variables were added into the model.
DISCUSSION
The two groups of IIDs exhibited strong seasonal patterns. Viral infections peaked in the spring with lowest levels of infection in the autumn in both NHS Board areas. Increasing trends of viral infections were observed over the period under study in the two areas. Non-viral infections peaked in July. However, in GC, a trimodal peak (March, July, September) was observed, suggesting possible differences in seasonal peaks for individual pathogens in this group [Reference Onozuka, Hashizume and Hagihara23, Reference Pollock24]. The trend of non-viral infection generally declined until 2004 but in AA it subsequently increased.
The effects of temperature and humidity on non-viral infections in GC increased sharply when temperature was >5°C or humidity was at least 76%. Thus, it may be inferred that higher temperature and high relative humidity are favourable conditions for the spread of non-viral infections. The converse is the case for viral gastrointestinal infections where negative additive effects were observed for both temperature and humidity in both health board areas. This suggests that lower temperature and relative humidity enhance viral infection. Our data are consistent with the findings of many authors. For instance non-viral gastro-pathogens such as Campylobacter and Salmonella infections were found to be positively associated with temperature [Reference Louis3, Reference Kovats4, Reference Kovats7, Reference Lake25] and are likely to be due to behavioural modifications such as changes in dietary intake, e.g. increased barbecuing of chicken resulting in under-cooked poultry meat consumption. Moreover, D'Souza et al. [Reference D'Souza, Hall and Becker9] found a negative association between rotavirus hospitalization and temperature and humidity. That is, they found that colder temperature and lower humidity were associated with increased admissions for rotavirus diarrhoea.
An increase in the number of viral and non-viral gastrointestinal infections was associated with increasing levels of FC and FS in the GC area. In AA, non-viral infections were found to be positively associated with the two faecal indicators. Our results corroborate those of Prieto and colleagues, which found that gastroenteritis symptoms exhibited a positive trend with the degree of water pollution by total coliforms [Reference Prieto26]. A randomized trial conducted in four UK resorts over four summers found that FS concentration showed a significant dose–response relationship with gastroenteritis, with adverse health effects noted when FS concentration exceeded 32/100 ml [Reference Kay27]. Enterococci were found to be the best predictors of gastrointestinal illness in bathers using marine waters [Reference Kay28]. The positive association between viral gastroenteritis and FC in GC confirms the conclusion of Wade et al. [Reference Wade29] that indicators of viral contamination are predictors of gastroenteritis illness even when accounting for climate. Wyn-Jones et al. [Reference Wyn-Jones30] confirmed the presence of gastrointestinal viruses such as adenovirus and norovirus in recreational water and suggested that they may constitute a public health risk upon exposure.
It is pertinent to point out that in this study we have not considered the possibility of infections due to foreign travel, person-to-person spread or foodborne ingestion. The exposure route to FIOs has been assumed in this study to be local bathing waters. The nature of routinely collected administrative data including health statistics as a spatial aggregated count does not allow this or an individual exposure model to be further explored. It is known from other studies [Reference Prieto26, Reference Calderon, Mood and Dufour31] that the lag period between exposure to bathing water and onset of IID is between 1 and 14 days. Hence, monthly aggregation of the outcome and exposure variables made it epidemiologically unrealistic to model lag effects of the bathing water quality variables. Furthermore, laboratory ascertainment of pathogens over time may also have improved and these cannot be excluded as a contributory factor to the increasing incidence of IID in AA NHS Board.
A number of factors impact upon the human burden attributable to these pathogens including anthropogenic and environmental influences. Environmental factors include climate change, which may lead to an increasing frequency of high-intensity rainfall events that increase mobilization of pathogens from faecal material into watercourses. This is especially true in the west of Scotland, which tends to experience high-intensity rainfall events compared to other parts of Scotland. Increased flooding events can result in overflows of sewage discharge. Hence, climate change and prolonged precipitation events are likely to result in increases in IID as evidenced by the data for AA and has implications for rural/farm-dense areas, which feed into bathing waters. Overall, recreational use of water may become more of a public health risk.
Peak levels of FIOs occur at periods when temperature is high. This positive association between temperature and FIOs means that rising temperature levels may result in a concomitant increase in FIO levels in bathing waters, which increases the risk of enteric infections through a commensurate increase in the number of people likely to partake in recreational water activities. There is no doubt that the economic, social and health costs of increased cases of gastroenteritis due to climate change may be large and risk mitigation strategies should be enacted.
ACKNOWLEDGEMENTS
Special thanks to NERC for funding this project (GE/9001170/1) and to the Scottish Environment Protection Agency (SEPA) and Health Protection Scotland for providing the data.
The views and opinions expressed in this publication are those of the authors and are not necessarily the views and opinions of the agencies involved.
DECLARATION OF INTEREST
None.


