


1 INTRODUCTION
Existing N-body simulations of stellar clusters usually begin with all stars on the zero-age main sequence (ZAMS). Our motivation to include pre-mainsequence (preMS) evolution in such models goes beyond the desire for completeness. Given the upper mass limit (M>10 M ⊙) attributed to conventional star formation (Stahler, Palla, & Ho 2000) and because massive stars are mainly found in the denser central regions of star clusters (e.g. Hillenbrand & Hartmann Reference Hillenbrand and Hartmann1998), Bonnell, Bate, & Zinnecker (Reference Bonnell, Bate and Zinnecker1998) first suggested collisions between preMS stars as a means to create massive stars. PreMS stars are larger than their main-sequence counterparts and, although the phase is short-lived, there is a possibility that the increased collision likelihood has an effect.
The journey from molecular gas cloud to protostar to the ZAMS is complicated. If random motions owing to MHD turbulence are sustained inside a molecular cloud, density inhomogeneities form and quickly collapse under their own gravity to become protostars (Stahler & Palla Reference Stahler and Palla2005). Typically, when modelling preMS evolution, this self-gravitating fragment of a protostellar cloud is where the models begin (Tout, Livio, & Bonnell Reference Tout, Livio and Bonnell1999) and is where we define the zero age of the pre-main sequence.
In the 1950s, Henyey constructed the first detailed numerical models of young stars, assuming that preMS stars are radiatively stable (Henyey, Lelevier, & Levée Reference Henyey, Lelevier and Levée1955). This led to nearly horizontal tracks in the Hertzsprung–Russell (H–R) diagram because the stars contract at almost constant luminosity. Hayashi (Reference Hayashi1961) realised that the H− opacity (and Kramer’s opacity, when the temperature increases) forces the young stars to radiate at nearly constant effective temperature T eff and so to follow nearly vertical tracks in an H–R diagram. These young stars are in a quasi-hydrostatic equilibrium. They contract on a time-scale much greater than the free-fall time-scale (Hayashi Reference Hayashi1961). Although protostars are initially homogeneous and isothermal, they collapse non-homogeneously, creating high central density and temperature. It is this that eventually gives rise to the suitable conditions for hydrogen fusion in stars with M>0.08 M ⊙. Below this mass, the central conditions are never sufficient for hydrogen fusion and the stars collapse to become brown dwarfs (Kumar Reference Kumar1963; Hayashi & Nakano Reference Hayashi and Nakano1963).
Stars with M ≤ 0.7 M ⊙ behave as though they are fully convective and reach the ZAMS at the end of their Hayashi track. When M ≥ 0.7 M ⊙, the star develops a radiative core which is large enough that it evolves more like Henyey’s initial models, turning on to the near-horizontal Henyey track where contraction continues at approximately constant luminosity. This behaviour can be seen in Figure 1, which shows the calculated preMS tracks modelled by Tout et al. (Reference Tout, Livio and Bonnell1999). However Stahler et al. (Reference Stahler, Palla, Ho, Mannings, Boss and Russell2000) argue that stars more massive than 10 M ⊙ have their contraction disrupted by both strong winds and radiation pressure and thus the conventional theory of protostellar infall fails in this case. Zinnecker & Yorke (Reference Zinnecker and Yorke2007) discussed three competing mechanisms for massive star formation. These are the turbulent core model of McKee & Tan (Reference McKee and Tan2003), the competitive accretion process of Bonnell et al. (Reference Bonnell, Bate, Clarke and Pringle1997) and stellar collisions and merging of stars during their preMS evolution or later. It is this third case that we investigate here.

Figure 1. An H–R diagram showing the ZAMS in bold and the preMS tracks for a range of masses. The distinction between the vertical Hayashi track and horizontal Henyey track is apparent here. Data is taken from Tout et al. (Reference Tout, Pols, Eggleton and Han1996) and Tout, Livio, & Bonnell (Reference Tout, Livio and Bonnell1999).
An alternative model was investigated by Baumgardt & Klessen (Reference Baumgardt and Klessen2011) and it is interesting to compare our results with theirs. They base their pre-mainsequence evolution on models of accreting stars constructed by Bernasconi & Maeder (Reference Bernasconi and Maeder1996). The physics used by Bernasconi & Maeder (Reference Bernasconi and Maeder1996) is not very different from that used by Tout et al. (Reference Tout, Livio and Bonnell1999) and indeed the evolutionary tracks in the H–R diagram are very similar once accretion has ceased and the stars contract down Hayashi tracks. The major difference between the models we present here and those of Baumgardt & Klessen (Reference Baumgardt and Klessen2011) is that all their stars begin as protostellar cores of 0.1M⊙ and accrete at a constant rate until they arrive at a suitable mass to populate an IMF up to 15M⊙. Their stars then undergo a preMS phase in which the logarithm of their radii shrinks linearly with time until they reach the ZAMS, whereupon they begin main-sequence evolution. Instead we start with a set of pre-mainsequence stars with masses populating a similar IMF up to 4M⊙ that begin their evolution already fully grown on Hayashi tracks. Our fitting formulae are a little more complicated because we attempt to to fit both the Hayashi and Henyey phases of pre-mainsequence evolution together. Because of this our stars remain larger for longer (see Section 4) after any accretion has ceased. We include this behaviour in cluster models with a variety of initial conditions to test its effect.
2 MODELS
We use the nbody6 Footnote 1 (Aarseth Reference Aarseth1999). This code incorporates stellar evolution and binary interaction by empirical formulae fitted to detailed stellar models. Two major additions to these standard packages are required. First we must have a reasonable empirical representation of how preMS stars, and particularly their radii, evolve. Secondly we must include a model of what happens when they collide.
2.1 Parameterization of the preMS evolution
We construct a set of fitting functions for the preMS evolution of stars with masses M in the range 0.1 < M/M ⊙ < 8.0. We choose to find analytical fits rather than to tabulate data, as did Wiersma, Sills, & Portegeis Zwart (2006), in our models because this approach is in line with the parameterized treatment of stellar evolution in the other parts of the N-body code. Such fits also have the advantage that they are continuous and differentiable and this makes modelling preMS evolution with accretion simpler because the fits are smooth functions of mass. We began with detailed stellar models originally constructed by Tout et al. (Reference Tout, Livio and Bonnell1999) with the Cambridge stars code (Eggleton Reference Eggleton1971) described by Pols et al. (Reference Pols, Tout, Eggleton and Han1995). We used data for nine stars with solar metallicity Z = 0.02 and masses M∈{0.1, 0.2, 0.5, 1.0, 2.0, 3.0, 5.0, 7.0, 8.0} M ⊙. These masses were chosen because stars with M < 0.08 M ⊙ never meet the ZAMS and for M>8 M ⊙ the time-scale of preMS evolution is short enough that it is safe to neglect it. The time taken for our 8 M ⊙ star to contract from about 90R⊙ to the main sequence is about 3×10⁵ yr. It takes only the first 1.25×10⁴ yr to contract to 40R⊙, a radius it does not exceed again until it becomes a red giant. It then spends about 5×10⁴ yr around 36R⊙ while it burns its supply of deuterium fuel and then loses its convective envelope, so moving from the Hayashi to the Henyey phase. In Section 3.2 we compare this with the expected collision time-scale in the densest clusters that we model. We find that neglect of preMS evolution for stars above 8M⊙ is reasonable for these clusters but would not be for much denser systems.
Given the general difficulty of deciding the birth time of a star and hence its age, we measure the age of preMS stars backwards from the ZAMS. We therefore devise a slightly artificial preMS time-scale τpreMS by taking the time from which the Tout et al. (Reference Tout, Livio and Bonnell1999) models begin until their radius meets the ZAMS value. To do this we use the analytic ZAMS radius formula of Tout et al. (Reference Tout, Pols, Eggleton and Han1996). It is a function of mass and metallicity but all our fits are made for solar metallicity Z = 0.02, for which differences from the detailed ZAMS models reported by Pols et al. (Reference Pols, Tout, Eggleton and Han1995) are at most 1.2%. It is imperative that these particular errors are small because all other formulae calculate properties relative to these ZAMS values. Using a least squares method, we fit these times as a function of mass to get the preMS time-scale in the form
 \begin{eqnarray}
&&\log _{10}\left(\frac{\tau _{\rm {preMS}}}{\rm {yr}}\right)=43.6-35.8\left(\frac{M}{M_{\odot }}\right)^{0.015}\nonumber\\
&&\quad\times \exp {\left[3.96 \times 10^{-3}\left(\frac{M}{M_{\odot }}\right)\right]}
\end{eqnarray}
\begin{eqnarray}
&&\log _{10}\left(\frac{\tau _{\rm {preMS}}}{\rm {yr}}\right)=43.6-35.8\left(\frac{M}{M_{\odot }}\right)^{0.015}\nonumber\\
&&\quad\times \exp {\left[3.96 \times 10^{-3}\left(\frac{M}{M_{\odot }}\right)\right]}
\end{eqnarray}
 \begin{equation}
\tau =1-t/\tau _{\rm {preMS}}
\end{equation}
\begin{equation}
\tau =1-t/\tau _{\rm {preMS}}
\end{equation}
 \begin{equation}
R=R_{\rm {ZAMS}}\left(M\right)10^{f(\tau )},
\end{equation}
\begin{equation}
R=R_{\rm {ZAMS}}\left(M\right)10^{f(\tau )},
\end{equation}
 \begin{equation}
f(\tau )=\frac{\alpha \tau ^3+\beta \tau ^4+\gamma \tau ^5}{1.05-\tau }.
\end{equation}
\begin{equation}
f(\tau )=\frac{\alpha \tau ^3+\beta \tau ^4+\gamma \tau ^5}{1.05-\tau }.
\end{equation}
 \begin{eqnarray}
\alpha^{(j)}\left(\frac{M}{M_{\odot }}\right)&=&\sum _{i=0}^3\alpha _i^{(j)}\left(\frac{M}{M_{\odot }}\right)^i, \nonumber \nonumber\\
\beta ^{(j)}\left(\frac{M}{M_{\odot }}\right)&=&\sum _{i=0}^3\beta _i^{(j)}\left(\frac{M}{M_{\odot }}\right)^i\nonumber\\
\text{and}\quad \gamma ^{(j)}\left(\frac{M}{M_{\odot }}\right)&=&\sum _{i=0}^3\gamma _i^{(j)}\left(\frac{M}{M_{\odot }}\right)^i,
\end{eqnarray}
\begin{eqnarray}
\alpha^{(j)}\left(\frac{M}{M_{\odot }}\right)&=&\sum _{i=0}^3\alpha _i^{(j)}\left(\frac{M}{M_{\odot }}\right)^i, \nonumber \nonumber\\
\beta ^{(j)}\left(\frac{M}{M_{\odot }}\right)&=&\sum _{i=0}^3\beta _i^{(j)}\left(\frac{M}{M_{\odot }}\right)^i\nonumber\\
\text{and}\quad \gamma ^{(j)}\left(\frac{M}{M_{\odot }}\right)&=&\sum _{i=0}^3\gamma _i^{(j)}\left(\frac{M}{M_{\odot }}\right)^i,
\end{eqnarray}
 \begin{equation}
j= \left\lbrace \begin{array}{@{}l@{\quad }l@{}}1 & M \le 1\,M_{\odot },\\
2 & 1\,M_{\odot } < M < 2\,M_{\odot }, \\
3 & M \ge 2\,M_{\odot } \end{array}\right.
\end{equation}
\begin{equation}
j= \left\lbrace \begin{array}{@{}l@{\quad }l@{}}1 & M \le 1\,M_{\odot },\\
2 & 1\,M_{\odot } < M < 2\,M_{\odot }, \\
3 & M \ge 2\,M_{\odot } \end{array}\right.
\end{equation}

Figure 2. Fitted preMS radii for 1.0 M ⊙, 5.0 M ⊙ and 8.0 M ⊙ (bottom to top) at τ = 0.8. The solid lines are the detailed models and the dashed lines the fits. Note the reversed scale in τ, with τ = 1 at the beginning of the preMS track and τ = 0 when the star reaches the ZAMS.
Table 1. Coefficients for Equation (3).
2.2 Treatment of collisions
In addition to the treatment of stellar evolution we must also consider collisions of preMS stars with themselves and stars of other types. We model a collision between two preMS stars as if both are n = 3/2 polytropes because stars on Hayashi tracks are fully convective and most collisions occur whilst stars are largest. The gravitational energy of an n = 3/2 polytrope of mass M and radius R is
 \begin{equation}
\Omega =-\frac{6}{7}\frac{GM^2}{R}.
\end{equation}
\begin{equation}
\Omega =-\frac{6}{7}\frac{GM^2}{R}.
\end{equation}
 \begin{equation}
U=-\frac{1}{3(\gamma -1)}\Omega .
\end{equation}
\begin{equation}
U=-\frac{1}{3(\gamma -1)}\Omega .
\end{equation}
 \begin{equation}
U=\frac{3}{7}\frac{GM^2}{R}.
\end{equation}
\begin{equation}
U=\frac{3}{7}\frac{GM^2}{R}.
\end{equation} $10^3\,\rm {km}\,\rm {s}^{-1}$
to have kinetic energy comparable to the energy lost with ξM, whereas in globular clusters and star-forming regions the velocities are typically
$10^3\,\rm {km}\,\rm {s}^{-1}$
to have kinetic energy comparable to the energy lost with ξM, whereas in globular clusters and star-forming regions the velocities are typically $10\,\rm {km}\,\rm {s}^{-1}$
(e.g. Portegies Zwart, McMillan, & Gieles Reference Portegies Zwart, McMillan and Gieles2010). Conserving the internal energy and ignoring this orbital contribution, we find that the radius R
* of the new coalesced star is
$10\,\rm {km}\,\rm {s}^{-1}$
(e.g. Portegies Zwart, McMillan, & Gieles Reference Portegies Zwart, McMillan and Gieles2010). Conserving the internal energy and ignoring this orbital contribution, we find that the radius R
* of the new coalesced star is
 \begin{equation}
R_{\ast }=\frac{7M^2}{3}\left(\frac{M_1^2}{R_1}+\frac{M_2^2}{R_2}\right)^{-1}(3-4\xi )(1-\xi )
\end{equation}
\begin{equation}
R_{\ast }=\frac{7M^2}{3}\left(\frac{M_1^2}{R_1}+\frac{M_2^2}{R_2}\right)^{-1}(3-4\xi )(1-\xi )
\end{equation}
 \begin{equation}
M_{\ast } = M_1 + M_2 - \xi M.
\end{equation}
\begin{equation}
M_{\ast } = M_1 + M_2 - \xi M.
\end{equation}
The outcome of a preMS/MS collision depends on the mass of the MS star. Below 0.7 M ⊙ the MS star is still mostly convective and, to a good approximation, the collision remnant can be modelled as above. At higher masses, the MS star has very little convective envelope and a dense convective core appears above 1.1 M ⊙. Mass is therefore most likely to be accreted on to the surface of the star but not mixed as above and evolution would not restart on the preMS. All other collisions with different stellar types are treated simply as accretion, so the non-preMS stellar type is kept upon collision and the mass of the star is simply increased. Such prescription is again supported by Laycock & Sills (Reference Laycock and Sills2005) who showed that the collision product, when the collision involves a preMS star, does not depend strongly on the impact parameter nor the initial velocity.
3 RESULTS
Our initial conditions are all Plummer (Reference Plummer1911) models in virial equilibrium with no primordial binary stars. There is no interstellar gas nor mass segregation. Our stellar evolution is as described in Section 2.1 and by Hurley, Pols, & Tout (Reference Hurley, Pols and Tout2000) and Hurley, Tout, & Pols (Reference Hurley, Tout and Pols2002). We use the code nbody6 (Aarseth Reference Aarseth1999). To explore a didactic set of N-body models, we keep the initial number of stars N, the initial mass function for the stars and the time-scale of evolution constant in our series of models. We vary only the half-mass radius R
0.5, the radius within which half the mass of the cluster is contained. We fix N to be 1 000. For the masses of the stars we use a modified Kroupa initial mass function (Kroupa Reference Kroupa2001), with M
min = 0.1M
⊙, M
max = 4.0M
⊙ and $\overline{M}=0.4\,M_{\odot }$
. We chose the length-scale
$\overline{M}=0.4\,M_{\odot }$
. We chose the length-scale $\overline{R}\in \lbrace 0.02,0.05,0.1,0.2,0.4\rbrace \rm {pc}$
. Our half-mass densities
$\overline{R}\in \lbrace 0.02,0.05,0.1,0.2,0.4\rbrace \rm {pc}$
. Our half-mass densities $\overline{\rho }_{0.5}$
range from 103 to 107
M
⊙pc − 3. The half-mass radius
$\overline{\rho }_{0.5}$
range from 103 to 107
M
⊙pc − 3. The half-mass radius $R_{0.5}\approx 0.8\overline{R}$
.
$R_{0.5}\approx 0.8\overline{R}$
.
Because our preMS fitting is restricted to the mass range 0.1 < M/M ⊙ < 8.0 (Equation (3)), if (a) different IMF parameters were chosen with M max ⩾ 8.0M ⊙ or (b) several stars collide to form a coalesced star with M * ≥ 8.0 M ⊙ then these high-mass stars evolve from the ZAMS. This approximation is justified because the preMS evolution of stars of these high masses is so rapid that neglecting it loses little information (see Section 3.2). We evolved each cluster for t = 10Myr, approximately τpreMS for a 0.5 M ⊙ star, with the logic that most interesting preMS behaviour would have occurred by this time. We made ten models for each of the length-scales, both with, all the stars started at the top of their Hayashi tracks at τ = 1, and without, all stars started on the ZAMS at τ = 0, preMS evolution. We shall hereinafter call these preMS and ZAMS runs respectively.
3.1 Densities
Our models have initial half-mass densities in the range $10^3 < \overline{\rho }_{0.5}/M_{\odot }\,{\rm pc}^{-3} < 10^7$
. The initial densities for the smallest clusters seem a little extreme but there is increasing evidence that the initial densities of open clusters are higher than previously thought (Parker et al. Reference Parker, Goodwin, Kroupa and Kouwenhoven2009), that bound clusters can expand quickly (Bastian et al. Reference Bastian, Gieles, Goodwin, Trancho, Smith, Konstantopoulos and Efremov2008; Moeckel & Bate Reference Moeckel and Bate2010) and that rapid expansion can occur in the core (Kroupa, Aarseth, & Hurley Reference Kroupa, Aarseth and Hurley2001). Indeed Table 2 shows that the densest clusters expand the most because of the longer dynamical time required and, interestingly, end up with very similar half-mass radii to clusters that were initially somewhat sparser. The final densities vary because the initially denser clusters lose more mass throughout the model. There is thus some uncertainty in extrapolating back in time to estimate an initial cluster scaling.
$10^3 < \overline{\rho }_{0.5}/M_{\odot }\,{\rm pc}^{-3} < 10^7$
. The initial densities for the smallest clusters seem a little extreme but there is increasing evidence that the initial densities of open clusters are higher than previously thought (Parker et al. Reference Parker, Goodwin, Kroupa and Kouwenhoven2009), that bound clusters can expand quickly (Bastian et al. Reference Bastian, Gieles, Goodwin, Trancho, Smith, Konstantopoulos and Efremov2008; Moeckel & Bate Reference Moeckel and Bate2010) and that rapid expansion can occur in the core (Kroupa, Aarseth, & Hurley Reference Kroupa, Aarseth and Hurley2001). Indeed Table 2 shows that the densest clusters expand the most because of the longer dynamical time required and, interestingly, end up with very similar half-mass radii to clusters that were initially somewhat sparser. The final densities vary because the initially denser clusters lose more mass throughout the model. There is thus some uncertainty in extrapolating back in time to estimate an initial cluster scaling.
Table 2. Evolution of the half-mass density $\overline{\rho }_{0.5}=M_{\rm {total}}/ \frac{4}{3}\pi R_{0.5}^3$
for
$\overline{\rho }_{0.5}=M_{\rm {total}}/ \frac{4}{3}\pi R_{0.5}^3$
for $\overline{R}\in \lbrace {0.05,0.10,0.20}\,\rm {pc}\rbrace$
.
$\overline{R}\in \lbrace {0.05,0.10,0.20}\,\rm {pc}\rbrace$
.
3.2 Collision frequency
First we looked at the number of collisions between stars for each $\overline{R}$
with and without preMS evolution. Averaged over ten simulations, the results are listed in Table 3, while Figure 3 shows the data and the averages over the 100 models. As expected, more stars collided in the initially denser clusters, as did more of the stars evolved from the top of their preMS tracks. The stars which collided in the ZAMS models had R≈2R
⊙ whereas in the preMS runs the radii were at least twice this when they collided.
$\overline{R}$
with and without preMS evolution. Averaged over ten simulations, the results are listed in Table 3, while Figure 3 shows the data and the averages over the 100 models. As expected, more stars collided in the initially denser clusters, as did more of the stars evolved from the top of their preMS tracks. The stars which collided in the ZAMS models had R≈2R
⊙ whereas in the preMS runs the radii were at least twice this when they collided.
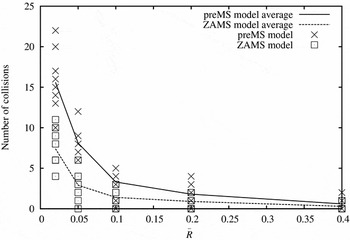
Figure 3. Number of collisions and their averages for 10 runs with and without preMS evolution for $\overline{R}=0.8\, R_{0.5}\in \lbrace 0.02,0.05,0.1,0.2,0.4\rbrace \,\text{pc}$
.
$\overline{R}=0.8\, R_{0.5}\in \lbrace 0.02,0.05,0.1,0.2,0.4\rbrace \,\text{pc}$
.
Table 3. Collision statistics for the models.
The gravitational focusing cross-section for stars with masses M 1 and M 2, and radii R 1 and R 2 is
 \begin{equation}
\sigma (M_1,M_2)=\pi (R_1+R_2)^2\left(1+\frac{2G(M_1+M_2)}{v_{\rm {rel}}^2(R_1+R_2)}\right), \end{equation}
\begin{equation}
\sigma (M_1,M_2)=\pi (R_1+R_2)^2\left(1+\frac{2G(M_1+M_2)}{v_{\rm {rel}}^2(R_1+R_2)}\right), \end{equation}
 \begin{equation*}
\sigma (M_1,M_2)\propto (R_1+R_2).
\end{equation*}
\begin{equation*}
\sigma (M_1,M_2)\propto (R_1+R_2).
\end{equation*}
 \begin{equation}
t_{\rm coll} \approx \frac{1}{n\sigma v_{\rm rel}} \approx 2.4\times 10^5\,\rm yr.
\end{equation}
\begin{equation}
t_{\rm coll} \approx \frac{1}{n\sigma v_{\rm rel}} \approx 2.4\times 10^5\,\rm yr.
\end{equation}
3.3 Runaways
In nearly every case, these collisions involved one or two stars colliding many times. We call a star that collides with another more than once a runaway. These were usually the most massive stars in the initial configuration, with initial masses 3 ⩽ M initial/M ⊙ ⩽ 4. Some gained over ten times their initial mass within 10Myr through multiple collisions. Table 4 is a list of the ten most massive runaways in both preMS and ZAMS models. This shows that not only do more collisions occur in the preMS models but also that the runaways end up somewhat more massive. The mean mass gained by runaways in the preMS models was 12.0 M ⊙ (averaged over 34 runaways) and 8.8 M ⊙ (24 runaways) in the ZAMS models.
Table 4. The ten most massive runaways.
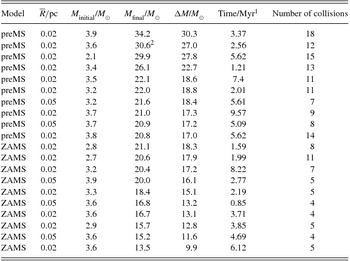
1 Time is the age of the cluster when the runaway star collided for the last time.
2 This star later evolved to a 6.8 M ⊙ black hole by 8.5 Myr and absorbed another preMS star.
Portegies Zwart & McMillan (Reference Portegies Zwart and McMillan2002) found a similar phenomenon in their rather extreme models of colliding MS stars in dense star clusters where MS/MS collisions typically form one runaway star. In Monte Carlo stellar dynamical models Freitag, Gürkan, & Rasio (Reference Freitag, Gürkan and Rasio2006), while investigating a runaway mechanism to create an intermediate-mass black hole in compact stellar clusters, also found that only one runaway object was formed. Our results are in line with these findings. Thus multiple collisions between preMS stars early on in cluster evolution can be a viable mechanism to create a few massive stars in otherwise low-mass clusters but is unlikely to be the means to populate the top of the IMF (Zinnecker & Yorke Reference Zinnecker and Yorke2007). This conclusion was reached by Baumgardt & Klessen (Reference Baumgardt and Klessen2011) who also found typically only one runaway massive star in their simulated clusters.
We found that the characteristic time to the first runaway is about the same as that to form a small core, 0.05pc in radius. The collisions, or merges, then occur within this core. They also usually take place at the pericentre of highly eccentric binary orbits. In a few cases a fly-by was seen to induce collisions between two stars in an eccentric binary system.
Usually the most massive runaway stars formed in the very dense $\overline{R}=0.02\,\rm {pc}$
model. For
$\overline{R}=0.02\,\rm {pc}$
model. For $\overline{R}=0.4$
no runaway stars formed at all and only three formed in the preMS model when
$\overline{R}=0.4$
no runaway stars formed at all and only three formed in the preMS model when $\overline{R}=0.2$
. However there is significant variation between the models. In the two least dense models the effect of the preMS evolution is insignificant because the clusters are sparse enough that by the time two stars come sufficiently close to collide the preMS phase is over.
$\overline{R}=0.2$
. However there is significant variation between the models. In the two least dense models the effect of the preMS evolution is insignificant because the clusters are sparse enough that by the time two stars come sufficiently close to collide the preMS phase is over.
4 CONCLUSIONS
We have not attempted to create a completely realistic model of a cluster. The background gas that would exist in a protostellar cloud has been neglected, as have the effects of accretion of this gas (see the treatment by Baumgardt & Klessen Reference Baumgardt and Klessen2011). Nor have we modelled the effects of stellar accretion discs which would enhance the likelihood of collisions and also change their nature. Our aim here has been to show that preMS evolution can have important consequences and to identify when the preMS phase should be considered in more detail in the future.
It is not straightforward to make a direct comparison with Baumgardt & Klessen (Reference Baumgardt and Klessen2011) because they let their stars form by accretion on to 0.1 M ⊙ cores, at constant accretion rates to populate the IMF, whereas we start with an IMF and evolve our protostars as if they were coeval. However, examining the time-integrated cross-section of our analytic fits compared to theirs (see Figure 4) shows that their models systematically underestimate the radii of the preMS stars below 6 M ⊙ compared to ours. This is important when looking at collision frequencies. Calculating the time and mass-integrated cross-section
 \begin{equation}
I_{\rm {IMF}}=\int _{0.1\,M_\odot }^{4.0\,M_\odot } \int _{\tau _{\rm preMS}} \eta (M) R(M,\tau )\,\mathrm{d}\tau \,\mathrm{d}M,
\end{equation}
\begin{equation}
I_{\rm {IMF}}=\int _{0.1\,M_\odot }^{4.0\,M_\odot } \int _{\tau _{\rm preMS}} \eta (M) R(M,\tau )\,\mathrm{d}\tau \,\mathrm{d}M,
\end{equation}
 \begin{equation}
\int _{0.1\,M_\odot }^{4.0\,M_\odot }\eta (M)\,\mathrm{d}M = 1,
\end{equation}
\begin{equation}
\int _{0.1\,M_\odot }^{4.0\,M_\odot }\eta (M)\,\mathrm{d}M = 1,
\end{equation}

Figure 4. The integrated cross-section I = ∫τpreMS Rdτ, taken over the preMS lifetime given by Equation (1). The models here are those of Tout et al. (Reference Tout, Livio and Bonnell1999). The fits of Baumgardt & Klessen (Reference Baumgardt and Klessen2011) are integrated from the time their accretion phase stops to when their models reached the ZAMS. Our cross-sections are relatively larger for the longer lived lower-mass stars but smaller between about 5.5 and 7.5M⊙.
The inclusion of gas is a natural next step in these models. We would expect an interplay between gas expulsion, which decreases the star formation efficiency, accretion rates and the effect of gas accretion on to stars. Gas accretion not only leads to larger stars and hence larger collision cross-sections but, in clusters, forces contraction of the whole system and thence leads to more merging stars (Bonnell et al. Reference Bonnell, Bate and Zinnecker1998; Bonnell & Bate Reference Bonnell and Bate2002), an increase in the number of binary stars and early mass segregation (Moeckel & Clarke Reference Moeckel and Clarke2011).
We would also expect our preMS stars to form discs while accreting or indeed as a result of tidal disruption during a collision (Davies et al. Reference Davies, Bate, Bonnell, Bailey and Tout2006). The effect of such protoplanetary discs on the number of collisions, their outcome and the time-scale on which they take place should also be modelled in some way and included in a more detailed N-body model. Star–disc interactions can lead to the disc being stripped away (Hall, Clarke, & Pringle Reference Hall, Clarke and Pringle1996; Scally & Clarke Reference Scally and Clarke2001) or the formation of binary stars (Clarke & Pringle Reference Clarke and Pringle1993) and, because many massive stars live in tight binary systems (Zinnecker & Bate Reference Zinnecker, Bate and Crowther2002), it will be important to know whether the preMS phase contributes to this.
In conclusion, although there is much physics that we have not included, our models show that preMS evolution increases both the number of collisions, when the density is sufficiently large, and the amount of mass gained by the final collision remnants. Most collisions are part of a runaway process so preMS collisions alone are probably insufficient to populate the upper IMF. We identify an initial half-mass cluster density of 104 M ⊙pc − 3 below which preMS evolution can be neglected because collisions are sufficiently rare. However caution should be exercised owing to large uncertainty in the early length scales of clusters.
ACKNOWLEDGEMENTS
CAT is very grateful to Churchill College for his Fellowship. We thank the referee for his helpful suggestions for improvement.


