


Excessive consumption of dietary fat contributes to weight gain and obesity(Reference Bray, Paeratakul and Popkin1), suggesting that fat intake is poorly regulated in the obese state. In animal models, oral fatty acid sensitivity, measured by taste cell electrophysiological activity, in response to stimulation with fatty acids is a determinant of fat consumption and body weight regulation. For example, animals that are hypersensitive to orally administered fatty acids consume less dietary fat and resist weight gain, while hyposensitive animals consume excess fats and develop obesity when exposed to a high-fat diet(Reference Gilbertson, Liu and York2). Whether or not this relationship is also apparent in human subjects remains unclear; however, given the association between dietary fat intake and obesity, which has been suggested in some studies(Reference Bray, Paeratakul and Popkin1), it is plausible.
In human subjects, oral recognition of dietary fats has remained contentious due to incongruous data surrounding this area of research. While numerous psychophysical investigations have reported ‘taste-like’ effects from orally delivered fatty acids(Reference Chale-Rush, Burgess and Mattes3–Reference Mattes5), this only appears true at a detection threshold level as fatty acids do not elicit suprathreshold taste percepts such as sweet, sour, salty, bitter and umami. The term fat-taste appears anatomically correct as the putative receptor mechanisms are co-located on taste receptor cells(Reference Fukuwatari, Hiraoka and Iwanaga6–Reference Matsumura, Mizushige and Yoneda8). Despite increasing use of the term ‘fat-taste’ or ‘fatty-acid taste’, it can be misleading, and we suggest that the most fitting definition is ‘an oral fat sensor’, which appears to accurately describe the function of the oral fatty acid system without suggesting that a taste quality is present.
Considering that the physiological function of many nutrient sensors within the mouth is to detect the nutritious or toxic value of foods, it makes sense that components of dietary fats (fatty acids) would be detected in the mouth, similar to the nutritive components of proteins (monosodium glutamate (MSG) or inosine 5′-monophosphate) and carbohydrates (sucrose, fructose, etc.)(Reference Chandrashekar, Hoon and Ryba9). Differences in the functionality of oral nutrient receptors are known to influence individual sensitivity, acceptance, preference, liking and intake of specific foods and food components(Reference Dinehart, Hayes and Bartoshuk10). For example, differences in oral sensitivity to both MSG and inosine 5′-monophosphate are associated with consumption and liking of dietary proteins(Reference Luscombe-Marsh, Smeets and Westerterp-Plantenga11). The functionality of oral sensors is determined in part by genetic contributions and environmental factors including exposure and consumption of specific nutrients(Reference Kobayashi, Kennedy and Halpern12, Reference Wise, Hansen and Reed13). This phenomenon, known as habituation(Reference Zhao and Herness14), has been reported for numerous orally detected compounds including Na+, whereby a direct relationship between habitual Na intake and sensitivity to Na+ has been established, that is, individuals who are Na+ deplete are more sensitive to orally administered Na+(Reference Beauchamp, Bertino and Burke15), and whether a similar phenomenon occurs for fatty acids remains unclear. In the context of obesity, determinants of fat intake, including oral fat sensitivity, are of particular interest.
The significance of oral fat sensitivity and its putative influence on fat intake, fat perception and BMI in human subjects were the focus of the present study. We evaluated the hypotheses that (1) detection thresholds for fatty acids vary among the population and are not related to sensitivity to additional prototypical tastants, (2) individuals can be identified as hypo- or hypersensitive to fatty acids within the oral cavity and (3) oral fatty acid sensitivity is directly related to the perception of fat in foods and is associated with fat consumption and BMI.
Experimental methods
The study consisted of two parts. Study 1 was designed to determine detection thresholds for oleic (C18 : 1), linoleic (C18 : 2) and lauric (C12 : 0) fatty acids, and recognition and detection thresholds for prototypical tastants using sucrose, caffeine, NaCl, citric acid and MSG, and to quantify the presence of lipase in human saliva. The aim of study 2 was the development of a screening procedure for the identification of subjects who were hypo- and hypersensitive to C18 : 1, and to evaluate the relationship between oral fatty acid sensitivity, food consumption, fat perception and BMI.
Subjects
Power analysis was conducted before study 2 to determine an appropriate sample size to achieve adequate power. Using data generated in study 1 and an σ 0·05 and a 10 % β (90 % power), it was calculated that a sample size of fifty-one would be required to classify at least 20 % of the subjects as hypersensitive. For both the studies, the subjects were recruited from Deakin University, Burwood, VIC, Australia. All the subjects were in good health and were non-smokers. The present study was conducted according to the guidelines laid down in the Declaration of Helsinki, and all procedures involving human subjects/patients were approved by the Deakin University Human Research Ethics Committee. Written, informed consent was obtained from all the subjects before participation.
Study 1: determination of fatty acid detection thresholds
Study outline
Subjects were studied on three separate occasions to determine detection thresholds for C18 : 1, C18 : 2 and C12 : 0. C18 : 1 and C18 : 2 are common in the food supply and are found in numerous animal and vegetable food sources. C12 : 0 is less common in the food supply, but it has been demonstrated to stimulate potent effects on gastrointestinal hormone and motor function and the suppression of energy intake(Reference Little, Feltrin and Horowitz16). Taste thresholds for prototypical tastants were determined using sucrose, citric acid, NaCl, caffeine and MSG according to International Organization of Standardization guidelines, and relationships between recognition and detection thresholds for these and those of the fatty acids tested were evaluated(17). Saliva samples were collected from all the subjects for determination of oral lipase activity.
Oral fatty acid detection thresholds
Food grade C18 : 1 and C12 : 0 were obtained from Sigma Aldrich (St Louis, MO, USA) and C18 : 2 was obtained from Larodan Fine Chemicals (Malmö, Sweden), and they were stored under N2 below 4°C. Fatty acids were added at varying concentrations (0·02, 0·06, 1, 1·4, 2, 2·8, 3·8, 5 and 6·4 mm) to long-life non-fat milk (Coles, Springvale, VIC, Australia). All preparations were mixed with 5 % (w/v) gum acacia (Melbourne Food and Ingredient Depot, Carlton, VIC, Australia) and liquid paraffin (Merck, Darmstadt, Germany), to produce perceptually identical textural attributes including viscosity and lubricity between fatty acid and control samples(Reference Chale-Rush, Burgess and Mattes3). To prevent oxidation of C18 : 1 and C18 : 2, all samples were mixed with 0·01 % w/v EDTA (Merck). Samples were homogenised for 12 min at 7000 rpm using a Silverson L4RT homogenizer (Longmeadow, MA, USA). All the samples were prepared fresh on the day of testing. C18 : 1 and C18 : 2 were served at room temperature, and C12 : 0 was heated to 50°C to ensure a liquid state. Control samples were prepared in the same way, but without added fatty acids. Detection thresholds for the fatty acids were determined using ascending series 3-Alternate Forced Choice methodology(Reference Meilgaard, Civille and Carr18), in which the subjects are provided with three samples, two controls and one containing fatty acids, per set, in ascending order from the lowest (0·02 mm) to the highest (6·4 mm) concentration. Subjects were asked to rinse their mouths with water before beginning the task and between each sample set. Detection thresholds were defined as the concentration of fatty acid required for a subject to correctly identify the fatty acid sample as ‘odd’ from the two control samples, in three consecutive sample sets, in line with commonly established sensory testing procedures(Reference Meilgaard, Civille and Carr18). To prevent confounding from non-taste sensory inputs, all tests were conducted under red light and with the subjects wearing nose clips, and the low fatty acid concentrations used were not expected to cause oral irritation(Reference Chale-Rush, Burgess and Mattes3). Subjects were asked to refrain from eating 1 h before testing.
Sensitivity to prototypical tastants
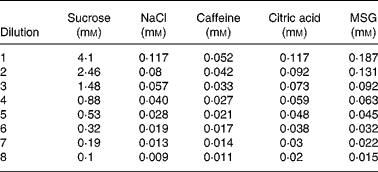
Sample solutions for sweet, salty, sour, bitter and umami tastants were prepared using sucrose (CSR White Sugar, Mackay, QLD, Australia), salt (SAXA table salt, Cerebos Foods, Seven Hills, NSW, Australia), citric acid anhydrous (Swiftco Ltd, Mulgrave, VIC, Australia), caffeine (SAFC Supply Solutions, St Louis, MO, USA) and MSG (Foodstuffs Company Limited, Lay Brothers, Dandenong, VIC, Australia), respectively, at the concentrations detailed in Table 1. Subjects were presented with a series of eight solutions for each prototypical tastant, which were arranged in ascending order of concentration, and they were asked to sample each solution, expel it after 10 s and then describe the taste based on the following: (1) ‘the solution tastes like water’; (2) ‘the solution tastes like something other than water, but I am uncertain of the taste’ or (3) ‘the solution has a specific taste (sweet, salty, sour, bitter or umami)’. Detection thresholds were defined as the concentration of a compound required for it to elicit a taste sensation which was unknown to the assessor, and the recognition threshold was defined as the concentration of a certain compound required for the subject to accurately recognise and identify the specific tastant. Thresholds for the basic taste solutions were all determined on the same day, and the subjects were asked to rinse their mouths with water three times between each set of taste samples.
Table 1 Concentration of tastants used for the determination of taste thresholds for the prototypical stimuli*†
MSG, monosodium glutamate.
* Prototypical stimuli are sucrose, sweet; NaCl, salty; caffeine, bitter; citric acid, sour; MSG, umami.
† Subjects were presented with each series of dilutions in ascending order, from lowest (dilution 8) to highest (dilution 1) concentration.
Lipase activity
Whole saliva was collected from the subjects following stimulation with cream (Pauls Thickened Cream, Brisbane, QLD, Australia) in specialised saliva collection tubes (Salivette, Sarstedt, Mawson Lakes, SA, Australia). For collection, the subjects were advised to swish the cream in their mouths for 30 s, expectorate and then rinse their mouths once with water. Subjects then refrained from swallowing for 1 min, allowing saliva to pool in the mouth. After 1 min, the subjects were instructed to insert a 5 cm cylindrical cotton swab in their mouth and leave it for 1 min. Saliva samples were centrifuged for 15 min at 3000 rpm and stored at − 80°C. Lipase activity was measured using the Olympus Kinetic Quantitative Colour Test (Olympus Life and Material Science Europa, Hamburg, Germany). Briefly, lipase activity (μmol fatty acids/min per l) is quantified by the breakdown of 1,2-diglyceride and release of monoglyceride and NEFA under physiological conditions (35°C, pH 8). The reaction sequence produces quinone diimine dye, which absorbs light at 550 nm, proportional to lipase activity(Reference Imamurra, Arai and Takao19).
Fatty acid oxidation
Oxidised fatty acids are believed to impart taste and flavours described as bitter, sour, astringent or soapy, which may influence discrimination of oral sensitivity(Reference Forss20). To ensure that oxidation products were not present in the fatty acids used in the present study, solid phase microextraction headspace GC analysis was performed according to the guidelines of the American Oil Chemists' Society(21). Samples (5 ml) of fatty acids+milk were prepared identical to those used for determination of fatty acid taste thresholds. Aliquots were preheated to 50°C, a carboxen/polydimethylsiloxane/divinylbenzene fibre (Supelco, Castle Hill, NSW, Australia) was inserted into the sample headspace, and heating was continued for a further 15 min. After this time, the solid phase microextraction fibre was removed and inserted into a gas chromatograph (Agilent Technologies Australia, Burwood, VIC, Australia) for 7 min. GC was performed on a volatile organic compound fused silica capillary column, 60 cm, 0·32 mm internal diameter and 1 μm thickness (Supelco). Helium was used as the carrier gas at a flow rate of 1·0 ml/min.
Study 2: determination of oral fatty acid sensitivity
Study outline
Subjects completed a 2 d diet diary and recorded self-reported height and weight within 1 month of sensory testing. Subjects attended the sensory laboratory on one occasion to complete a screening test designed to identify those who were hypo- and hypersensitive to oral stimulation with C18 : 1. Finally, the subjects completed a fat ranking task. This task was designed to test the subjects' ability to detect different concentrations of fat in a typical food matrix, custard, and to determine whether fatty-acid taste sensitivity was related to the subjects' ability to identify variations in the fat content of a food. Differences in energy intake, fat perception and BMI were determined between hyposensitive and hypersensitive subjects.
Oral fatty acid sensitivity
C18 : 1 was chosen for the screening procedure for practical reasons, as it is liquid at room temperature and less vulnerable to oxidation than C18 : 2. A concentration of 1·4 mm was used, based on the results from study 1, since 48 % of the subjects could detect C18 : 1 at or below this concentration. Subjects were screened for oral fatty acid sensitivity via triplicate triangle tests in which the subject is presented with three samples per set, consisting of two control samples and one fatty acid sample. Hypersensitive individuals were defined as those who could identify the fatty acid sample over control samples three times out of the three tests, and hyposensitive subjects were defined as those who detected fatty acid samples over control samples less than three times out of the three tests, (i.e. those who identified 2, 1 or 0 fatty acid samples out of the three tests). This classification is based on well-established sensory testing methodologies(Reference Meilgaard, Civille and Carr18). The chance of correctly guessing the sample with added fatty acid three consecutive times in triangle tests is 3·7 %.
Fat ranking task
This task was designed to evaluate the subjects' ability to detect differing levels (0, 2, 6 and 10 %) of oil in custard, and to determine the relationship between oral sensitivity to oleic acid and their ability to detect variations in the fat content of a typical food matrix. Discriminating between samples based on texture was not the object of this task. Custard was made from 100 g starch (Ultra-tex 4 modified waxy starch, National Starch Food Innovation, Seven Hills, NSW, Australia), 1 ml vanilla flavour (Specialty Flavour and Fragrances, Seaford, VIC, Australia), 50 ml Tween 80 (Merck), 0·5 ml yellow food colouring (Queen Food Colours, Alderley, QLD, Australia), 200 g powdered sugar (CSR White Sugar, Yarraville, VIC, Australia) and 1000 ml water. The custard was divided into four batches (250 g/batch), and 5, 15 or 25 ml of Canola oil (Crisco, Coles) were added to the three batches to achieve fat contents of 2, 6 and 10 % oil, respectively. One custard batch remained fat free (0 %). Subjects were offered the custard samples in a randomised order, and were asked to rank them according to their fat content. The custards were served at room temperature and prepared fresh on the day of testing. All the subjects received a score out of five for this task (Table 2).
Table 2 Combinations and scores for the custard ranking task*
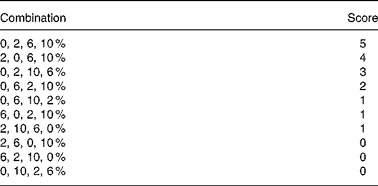
* During the fat ranking task, all the subjects were required to rank, in the order of their fat content (least fatty to most fatty), four custard samples containing 0, 2, 6 and 10 % rapeseed oil. Subjects received a score out of 5 for this task. Scores were based on the order in which the custards were ranked. All the subjects who placed the highest (10 %) and lowest (0 %) next to each other scored ‘0’ for the task.
Food consumption and anthropometry
Subjects completed a 2 d diet diary (1 weekday and 1 weekend day within a 7-d period and within 1 month of the sensory tests), in which they recorded all foods and drinks consumed while maintaining their normal eating patterns. Subjects were asked to, where possible, weigh the foods they consumed, or use measuring cups, spoons or common serving sizes (e.g. one slice of bread), and to be specific, such as reporting the brand of food consumed, type of food (e.g. white or wholemeal bread), whether fat was added (e.g. oil or butter) and the cooking methods (e.g. baking, frying and steaming). If the food consumed was from a recipe, the subjects were asked to include the recipe with the record and to state how much of it they consumed (e.g. whole or half). Diet diaries were analysed using Food Works 2007 (Xyris Software, Highgate Hill, QLD, Australia). Mean energy intake (kJ) and macronutrient distribution (% energy from carbohydrate, protein and fat), and the type of fat (saturated, monounsaturated and polyunsaturated) and alcohol (g) were quantified. To minimise confounding from potential under-reporting, all diet records were compared with recommended energy requirements for Australians based on age, sex, height and weight(22). Subjects reported their body weight (kg) and height (cm) on the day of testing and in their food diaries, and the BMI (weight (kg)/height (m2) was calculated. The prevalence of overweight and obesity was determined using cut-off values for BMI: overweight>24·9 kg/m2; and obesity>29·9 kg/m2(Reference Harris, Bradlyn and Coffman23).
Statistical analysis
Data were analysed with SPSS, version 14.00 (SPSS, Inc., Chicago, IL, USA). Fat sensitivity was used as a grouping variable to explore differences between categorical (fat perception) and continuous (weight, BMI, energy intake and fat consumption) variables. One-way ANOVA was used to detect differences in habitual energy and macronutrient intakes, and independent sample t tests were used to detect differences in BMI. χ2 test was used to detect differences in the fat ranking scores between hyposensitive and hypersensitive subjects. Pearson correlation analysis was performed between individual fatty acid thresholds, as well as between fatty acid thresholds and basic taste thresholds, and it was also used to determine any relationships between taste sensitivity and food selection, that is, fat consumption, and performance in the fat ranking task. Significance was accepted at P < 0·05. All the data are presented as means with their standard errors, unless stated otherwise.
Results
Subjects (n 2) who failed to complete the sensory testing component were excluded from study 1, and the subjects (n 2) who failed to complete dietary records for two complete days were excluded from study 2. Baseline characteristics of the subjects who completed study 1 and study 2 are detailed in Table 3.
Table 3 Baseline characteristics of study participants*
(Mean values with standard errors)

* Underweight, BMI = < 18·5 kg/m2; normal weight, BMI = 18·5–24·9 kg/m2; overweight, BMI = 25–29·9 kg/m2; obese, BMI = >30 kg/m2.
Study 1: determination of fatty acid detection thresholds
Fatty acid oxidation
Chromatograms from both C18 : 1 and C18 : 2 revealed no oxidation-related volatiles.
Fatty acid detection thresholds
There were no significant differences in fatty acid detection thresholds between male and female subjects, therefore, the data are presented together. Mean detection thresholds for C18 : 1, C18 : 2 and C12 : 0 were 2·2 (sem 0·1), 1·5 (sem 0·1), 2·7 (sem 0·3) mm, respectively. Detection thresholds ranged from 0·02 to 6·4 mm for all fatty acids, and all the subjects could detect fatty acids within the ranges of concentrations that were offered. Detection thresholds of C18 : 1 and C18 : 2 were highly correlated (r 0·8; P = 0·00), while correlations between C12 : 0 and the C18 were weak (r 0·4; P = 0·02). In a number of subjects, detection thresholds for all the three fatty acids were either low ( < 1·4 mm; n 7) or high (>3·8 mm; n 3).
Sensitivity to prototypical tastants
Mean detection and recognition thresholds for prototypical tastants were as follows: detection thresholds – sucrose: 2·3 (sem 0·1) (range: 0–4·1 mm); citric acid: 0·04 (sem 0·01) (range: 0·03–0·12 mm); NaCl: 0·06 (sem 0·01) (range: 0·00–0·12 mm); caffeine: 0·02 (sem 0·01) (range: 0·00–0·02 mm), MSG: 0·09 (sem 0·01) (range: 0·00–0·18 mm) and recognition thresholds – sucrose: 2·6 (sem 0·3) mm (range: 0·8–4·1 mm), citric acid: 0·04 (sem 0·01) mm (range: 0·02–0·1 mm), NaCl: 0·07 (sem 0·01) mm (range: 0·02–0·1 mm), caffeine: 0·02 (sem 0·01) mm (range: 0·01–0·03 mm), and MSG: 0·09 (sem 0·01) mm (range: 0·06–0·1 mm). Sixteen percentage of the subjects (n 5) were unable to recognise caffeine, 13 % (n 4) were unable to recognise MSG and 9 % (n 3) were unable to recognise sucrose at the highest concentrations presented. All the subjects reached a recognition threshold for citric acid and NaCl. No correlations were observed between detection thresholds for C18 (r − 0·01–0·4, P = 0·09–0·9) or C12 : 0 (r − 0·01–0·16, P = 0·2–0·9) and recognition or detection thresholds for the prototypical tastants used.
Lingual lipase activity
Lipase activity ranged from 0 to 12 μmol fatty acids min/l, with a median activity of 2.
Study 2: determination of oral fatty acid sensitivity
Oral fatty acid sensitivity
Of the subjects, 22 % (n 12) were defined as hypersensitive (three out of three correct identifications), and 78 % (n 42) were defined as hyposensitive (two out of three correct identifications, n 14; one out of three correct identifications, n 25; and zero out of three correct identifications, n 3) to C18 : 1.
Fat ranking test
There was a significant difference between scores obtained in the fat ranking task between hypersensitive and hyposensitive subjects as detected by χ2 test. Hypersensitive subjects scored significantly higher (4·3 (sem 0·6)) compared with hyposensitive subjects (2·3 (sem 0·1), P = 0·02). There was a positive correlation between performance in the fat ranking task and oral fat sensitivity, that is, those who were the more sensitive to C18 : 1 scored higher during the fat ranking task (r 0·484, P = 0·00).
Food consumption
There were differences between hypersensitive and hyposensitive subjects for total energy and fat consumption (Table 4). Energy (kJ) (P = 0·024), fat (P = 0·007) and carbohydrate (P = 0·009) intakes (g) were significantly less, and there was a trend for a lower fat intake as a percentage of total energy intake (P = 0·08) in hypersensitive subjects, compared with hyposensitive subjects. Hypersensitive subjects consumed significantly less (P = 0·05) polyunsaturated fats (g) than hyposensitive subjects. There were no differences in protein, monounsaturated or saturated fat intake (g), the percentage of protein and carbohydrate contributing to total energy intake or the percentage of different fat sources (saturated, monounsaturated or polyunsaturated) towards total fat intake between hypersensitive and hyposensitive subjects. In all the subjects, reported energy intakes were within the recommended ranges for their age, sex, weight and height.
Table 4 Energy intake and macronutrient contribution of hyper- and hyposensitive subjects*†
(Mean values with their standard errors)
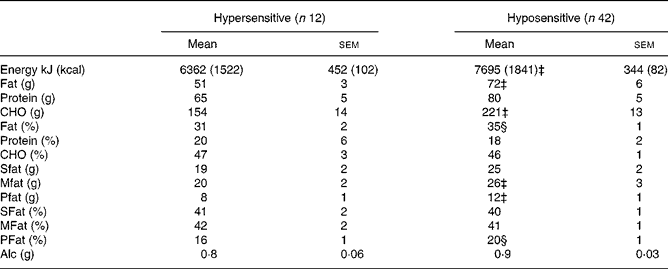
CHO, carbohydrate; Sfat, saturated fat; Mfat, monounsaturated fat; Pfat, polyunsaturated fat; Alc, alcohol.
* Energy intake (kJ) and macronutrient distribution (% energy from CHO, protein and fat), and the type of fat (% energy from total fat; SFat, Mfat and Pfat) and Alc, quantified from a 2 d diet record.
† There were significant (P < 0·05) differences in total energy intake, and fat and CHO intake, between the hypersensitive and hyposensitive subjects as detected by a one-way ANOVA.
‡ Mean value was significantly different compared to that of the hypersensitive subjects (P < 0·05).
§ Mean value was different compared to that of the hypersensitive subjects (P < 0·1).
Body composition
Hypersensitive subjects had significantly lower BMI values (female: 20·2 (sem 0·4) kg/m2 and male: 22·6 (sem 0·0) kg/m2) compared with hyposensitive subjects (female: 21·6 (sem 0·6) kg/m2 and male: 23 (sem 1·5) kg/m2; P = 0·047). There were no overweight subjects in the hypersensitive group compared with 7 % (n 4) in the hyposensitive group.
Discussion
Our data support the hypothesis that fatty acids can be sensed in the oral cavity over a range of concentrations by human subjects, and suggest that oral sensitivity to fatty acids is not related to sensitivity to several prototypical tastants. Furthermore, our data predicate that oral sensitivity to fatty acids may influence habitual fat consumption and be associated with the perception of fat in foods and could affect body weight. Subjects, who were orally hypersensitive to C18 : 1 consumed less energy and fat, were better at detecting small differences in custard containing varying amounts of fat and had lower BMI values than those who were defined as hyposensitive.
Individual sensitivity to oral fatty acids varied considerably and spanned two orders of magnitude for all the fatty acids tested, with all the subjects reaching a detection threshold within the range of concentrations presented. Despite previous studies by Tepper & Nurse(Reference Tepper and Nurse24) that have reported phenotypic variation in taste papillae density, which may be associated with heightened perception of creaminess in fatty foods, the data presented here elucidate that, in addition to differences in sensitivity to texture, individuals may be classified as hyper- or hyposensitive to fats based on their ‘taste’. In the light of our methodological approach (i.e. the use of nose clips, antioxidants, gums and mineral oils) and the low fatty acid concentrations used, we are confident that the thresholds reported in the present study were based on differences in oral chemosensory sensitivity, and not on additional orosensory cues such as olfaction, irritation and texture(Reference Chale-Rush, Burgess and Mattes3). Some previous studies have reported that oral fatty acid sensitivity may be related to taste sensitivity to certain bitter tastants, including 6-n-propylthiouracil(Reference Nasser, Kissileff and Boozer25). The present study did not investigate the association between sensitivity to 6-n-propylthiouracil and sensitivity to fatty acids; however, no correlations were found between any of the fatty acids tested, and any of the prototypical tastants used. We did observe a strong positive correlation between oral sensitivities to C18 : 1 and C18 : 2, which may be suggestive of a common oral peripheral sensor(s) for these structurally similar compounds. In contrast, the correlation between the C18 and C12 : 0 was weak, and may be indicative of an independent oral nutrient sensor responsive to saturated or shorter chain fatty acids. Indeed, animal studies have reported the existence of a family of G-protein receptors including GPR-120, located in the oral cavity, which specifically bind to fatty acids depending upon chain length and saturation(Reference Matsumura, Mizushige and Yoneda8) making differential sensory routes for the C18 and C12 : 0 plausible. Interestingly, there were some subjects who were globally either hyper- or hyposensitive to both C18's and C12 : 0, but the small numbers of subjects precluded statistical analysis of these data. The functional significance, if any, of these differences, including how they may be modified by diet, specifically the consumption of specific fat sources in the diet, and how this affects sensitivity, remains unclear. Future studies are required to address how differences in taste sensitivity are influenced by (1) individual differences in the mechanisms involved in oral fat sensing, and/or (2) differences in habitual consumption of fat-containing foods, with differing fatty acid profiles.
The screening procedure identified hypersensitive individuals as more capable of differentiating between custards based on their fat content, and hypersensitive subjects also consumed less dietary fat. The finding that fat perception, that is, the ability to detect the fat content of custard, was heightened in hypersensitive subjects and was directly related to oral fatty acid sensitivity suggests that sensitivity could play a role in the identification of fats within a food. It has been suggested that specific nutritive compounds, such as sucrose or MSG, may indicate the presence of carbohydrates and proteins within foods(Reference Chandrashekar, Hoon and Ryba9), and we propose that oral fatty acid sensitivity could serve a similar role in the gustatory system for the identification of fats. Acceptance of this theory has, however, been hindered by inconsistent data regarding the presence and activity of lipase in human saliva. The present study confirms lipolytic activity in human saliva that is sufficient to produce micromolar amounts of fatty acids consistent with the levels found in the present study required to stimulate oral sensors, which were in the micromolar to millimolar concentration range. In addition, fatty acids may represent 0·76–3 % w/v of fat in fat-containing foods, providing additional fatty acids to interact with oral sensors(Reference Smith, Cliford and Hamblin26). The proportion of subjects identified as hypersensitive to C18 : 1 were lower in the present study than in two previous studies, in which 46–80 % of the subjects were found to be hypersensitive(Reference Kamphuis4, Reference Nasser, Kissileff and Boozer25). However, the lack of appropriate controls for other sensory inputs, including texture and odour cues, in these studies makes it difficult to make accurate comparisons.
Numerous studies have reported the significance of exposure effects, such as those of habitual nutrient consumption on oral sensitivity to specific nutrients or compounds, and elucidated the plasticity of the gustatory system in this context. For example, acute and chronic Na+ restriction and depletion are accompanied by directional shifts in oral Na sensitivity (which increases) and the preference level of Na+ in common foods (which decreases)(Reference Bertino, Beauchamp and Engelman27, Reference Bertino, Beauchamp and Engelman28). We hypothesised that a similar relationship may exist with fat, whereby a high dietary fat intake would be associated with decreased oral fatty acid sensitivity, and may lead to an increase in dietary fat intake. From an evolutionary perspective, the identification of fats, which are required in limited amounts for energy and nutritional needs, would have served as a beneficial physiological response. However, as fats have become a commonly consumed and easily accessed source of energy, the taste system may become habituated to the higher levels of fat consumed by some individuals. The results from the present study support this proposition as individuals who were orally hypersensitive to C18 : 1 consumed less habitual fat and tended to consume less fat as a percentage of total energy intake. This observation is confirmatory to animal models, and strongly suggests that in human subjects, oral sensitivity to fats may be a determining factor in fat consumption. A relationship between habitual fat consumption and the preferred level of fat in foods has been described by Mattes(Reference Mattes29) and Ledikwe et al. (Reference Ledikwe, Ello-Martin and Pelkman30) who found, in separate investigations, that limiting the amount of fat in the diet decreased preferences, and the frequency of consumption for previously preferred full-fat foods, and increased acceptance of lower fat foods, suggesting a direct relationship between habitual oral fat stimulation and the level of fat preferred in a food. It is therefore conceivable that prolonged, or chronic, consumption of a high-fat diet will lead to a diminished oral sensitivity, thus, raising the possibility that more fat needs to be consumed to elicit a comparable oral response, as has been demonstrated for other compounds sensed within the oral cavity(Reference Zhao and Herness14). As the present study isolated ‘taste’ and did not consider additional sensory cues, including texture and odour, which would also influence food intake during a typical eating episode, it remains unclear as to what influence differences in fat sensitivity would contribute to food and/or fat intake in a ‘real-life’ setting. As hypersensitive subjects consumed less habitual fat than those who were hyposensitive, it is conceivable that taste sensitivity to fats would influence habitual fat consumption, and this issue will need to be investigated in subsequent investigations.
The observation that individuals who were orally hypersensitive to fat also had lower BMI values supports the notion that fat consumption plays a role in the regulation of body weight. Animal models provide robust evidence to suggest a link between oral fatty acid hypersensitivity and increased body weight regulation, as hypersensitive animals reduce energy intake and resist weight gain when exposed to a high-fat diet, whereas hyposensitive animals rapidly gain weight and develop obesity(Reference Gilbertson, Liu and York2). In rodents, these differences in energy intake have also been linked, at least in part, to differential gastrointestinal responses to fat infusions, which reduced energy intake in hypersensitive, but not in hyposensitive, rats(Reference Greenberg, McCaffery and Potack31). Relationships between oral and gastrointestinal fat sensitivities in human subjects are yet to be elucidated.
The results of the present study need to be considered alongside several limitations, which may have confounded the present results. The sample groups used in the present study were recruited from Deakin University, Burwood, VIC, Australia, and they may not be reflective of the general population. It is important to recognise that 2 d diet diaries do not necessarily reflect habitual dietary behaviour, and are prone to under-reporting; however, energy intakes for all the subjects fell within the recommended ranges for their age, sex, height and weight, and food records are a commonly used and accepted method for the assessment of dietary intake(Reference Gibson32). Furthermore, discrimination of oral sensitivity to fatty acids may be confounded by differences in the textural attributes of fatty acid and control samples or by the presence of oxidation products, which can influence taste. However, as discussed, we adopted reliable methods to minimise textural differences and control fat oxidation(Reference Chale-Rush, Burgess and Mattes3), thus, any influence would have been negligible. Self-reported height and weight are prone to over- or under-reporting, respectively; however, this is believed to only deviate significantly from measured values in subjects older than 60(Reference Kuczmarski, Kuczmarski and Najjar33). Nevertheless, we acknowledge that this may have influenced, but most likely underestimated, the strength of the observed relationships.
In summary, we have reported that individuals may be characterised as hyper- or hyposensitive based on their ability to sense C18 : 1 in the oral cavity. Subjects who were orally hypersensitive consumed less overall energy and fat, were more perceptive of small differences in the fat content in food and had lower BMI values than those who were classified as hyposensitive. These results suggest that oral fatty acid sensitivity could play a role in energy and fat intake regulation, which may determine body weight and BMI and warrant further investigation.
Acknowledgements
J. E. S. was supported by a research scholarship from Deakin University and a Food Futures Flagship Scholarship from the Commonwealth Scientific and Industrial Research Organisation, and C. F.-B. by a Career Development Award (Grant no. 299074) from the National Health and Medical Research Council of Australia. We would like to thank Dr Amy Richards, Food Science Australia, Werribee; VIC, for her assistance with solid phase microextraction analysis; and Andrew Howarth, Deakin University, Burwood, VIC, for his assistance with laboratory equipment and obtaining fatty acids. The authors' contributions were as follows: J. E. S. was involved in study design, subject recruitment, study performance, data and statistical analysis, data interpretation and drafting of the manuscript; C. F.-B. was involved in data interpretation and drafting of the manuscript; M. G. was involved in the design of study samples, study design and drafting of the manuscript; C. D. was involved in study design and drafting of the manuscript; and P. M. C. was involved in drafting of the manuscript. R. S. J. K. was involved in study design and concepts, data analysis and interpretation, drafting of the manuscript and had overall responsibility for the study. None of the authors had any conflicts of interest to declare.


