


Over one-third of Americans’ total energy intake comes from foods consumed away from home( 1 ). Yet, because of the lack of transparency about the nutritional quality of restaurant foods, consumers may find it difficult to determine which restaurants are serving the healthiest meals. Popular publications have attempted to characterize certain chain restaurants as healthier than others( Reference Minkin and Renaud 2 , 3 ). In addition, new websites and apps claim to help users select healthier items( 4 , 5 ). Few, if any, of these lay resources have an objective and validated method for determining which restaurants or foods are healthier.
Some researchers have attempted to evaluate overall restaurant healthiness using more standardized measures, such as nutrient profiling. Nutrient profiling is a method that categorizes food healthiness by evaluating the quantity of nutrients and/or the quality of ingredients. But these higher-quality quantitative measures are time and labour intensive. Thus, researchers who use these methods typically evaluate only a small sample of restaurants or limit a review to one point in time( Reference Harris, Schwartz and Munsell 6 , Reference Wu and Sturm 7 ). When researchers have evaluated trends in restaurant foods over time, they have looked only at selected nutrients, and not whole food components (i.e. fruit and vegetable quantity)( Reference Urban, Roberts and Fierstein 8 ).
A more objective and efficient way to analyse the healthiness of chain-restaurant menu items would benefit public health researchers and policy makers. Since so many consumers eat at these restaurants daily, policy makers who may be interested in interventions to improve the healthiness of menus need ways to quickly test their effect on menu quality. Evaluating each food item is useful, but expensive and time-consuming. Public health practitioners may want inexpensive and quick ways to compare different restaurants’ overall healthiness and analyse trends over time. Publishing an objective overall ‘healthiness’ score for a restaurant, as with other rating services (e.g. college rankings, hospital quality), could also promote competition between restaurants for better scores. The major roadblock to doing this type of analysis on many chain restaurants is the volume of menu items in need of analysis.
The aim of the present study was to create a process that combines nutrient- and food-based methods of analysing foods using a cost- and time-efficient procedure. We sought a process that could easily be repeated quickly, as menus are updated. To accomplish this, we used a combination of computer science techniques and nutritional science.
Methods
Before beginning analysis, we had to obtain food and nutritional information from restaurant menus in a standardized format. The nutrition information for chain restaurants is mostly publicly available, but is posted on each company’s website in a different format. Fortunately, the New York City Department of Health maintains a website, menustat.org, that collects and organizes all of this information into a single spreadsheet. The methods are available on the MenuStat website( 9 ). MenuStat collects all nutritional data from the top 200 chains in the USA and has compiled, coded and researched this information each autumn since 2010. For the present study we used the 2014 data.
To achieve our long-term goal of comparing menus at different chain restaurants, we used nutrient profiling to analyse each menu. Giving a single grade to an entire menu, however, is difficult. Some argue that certain items should be weighted more or less heavily in assessing overall healthiness. In the absence of a standard way to analyse a food, we consulted with several nutrition professionals who were part of the RAND Menu Guidelines Group( Reference Cohen, Bhatia and Story 10 ). The group concluded that the best way to compare menus would be by calculating the percentage of healthy items on the entire menu, excluding toppings. This idea came from the research showing that shelf space in grocery stores is correlated with purchases( Reference Frank and Massy 11 , Reference Curhan 12 ). If a store devotes more shelf space to whole wheat bread, more whole wheat bread is likely to be purchased. In addition, there is evidence that an increase in healthy options at a chain restaurant, along with changing the default side items, results in more orders of healthy meals by children( Reference Anzman-Frasca and Mueller 13 , Reference Anzman-Frasca, Mueller and Lynskey 14 ).
To grade each menu based on the percentage of healthy items, we needed to classify each food item as healthy or unhealthy. There are several standards on what would constitute a ‘healthy’ restaurant food. Guidelines from RAND and Kids Live Well focus on an entire meal( Reference Cohen, Bhatia and Story 10 ); thus, we classified individual foods from many parts of the menu, including appetizers and side dishes. Given a specific food, one needs to decide what matters in terms of ‘healthiness’. Some advocate for a nutrient-based analysis (i.e. energy, sodium and vitamin content)( 15 ). Others advocate for a food-based analysis (i.e. servings of vegetables, whole grains)( Reference Cohen, Bhatia and Story 10 ). The nutrient analysis is relatively easy to process, but has limitations, as food manufacturers can make unhealthy food that is nevertheless high in nutrients. A food-based analysis enables researchers to include fruit, nut and vegetable (FNV) amounts when analysing foods. Since fruits, nuts and vegetables are the foods most associated positive health outcomes( Reference Katz and Meller 16 , Reference Lesser, Mazza and Lucan 17 ), including these as part of the classification process may help separate healthy and unhealthy foods.
There are many different nutrient profiling systems to choose from. A recent review characterizes eight of the most widely used( Reference Scarborough, Payne and Agu 18 ). For reasons cited above, our first criterion for selecting a system was that it had to incorporate FNV amounts. Of the three systems that incorporate FNV amounts (i.e. UK-Ofcom, US Interagency and EU Pledge), only the UK-Ofcom has been extensively published in the scientific literature( Reference Scarborough, Payne and Agu 18 – Reference Scarborough, Boxer and Rayner 21 ). The UK-Ofcom nutrient profiling model uses a combination of nutrient- and food-based characteristics to evaluate foods on a per 100 g serving size( 22 ). Healthy and unhealthy food components each get points (positive v. negative), resulting in a total nutrient profile score for each food. The government of the UK used this method to establish which foods can be advertised to children. The researchers who developed the UK-Ofcom system undertook many iterations and sensitivity analyses before deciding on their final model, giving the model scientific credibility( Reference Rayner, Scarborough and Stockley 23 , Reference Rayner, Scarborough and Boxer 24 ). An additional reason for using this model is that it has been previously used to evaluate restaurant foods( Reference Harris, Schwartz and Munsell 6 ). Therefore, using it would allow us to compare our data with previous research in this area.
However, the UK-Ofcom model was developed for assessing which foods should be advertised on television, many of which are packaged foods. The University of Connecticut Rudd Center modified it for use for restaurant foods in the USA( Reference Harris, Schwartz and Munsell 6 ). Table 1 shows the qualifications for a healthy food on the Rudd Modified Nutrient Profile Index, which we refer to hereafter as the ‘MNPI’. The MNPI has a range from 0 (most unhealthy) to 100 (most healthy), as it rescales and changes the direction of scoring from the UK-Ofcom model for easier comprehension. In the UK-Ofcom model the threshold for healthiness is a score of 1 or less for foods, which translates to a score of 64 or higher on the MNPI. To score foods in our study, we used the technical guidance from UK-Ofcom, which scores foods based on nutrients per 100 g serving( 22 ). Thus, we could only score foods for which the manufacturer lists the serving size (i.e. weight) of the food item as listed on the menu. After using the UK-Ofcom scoring rules, we converted the score to the MNPI scale( Reference Harris, Schwartz and Munsell 6 ).
Table 1 Requirements for foods to be categorized as healthy using the Modified Nutrient Profiling Index (MNPI): ‘healthy’ if the item meets both the MNPI (calculated on a per 100 g basis) and the calorie cut-off (calculated on a per item basis) criteria

Since restaurant food portions can be very large, the ‘per 100 g’ method may not correctly categorize extremely large portions of some foods. Thus, the MNPI also uses cut-offs for the maximum calorie (energy) levels of foods, as is displayed on the menu. After applying the UK-Ofcom model’s scoring, the MNPI imposes a calorie cut-off of 350–700 kcal (1464–2929 kJ), depending on the type of food. Therefore, to be categorized as healthy using the MNPI method, the food (as listed on the menu) would need to have an MNPI score of 64 or higher and be under the calorie limit. The Rudd Center’s method also contained an additional sodium limit for foods. Since there is controversy about the relative importance of sodium as a causal factor in CVD( Reference Bayer, Johns and Galea 25 , Reference Taylor, Ashton and Moxham 26 ), we felt the UK-Ofcom’s point system for sodium was sufficient and an additional limit on sodium would not add significant discrimination to the UK-Ofcom scoring system.
The most difficult step in arriving at the MNPI score is determining the amount of FNV in the item. The advantage of the UK-Ofcom method is that it considers such food components, but this makes scoring a laborious process. In previous applications of the MNPI, dietitians scored each food individually to estimate the percentage of FNV by weight in each food. Previous reports that used this method considered only a small number of restaurants; we wanted a method that could assess over 100 restaurants with over 40 000 items per year. To increase scoring efficiency we adopted several computer science techniques.
The first step was to identify the items for which the FNV quantification would not influence whether the food would be classified as healthy or unhealthy. For each food we calculated the MNPI score assuming either a 0 % or a 100 % FNV amount. If both scores were below 64, we classified the food as unhealthy, as no amount of FNV could give the food enough points to cross the healthy threshold. If both scores were greater than 64, the food was initially classified as healthy. (The item later went through analysis to see if it met calorie limits.) If the two extreme scores were on opposite sides of the threshold, we went on to determine the FNV content using two methods.
One method used crowdsourcing, a technique from the field of computer science, in which workers (i.e. ordinary people who sign up for jobs) perform simple tasks online. We used CrowdFlower (San Francisco, CA, USA) for this task. We uploaded to the website (www.crowdflower.com) a spreadsheet of all the item names and instructed the workers to classify the food as having 0–40 %, 40–60 %, 60–80 % or 80–100 % FNV by weight. The workers are given general instructions on how to perform the task. They are not asked to seek out other sources of information, but presumably might do a quick web search to help with the classification. Our working hypothesis was that simply having general knowledge of restaurant items and the food item titles would usually suffice.
Each food item undergoes a ‘judgement’ by a worker. After some pilot experimentation, we decided we needed five judgements (by different workers) per item. Each worker saw five items per page and was paid $US 0·10 per page. Workers could score a maximum of 20 pages. In our pilot work (see below), workers from the USA performed better, so we restricted the final assessments to American workers. CrowdFlower has a number of built-in quality control measures that are customizable by the researcher. We included twenty-four test questions that had a gold standard ‘correct’ answer determined by the dietitian. CrowdFlower uses such questions to ensure crowd workers are not gaming the system or entering low-quality estimates. Before starting the job, workers take a quiz of five test questions and have to achieve a score of at least 70 % (i.e. four correct answers). After they pass this and start making judgements, additional test questions are randomly inserted into their work. If at any point they drop below 70 % accuracy on the test questions, CrowdFlower removes them from the job. As additional controls, workers are removed if they spend less than 30 s on the page. Each worker is allowed a maximum of 100 judgements.
CrowdFlower’s method for determining the ‘final’ answer is called ‘aggregate’, which uses the workers’ performance on the test questions and the degree of agreement with other workers( 27 ). CrowdFlower outputs a ‘confidence score’ for each ‘final’ answer, which gives the researchers an estimation of how confident they can be in the answer( 28 ). Based on a pilot run of data (see the ‘Results’ section), we created a simple, but efficient algorithm for the crowd-sourced estimation (see below).
A second method we used to analyse FNV content was a registered dietitian. He analysed foods using each restaurant’s website (including ingredient lists where available) and the US Department of Agriculture nutrient database. The FNV content of some foods was relatively easily determined because the registered dietitian had a good understanding of: (i) the composition of foods (e.g. strawberry ice cream does not have >40 % strawberries); and (ii) the MNPI food classifications (e.g. fried potatoes are not considered vegetables). Other foods required more research into menu item formulations. For this, the registered dietitian found an image of the item online (usually from the restaurant’s website) and then estimated weights of each component (e.g. burger = bun + patty + toppings), separating out the FNV components, then divided by the total weight of the food item. We used these estimations in the MNPI equations.
After we scored all foods with adequate nutrient information, we determined whether they met the calorie thresholds. Foods that scored above MNPI and calorie thresholds were considered healthy; the rest were unhealthy.
The MenuStat database had 45 955 items in 2014. As a pilot test of our approach to crowdsourcing, we took a purposeful sample of 100 items with various levels of FNV from the (preceding) 2013 database and sent them to the crowd and the registered dietitian to determine FNV amounts. Five crowd workers judged each item. Examining the crowd classifications revealed a pattern: if the crowd marked items as ‘0–40 %’ and the confidence score was greater than or equal to 0·6, it almost always agreed with the dietitian. If the confidence score was less than 0·6 and/or the FNV amount was estimated at >40 %, there was not good agreement. This led to our algorithm: for any items with a confidence score <0·6, or with a crowd-estimated FNV amount >40 %, we ignored the crowd and sought the dietitian’s rating. For other foods, we used the crowd’s rating. In essence, all the items with a significant amount of FNV are sent to the registered dietitian, but the crowd is really good for determining which items have little to no FNV, of which there are many. Our process markedly reduces the number needing an assessment by a dietitian.
Results
The flow of the food items is shown in Fig. 1. For 2014, we started with 45 955 items, of which 23 533 did not have enough nutrition information available for MNPI computation. The most common reasons for this were not providing: the serving size/weight (12 375 items), any nutritional information (3744), and both serving size and sugar quantity (2282). We excluded an additional 2787 items in the ‘toppings and other ingredients’ category. (These items are difficult to classify as they are typically very small portions and there are no accepted standards for healthiness.)
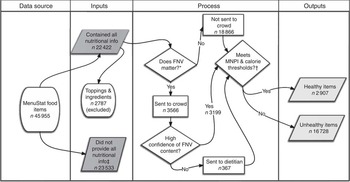
Fig. 1 Flow of food items through the algorithm (FNV, fruit, nut and vegetable content; MNPI, Modified Nutrient Profiling Index). *If extreme assumptions regarding FNV do not matter, we use the MNPI score. †Thresholds are different for different types of foods, see Table 2. ‡Includes toppings and ingredients that could not be scored
Of the 22 422 with complete information, the tests of extreme assumptions showed that the FNV score would not matter for 18 866 foods. Using this test, 4055 were initially classified as healthy (before checking calorie thresholds) and 14 811 were classified as unhealthy irrespective of FNV content. The remaining 3566 foods required further FNV estimation. Of these, the crowd was able to quantify FNV amounts for 3199 using the confidence criteria above. We relied on the dietitian to quantify the remaining 367.
Table 2 shows the characteristics of the foods in the database. The most common items were beverages (n 14 749) and main meals (n 5738). Overall, approximately 7 % of the total items were scored as healthy, ranging from soups (26 % healthy) to desserts (2 % healthy).
Table 2 Healthy classifications by food category in the evaluation of the healthiness of chain-restaurant items from the MenuStat database using crowdsourcing, USA, 2014

Table cells contain raw count or row percentage. Toppings and other ingredients are not included in this table (n 2787). Percentages may not add to 100 % due to rounding. Items that could not be scored were due to the restaurant not providing enough nutritional information (see text for more details).
Discussion
Since so many Americans eat food away from home, policy makers and researchers have sought to improve the healthiness of foods available at chain restaurants. There has been some positive response in terms of menu changes. For example, on 23 January 2014, Subway announced a deal with the Partnership for a Healthier America to improve its kids’ menu( 29 ). In September of 2013, McDonald’s announced an agreement with the Alliance for a Healthier Generation to improve its meals( Reference Wescott, Fitzpatrick and Phillips 30 ).
Most of these announcements and initiatives, however, focus on just one section of the menu. Some chains focus on improving the default side items on the kids’ menu or offering fewer unhealthy bundled options. While these initiatives are helpful, public health officials need to be able to assess menus as a whole. Adding a couple of healthy items may not do much to improve eating practices, if they are buried in a mostly unhealthy menu.
Previous methods have used professionals to analyse each menu item. This is expensive and time-consuming. There are approximately 40 000 items in MenuStat’s annual database. If we were to rely on professionals to evaluate every item, at 5 min per item it would take one dietitian over 40 weeks of full-time work. Assuming a salary of $US 60 000, plus fringe benefits, this would cost roughly $US 63 000. While there were some technology costs in setting up our system, the incremental cost for the analysis of a year of restaurant data was less than $US 2000.
Our method demonstrates how computer science methods can expand the reach of nutrition science. These methods, including crowdsourcing, can vastly reduce the cost to analyse food items on chain-restaurant menus. We were able to process a year’s worth of items in less than a week of working time. This is fast enough for policy makers to apply to assessments of local interventions without needing significant grants or other funds.
Crowdsourcing is used increasingly in many other fields. A recent article describes how the Defense Advanced Research Projects Agency and world health and relief agencies use crowd platforms such as Amazon Mechanical Turk, CrowdFlower and Ushahidi( Reference Allahbakhsh, Benatallah and Ignjatovic 31 ). Researchers have used crowdsourcing-based methods to duplicate classic scientific experiments( Reference Heer and Bostock 32 ).
Other nutrition research has also experimented with using crowdsourcing. In the Harvard PlateMate study, researchers demonstrated an early proof of concept that applies crowdsourcing to nutritional analysis, validating these results with registered dietitians( Reference Noronha, Hysen and Zhang 33 ). A more recent study of foods found that combining expert assessments with crowd-sourced estimates of calories improved accuracy( Reference Moorhead, Bond and Zheng 34 ). Other apps have used crowdsourcing to obtain information on packaged foods( 5 , Reference Dunford, Trevena and Goodsell 35 ).
The weakness of our method is its lack of precision. For many items, we did not compute an exact score, but simply determined whether a food met a healthy threshold by testing extreme assumptions. Many would argue that a dichotomous outcome for healthiness is arbitrary, but this depends on the purpose of the analysis. To assess a policy, such as restricting the advertising of unhealthy foods to children, a cut-off is often desirable. For other purposes, however, an exact score for each food is more useful. The underlying metric for the MNPI is a continuous score; researchers who need exact scores including an FNV assessment could skip the step that tests extreme values. This would take more money to run through the crowdsourcing system, but would still be vastly more efficient than having a professional review each food.
Even if we attempted to generate exact scores for individual items, there would always be some errors and misclassification of those items, as is the case in assessments by a single dietitian. Our method, however, is designed to look at large numbers of menus over time. Precision may be very important for analysing particular food items, but random errors are unlikely to result in systematic biases in estimates over time in many different restaurants. Our method is also adaptable to other nutrient profiling systems. Future research should attempt to replicate our work by using crowdsourcing for analysis of foods in other profiling systems.
A second concern is that assessing healthiness based on the published content of the menu ignores that fact that consumers can customize their selections from a menu. Since most consumers, however, are likely to order items the way they are listed (i.e. the default)( Reference Radnitz, Loeb and DiMatteo 36 ), this is not a totally unreasonable approach. It costs restaurants money to develop new items, train staff to make them and add them to their menu. Thus, restaurants likely create menu items in the most likely configuration a customer is going to order them.
Another major limitation of our method is that we could only analyse foods for which we could calculate nutrient levels per 100 g. While most of the large chains provided the weight of the entire item, as listed on the menu, many did not. (Preliminary analyses by the authors from recent MenuStat data appear to show that the proportion of restaurants listing such data is increasing with time.) However, this limitation is dependent solely on the choice of nutrient profiling system. Other systems are based on scoring foods on a ‘per kilojoule’ or ‘per serving’ basis; there are disadvantages and advantages of each approach( Reference Scarborough, Rayner and Stockley 19 ). The current paper does aim to develop a new scoring system but to show how crowdsourcing could be integrated into a nutrient profiling system that already exists. We felt it was most important to use a system that incorporated FNV amounts. With the UK-Ofcom/Rudd system, we were unable to score many foods, but further iterations of our method could attempt to use other computer science techniques to estimate food weights. Other researchers could adapt our crowdsourcing method for use with other nutrient profiling systems that do not rely on food weights.
There are numerous potential policy and research applications for the data this method makes feasible. We anticipate using it to evaluate menus over time and identify trends in which restaurants or menu categories are increasing in healthiness. Local advocates and officials can also use the technique to analyse menu offerings in their community. Policy makers can use the results to identify programmes most successful in increasing the healthiness of menu offerings.
Future research should replicate our results with other databases of foods. Packaged foods and non-chain restaurants may be another area where crowdsourcing techniques could be leveraged. By collaborating with computer scientists, nutrition scientists may develop new, more efficient ways of analysing foods, analysing the food environment and guiding people to eat healthier.
Acknowledgements
Financial support: The California Endowment supported this work. The funder had no role in the study design, analysis or writing of this article. Conflict of interest: The authors report no conflicts of interest. The website created from this method (grellin.org) is non-commercial and content is shareable under a Creative Commons-Attribution-NonCommercial-ShareAlike 4·0 International Licence. Authorship: L.I.L. performed this research while at the Palo Alto Medical Foundation Research Institute, Palo Alto, CA, USA. L.I.L. designed the research, analysed the data and drafted the manuscript. L.W. developed the methods, analysed data and edited the manuscript. T.B.M. analysed data and edited the manuscript. H.S.L. advised on the methods and data analysis, and edited the manuscript. Ethics of human subject participation: Not applicable.


