Hurricane Sandy made landfall in New York State (NYS) on October 29, 2012, battering parts of New York City (NYC), Long Island, and Westchester County with high winds and strong rains through October 30.Reference Gibbs and Holloway 1 More than 12 million area residents, making up over half of NYS’s population, were affected by the storm to some degree. 2 Extensive flooding damaged property and critical infrastructure, around 7 to 8 million customers lost power, thousands of injuries were reported, and 117 deaths were attributed to the storm.Reference Gibbs and Holloway 1 , Reference Casey-Lockyer, Heick and Mertzlufft 3 The Office of the Mayor of New York City activated a Coastal Storm Plan on October 28, 2012, implementing mandatory evacuations for 375,000 residents of low-lying coastal zones.Reference Gibbs and Holloway 1 Still, the flooding overwhelmed the NYC evacuation zones in Bronx, Kings (Brooklyn), New York (Manhattan), Queens, and Richmond (Staten Island) counties, as well as hurricane storm surge zones in nearby Nassau, Suffolk, and Westchester counties. The inundation disrupted power supplies and disabled sewage and water treatment facilities, possibly cross-contaminating municipal water supplies, and placing the population at increased risk for contracting food and waterborne disease (FWBD).Reference Rose, Epstein and Lipp 4 , Reference McMichael 5
Extreme weather events, including hurricane-instigated flooding, can lead to direct contamination of food and drinking water sources by pathogenic microorganisms or to indirect contamination following refrigeration-compromising power outages and disrupted food distribution networks. 6 , Reference Patz, Vavrus and Uejio 7 Power was lost by 94.4% of Nassau, 77.8% of Suffolk, 69.5% of Richmond, and 40.5% of New York counties; the number of blackouts peaked on October 30, 2012.Reference Lin, Lu and Justino 8 FWBD in association with flooding is a primary concern of health authorities and the public following extreme weather events. 9 Crowding and inadequate hygiene, in association with temporary shelters for displaced persons, can introduce additional hazards.Reference Watson, Gayer and Connolly 10 , Reference Alderman, Turner and Tong 11 For example, epidemics of diarrheal illness have been reported after heavy rainfall and flooding in Austria,Reference Schmid, Lederer and Much 12 Bangladesh,Reference Qadri, Khan and Faruque 13 , Reference Schwartz, Harris and Khan 14 China,Reference Liu, Ding and Zhang 15 India,Reference Fredrick, Ponnaiah and Murhekar 16 Mozambique,Reference Kondo, Seo and Yasuda 17 Pakistan,Reference Ahmed, Khan and Nisar 18 and the United States,Reference Wade, Sandhu and Levy 19 - Reference Yee, Palacio and Atmar 21 most often following displacement of evacuees to inadequate and overcrowded facilitates.Reference Kouadio, Aljunid and Kamigaki 22 The elderly, infants, and children are likely to be especially vulnerable to FWBD following extreme weather events.Reference Patz, Vavrus and Uejio 7 , Reference Wu, Xiao and Li 23 , Reference Callaghan, Rasmussen and Jamieson 24 In urban areas, low-income, inner-city populations, and those without access to motor vehicles, appear to be more vulnerable to adverse health impacts from extreme weather events as well.Reference Renne, Sanchez and Litman 25 , Reference Flanagan, Gregory and Hallisey 26
Our aim in this analysis was to evaluate the impact of residence in low-lying, coastal storm-surge areas of NYC, and nearby Nassau, Suffolk, and Westchester counties, as a risk factor for FWBD associated with Hurricane Sandy and the mandatory evacuation order. In doing so, our goal was to offer recommendations for preventive measures to reduce adverse health impacts following future extreme weather events.
METHODS
Study Population
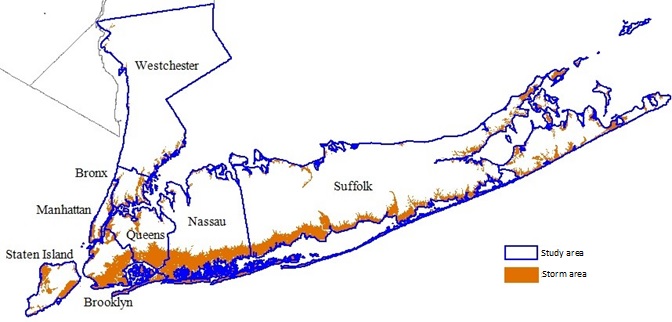
The study population comprised individuals residing in NYC (Bronx, Kings, New York, Queens, and Richmond counties), Long Island (Nassau and Suffolk counties), and Westchester County in NYS, between October 28 and November 9 during 2001 to 2012. The risk period was defined according to the emergency declaration and evacuation order issued in advance of Hurricane Sandy’s landfall on October 28, 2012, and the end of the US Federal Emergency Management Agency (FEMA) emergency incident period on November 9, 2012. We geocoded individuals living in the study catchment area as residents of either the “storm area” or the “non-storm area” by using street address, based on emergency management agency-established coastal storm plan evacuation zones in NYC, or hurricane storm surge zones in Nassau, Suffolk, and Westchester counties (Supplementary Figure 1 in the online data supplement).
Study Outcome
We retrospectively captured incident outpatient (ie, emergency department) and inpatient FWBD diagnoses by using the NYS Department of Health Statewide Planning and Research Cooperative System (SPARCS). SPARCS is a legislatively mandated database capturing discharge diagnoses for approximately 95% of NYS hospitals (ie, excludes only federal and psychiatric facilities). Diagnoses are indexed by billing address, rather than treatment site, allowing us to identify the likely location of cases’ residence. Using Map Marker v.22 (Pitney Bowes Software Inc, Troy, NY) and SAS v. 9.3 (SAS Institute, Inc, Cary, NC) most cases (98%) were geocoded to street-level resolution. Outpatient SPARCS records were available to us beginning in 2005, while inpatient records were available beginning in 2001. We captured all NYS outpatient and inpatient FWBD discharges between October 28 and November 9, 2001-2012, by including the 9th Revision of the International Classification of Diseases (ICD-9) discharge codes 003-009 (see Supplementary Table 1 in the online data supplement). Data access and use was approved by the NYS Department of Health Institutional Review Board and the SPARCS Data Protection Review Board.
Statistical Analysis
We characterized the number and proportion of outpatient and inpatient FWBD diagnoses made in the 13 days between October 28 and November 9 (ie, the “study interval”), in 2005 to 2012 or 2001 to 2012, respectively. Using the chi-square test, we assessed unadjusted differences by study area (storm and non-storm), for age, sex, race, ethnicity, county of residence, year of diagnosis, and source of payment for health care services as an indicator of socioeconomic status. We used multivariable Poisson or negative binomial (ie, to accommodate overdispersion) regression models to calculate risk ratios (RRs) and 95% confidence intervals (CIs) for FWBD diagnoses made during the “post-Sandy” period, defined as the study interval in 2012, relative to the average “pre-Sandy” baseline period, defined as the study interval in 2005-2011 (outpatient) or 2001-2011 (inpatient). We used generalized estimating equations (GEEs) to accommodate observations correlated by county of residence, 2010 US census population totals as the offset based on zip code centroids (census tracts did not conform to storm and non-storm areas), 2 and included variables representing the pre-/post-Sandy interval, study area (storm or non-storm), the cross product of pre-/post-Sandy interval × study area to assess the interaction, day of the week (ie, short-term trend), and year (ie, long-term trend). Models were implemented in proc genmod by using the slice statement to assess overall effects. We constructed individual regression models for outpatient and inpatient diagnoses, confirmed the plausibility of model assumptions, and stratified by sex, age, race, and county of residence. We further assessed associations by ICD-9 code, to evaluate heterogeneity across FWBD diagnoses. In a sensitivity analysis, we also evaluated the impact of a 28-day risk period on outpatient FWBD diagnosis. SAS v. 9.3 (SAS Institute, Inc) was used for all analysis and statistical significance was defined as P<0.05 for a two-tailed test.
RESULTS
Descriptive Analysis
Table 1 characterizes 2372 total outpatient FWBD events reported by hospitals in the study area between October 28 and November 9, from 2005-2012 (characterized graphically by Figure 1). Most cases lived in the non-storm area (75.0%), and approximately 25% of cases resided in the storm area, primarily in NYC counties (83.7%). The age distribution differed somewhat for outpatient diagnoses in the storm and non-storm areas (P=0.04). A higher proportion of diagnoses in persons <19 years of age was made in the non-storm area (63.3%) than in the storm area (57.8%), whereas a higher proportion of diagnoses among persons ≥20 years of age was made in the storm area (42.2%) than in the non-storm area (36.6%). Blacks (37.0% vs. 24.9%, P<0.01) and persons of non-Hispanic ethnicity (63.5% vs. 49.7%, P<0.01) made up larger proportions of outpatient FWBD cases in the storm area than in the non-storm area. There also existed substantial heterogeneity by county in terms of the proportion of outpatient FWBD diagnoses among residents of the storm and non-storm areas (P<0.01). There was no difference in the distribution of outpatient FWBD diagnoses and sex (P=0.42), year of diagnosis (P=0.25), or source of payment for medical services (P=0.10). Most outpatient FWBD diagnoses (69.2%) were attributed to ICD-9 008 (intestinal infections due to other organisms; Supplementary Table 1 in the online data supplement).

Figure 1 Total Number of Outpatient and Inpatient Food and Waterborne Disease Diagnoses in the Study Catchment Area, From October 28 to November 9, 2005-2012 and 2001-2012, Respectively.
Table 1 Demographics to Characterize Incident Food and Waterborne Disease Outpatient Visits Among Residents of Hurricane Sandy Storm and Non-Storm Areas, 2005-2012Footnote a

a Storm areas defined as New York City Evacuation Zones (Bronx, Queens, New York, Kings, and Richmond Counties) or as Hurricane Storm Surge Zones in Nassau, Suffolk, and Westchester Counties.
b P Value for difference between storm and non-storm areas by chi-square test.
We also captured 7229 total inpatient FWBD diagnoses reported by hospitals in the study area, between October 28 and November 9, from 2001-2012 (Supplementary Table 2 in the online data supplement and Figure 1). Most inpatient FWBD diagnoses were made in the non-storm area, with the exception of participants 65 years of age and older, for whom more diagnoses were from the storm area (62.9% vs. 59.7%, P=0.01). Inpatient FWBD diagnoses were also more common among blacks (P<0.01) in the storm area (23.1%) relative to the non-storm area (16.5%), whereas diagnoses among “other/unknown” race was more likely in the non-storm area (23.6%) than in the storm area (20.0%). Again, there was substantial heterogeneity by county in terms of the proportion of FWBD diagnoses among residents of the storm and non-storm areas (P<0.01). However, we did not detect differences by sex or year of diagnosis for inpatient FWBD diagnosis. Storm area residents receiving an inpatient FWBD diagnosis were less likely than non-storm area residents (P<0.01) to self-pay (1.6% vs. 3.3%), to use Medicaid (9.8% vs. 11.5%), or to use private insurance (30.2% vs. 32.4%). The majority of inpatient FWBD diagnoses (86.8%) were again attributed to ICD-9 008 (intestinal infections due to other organisms; Supplementary Table 1 in the online data supplement).
Multivariable Analysis
Table 2 describes covariate-adjusted RRs and 95% CIs for outpatient FWBD diagnosis in the storm and non-storm areas, during the post-Sandy period relative to the 2005-2011 pre-Sandy period. Risk was lower among storm area residents during the post-Sandy period relative to the pre-Sandy period (RR=0.58, 95% CI: 0.46-0.74), with a similar trend, albeit not statistically significant, for residents of non-storm areas (RR=0.63, 95% CI: 0.38-1.04). The effect appeared somewhat stronger for males (RR=0.53, 95% CI: 0.38-0.75) than for females (RR=0.65, 95% CI: 0.45-0.93). In contrast, outpatient FWBD risk was higher in the post-Sandy period for storm area residents 65 years of age and older, relative to the pre-Sandy period (RR=2.16, 95% CI: 1.11-4.19), adjusted for the impact in the non-storm area (RR= 1.45 95% CI: 0.64-3.25). This manifested as 5.36 additional outpatient FWBD diagnoses per 100,000 residents aged ≥65 years in 2012 relative to 2005-2011. Yet, we captured only n=24 outpatient FWBD cases aged ≥65 years in 2012 and so the effect estimates were imprecise (ie, ICD-9 codes 009 [n=9], 008 [n=8], and 005 [n=7], distributed uniformly across the risk interval, and with greatest frequencies from Nassau [29.2%] and Queens [29.2%] counties). Younger storm area residents were, however, at lower risk post-Sandy (RR=0.34, 95% CI: 0.18-0.64 for 5-19 years; RR=0.61, 95% CI: 0.48-0.76 for 20-64 years). In both storm and non-storm areas, residents of New York County (RR=0.50, 95% CI: 0.29-0.87 and RR=0.37, 95% CI: 0.21-0.64, respectively) and Queens County (RR=0.40, 95% CI: 0.20-0.77 and RR=0.26, 95% CI: 0.18-0.39, respectively) experienced lower risks for outpatient FWBD diagnosis in the post-Sandy period than were experienced in the pre-Sandy period. With few exceptions, other effect estimates, although not statistically significant, suggested reduced risks. Owing to small cell sizes (n=1 case in the storm area), we did not calculate separate estimates for Westchester County. There were no meaningful differences in outpatient FWBD diagnosis effects using a 28-day risk interval in lieu of the 13-day risk interval (Supplementary Table 3 in the online data supplement).
Table 2 Risk Ratios (95% Confidence Intervals) for Incident Food and Waterborne Disease Outpatient Diagnoses, From October 28 to November 9, 2012, Relative to October 28 to November 9, 2005-2011, Among Residents of Hurricane Sandy Storm Areas and Non-Storm AreasFootnote a

a Poisson or negative binomial regression models adjusted for day of the week (short-term trend), year (long-term trend), including a cross product term between pre-/post-Sandy interval and study area, and offset by the 2010 US Census population total. Statistically significant results (P<0.05) in boldface; time-trend effects in storm and non-storm areas not statistically different (P>0.05).
b Storm area includes those categorized as evacuation zones A, B, and C in Bronx, Kings, New York, Queens, and Richmond counties, and areas categorized as storm surge zones categories 1, 2, 3, and 4 in Nassau and Suffolk Counties.
c Non-storm areas include those not categorized as storm areas.
Table 3 describes covariate-adjusted RRs and 95% CIs for inpatient FWBD diagnosis in the storm and non-storm areas, during the pre-Sandy period relative to the 2001-2011 post-Sandy period. We did not detect significant main effects for individuals residing in the storm area. However, non-storm area females were again at a reduced risk (RR=0.76, 95% CI: 0.66-0.95), as were whites (RR=0.78, 95% CI: 0.62-0.98), other races (RR=0.75, 95% CI: 0.63-0.89), and Queens County residents (RR=0.62, 95% CI: 0.41-0.94). In contrast to outpatient FWBD risks, the risk for inpatient FWBD was lower in the post-Sandy period than in the pre-Sandy period for individuals aged ≥65 years, and the effect was significantly stronger for non-storm areas (RR=0.68, 95% CI: 0.52-0.89) than for storm areas (RR=0.89, 95% CI: 0.67-1.18), as assessed by the interaction. We also detected an interaction for residents of Nassau County, in which storm area residents experienced little change for inpatient FWBD risk (RR=1.06, 95% CI: 0.64-1.75), while non-storm area residents experienced approximately half the risk (RR=0.53, 95% CI: 0.32-0.89); again, the effect in non-storm area residents was significantly larger than the effect in storm area residents. As for outpatient FWBD, with few exceptions, the remaining effect estimates suggested reduced, although not statistically significant, risks for inpatient FWBD. We were unable to generate stratified estimates for Westchester County, given n=1 case in the storm area.
Table 3 Risk Ratios (95% Confidence Intervals) for Incident Food and Waterborne Disease Inpatient Diagnoses, From October 28 to November 9, 2012, Relative to October 28 to November 9, 2001-2011, Among Residents of Hurricane Sandy Storm Areas and Non-Storm AreasFootnote a

a Poisson or negative binomial regression models adjusted for day of the week (short-term trend), year (long-term trend), including a cross product term between pre-/post-Sandy interval and study area, and offset by the 2010 US Census population total. Statistically significant results (P<0.05) in boldface.
b Storm area includes those categorized as evacuation zones A, B, and C in Bronx, Kings, New York, Queens, and Richmond counties, and areas categorized as storm surge zones categories 1, 2, 3, and 4 in Nassau, Suffolk, and Westchester Counties.
c Non-storm areas include those not categorized as storm areas.
d Time trend effects in the storm and non-storm areas significantly different (P<0.05).
We also evaluated covariate-adjusted risk ratios for specific FWBD diagnoses during the post-Sandy period relative to the pre-Sandy period (Table 4). We detected a lower risk for outpatient diagnosis of ICD-9 008 (intestinal infections due to other organisms) in storm areas (RR=0.50, 95% CI: 0.34-0.74) and for inpatient diagnosis in non-storm areas (RR=0.73, 95% CI: 0.57-0.94). Owing to small numbers of cases, we were unable to generate stratified effect estimates for ICD-9 003 (other Salmonella infections, outpatient) or for ICD-9 004 (Shigellosis), ICD-9 006 (Amebiasis), or ICD-9 007 (other protozoal intestinal diseases).
Table 4 Risk Ratios (95% Confidence Intervals) for Specific Food and Waterborne Disease Outpatient and Inpatient Diagnoses, From October 28 to November 9, 2012, Relative to October 28 to November 9, 2005-2011 or 2001-2011, Respectively, Among Residents of Hurricane Sandy Storm Areas and Non-Storm AreasFootnote a
a Abbreviation: ICD-9, International Classification of Disease, 9th Revision. Poisson or negative binomial regression models adjusted for day of the week (short-term trend), year (long-term trend), including a cross product term between pre-/post-Sandy interval and study area, and offset by the 2010 US Census population total. Statistically significant results (P<0.05) in boldface. There were an insufficient number of case diagnoses to assess outpatient “other Salmonella infections” (ICD-9 002-003), or for “shigellosis” (ICD-9 004), “amebiasis” (ICD-9 006), and “other protozoal intestinal diseases” (ICD-9 007). Time-trend effects in storm and non-storm areas not statistically different (P>0.05).
b Storm area includes those categorized as evacuation zones A, B, and C in Bronx, Kings, New York, Queens, and Richmond counties, and areas categorized as storm surge zones categories 1, 2, 3, and 4 in Nassau, Suffolk, and Westchester Counties.
c Non-storm areas include those not categorized as storm areas.
DISCUSSION
We conducted a retrospective time-trend analysis of incident FWBD diagnoses to assess the health impact of Hurricane Sandy-associated flooding in the greater NYC area and compared effects in storm area residents to non-storm area residents. Overall, our data suggest lower risks for FWBD in the post-Sandy period relative to the pre-Sandy period, both for residents of storm areas and for residents of non-storm areas. This pattern was generally robust to stratification by sex, race, and county of residence. The change appears to have been due in large part to reduced risks for diagnosis of ICD-9 008 (intestinal infections due to other organisms), without concomitant increases in related diagnoses. Still, the post-Sandy outpatient FWBD risk for storm area residents aged ≥65 years was more than double the pre-Sandy risk, consistent with reported vulnerabilities among the aging.Reference Wu, Xiao and Li 23 However, the effect estimate was based on very few exposed cases and so coupled to multiple conducted statistical tests it may reflect a chance observation and should be interpreted with caution. In contrast, inpatient FWBD risk was decreased during the post-Sandy period for age ≥65 years and with a stronger effect for non-storm area residents. It seems unlikely for a “competing risk” to account for this pattern, in that persons who would be hospitalized as inpatients in the pre-Sandy period were treated as outpatient in the post-Sandy period. Rather, it is tempting to speculate that risk among older residents increased for more moderate FWBD (ie, not severe enough to merit hospitalization), whereas risks for more severe FWBD (ie, requiring hospitalization) decreased in the post-Sandy period.
Our overall results are consistent with a building consensus that the risk for infectious disease is typically low following hydrometeorological disasters in highly developed, high-income nations; in particular, in the absence of large-scale population displacement.Reference Kouadio, Aljunid and Kamigaki 22 , Reference Ivers and Ryan 27 A previous NYC study of 42 reportable diseases, including 16 gastrointestinal and related illnesses after Hurricane Sandy also reported that there was no increased risk for hurricane-affected relative to unaffected areas.Reference Greene, Wilson and Konty 28 Furthermore, no increased risk for gastrointestinal distress was reported following earlier hurricane events in Connecticut, Mississippi, and Rhode Island. 29 However, a large outbreak of norovirus-associated gastroenteritis was reported from 2 refugee facilities, housing more than 125,000 displaced New Orleans residents in Houston, Texas, possibly due to sewage exposure from flooding instigated by Hurricane Katrina.Reference Yee, Palacio and Atmar 21 , Reference Murray, Kilborn and DesVignes-Kendrick 30 Although NYC opened 73 evacuation shelters in preparation for Hurricane Sandy, most closed in less than 48 hours, and only 12 continued to operate for 7 or more days.Reference Ridpath, Bregman and Jones 31 Still, an emergency shelter-based outbreak of gastrointestinal disease, likely norovirus, was reported 5 to 6 days after the storm,Reference Ridpath, Bregman and Jones 31 underscoring the vulnerability of displaced persons. Illnesses such as this shelter-based outbreak are unlikely to be captured in the SPARCS dataset. The overall limited and mostly short-term population displacement associated with Hurricane Sandy in the greater NYC area may also have mitigated the risk for FWBD during the post-Sandy interval.Reference Ridpath, Bregman and Jones 31 , Reference Brown and Parton 32
The counterintuitively lower post-Sandy FWBD risks detected in our study might reflect the impact of public health measures and increased vigilance on the part of catchment area residents. For example, on October 29, 2012, NYC raised chlorine levels and implemented ultraviolet disinfection in response to high turbidity detected in a nearby Westchester County drinking water reservoir; the turbid source was quickly replaced. 33 In collaboration with private suppliers, NYC also provided more than 2.1 million meals ready to eat, 1,000,000 bottles of water, and 719,000 hot lunches and dinners to affected residents, between November 1, 2012, and January 31, 2013.Reference Gibbs and Holloway 1 NYC is home to more than 460 combined sewage outflows (CSOs), which discharge raw domestic sewage into the Hudson River and the New York Harbor during heavy precipitation events.Reference Patz, Vavrus and Uejio 7 , 34 In Massachusetts, even small-scale flooding is associated with a higher rate of emergency room gastrointestinal complaints, up to 4 days following heavy rainfall events in areas with CSOs.Reference Jagai, Li and Wang 35 Heavy rainfall was also correlated to diminished water quality in urban areas serviced by CSOs in a recent Canadian study.Reference Gooré, Monette and Gasperi 36 Despite the high density of CSOs in the study catchment areas, and substantial flooding associated with the Hurricane Sandy storm surge, we detected increased FWBD risk for only older residents of storm areas, intimating the general effectiveness of disaster management during this event.
A recent systematic review concluded that little evidence exists to support the effectiveness of basic water, sanitation, and hygiene interventions (“WASH”) following humanitarian crises in poorly developed, or in low- and middle-income nations.Reference Ramesh, Blanchet, Ensink and Roberts 37 However, such interventions appear to be more effective in well-developed and high-income nations, including in the United States, possibly related to a lower likelihood for population displacement following an event, more extensive and widespread interventions, more effective population uptake, and more intensive surveillance activities.Reference Brown and Murray 38 In fact, trauma-related morbidity, rather than illness-related morbidity, is reported most frequently in association with extreme weather events occurring in high-income nations such as the United States.Reference Doocy, Dick and Daniels 39 Our study results reinforce this perspective, and furthermore underscore the likely value of public health planning activities in advance of extreme weather events.
Our study results may have been impacted by a dynamic study population, given evacuations and hospital closings in the catchment area during the storm. Approximately 375,000 individuals resided in mandatory NYC evacuation zones, and 5 hospital facilities evacuated.Reference Gibbs and Holloway 1 Yet, only 37% of the residential population appear to have complied with the evacuation order, half of them having left before Hurricane Sandy made landfall.Reference Brown and Parton 32 It is possible that our study results reflect diminished medical services utilization or case underascertainment in the post-Sandy interval, with only the most serious cases visiting hospitals for treatment, or use of more distant treatment facilities by evacuees or due to closings. Still, we identified similar decreased FWBD risks for residents of storm areas and nearby non-storm areas, and we did not detect increased risks for inpatient FWBD. It is also unlikely that differential use of health care facilities outside of NYS, during the pre-Sandy and post-Sandy periods, by both storm area and non-storm area residents, accounts for our results. Admission of NYS residents to hospitals outside of NYS is reported to and captured by the SPARCS database. Still, the total number of outpatient FWBD diagnoses in the post-Sandy period was consistent with a decreasing trend for the preceding years and with similar numbers for inpatient diagnosis and so any impact was likely to have been modest.
Notwithstanding a large number of incident cases overall, including the pre-Sandy and post-Sandy study intervals, and linkage to residential street billing address, several important factors limit our study results. Our risk period was defined as the 13 FEMA emergency incident period days, ending on November 9, 2012, to capture case diagnosis we believe most likely to have been associated with Sandy and the mandatory evacuation order issued on October 28, 2012. We compared this interval with the same interval, for the 7 (outpatient) or 11 (inpatient) preceding years in a time-trend analysis,Reference Stroup, Wharton and Kafadar 40 adjusting for year to accommodate long-term trends, and using 2010 Census data for the denominator. 2 We also compared the time-trend to nearby “non-storm” areas to accommodate year-to-year variability in seasonal factors or admission policies. We may have missed cases with incubation periods longer than the 13-day risk window; however, we had similar outpatient results using a 28-day risk period. With few exceptions (eg, amebiasis), the incubation period for most FWBD ranges from <2 to 8 days.Reference Lee, Lessler and Lee 41 , Reference Heymann 42 We captured few cases of protozoal infection, and so were unable to assess the time trend. A future investigation focused on protozoal infection is needed to more definitively assess the risk. Furthermore, to reduce outcome misclassification we captured only clinically confirmed FWBD diagnoses as study outcomes, rather than use a syndromic case definition. Finally, our ecological exposure assessment strategy, in which residents were classified as “storm area” vs. “non-storm area” may have introduced misclassification, such as individuals living in non-storm areas in close proximity to and affected similarly to those in storm areas, or individuals living in unaffected subsections of storm areas. Still, we would expect such misclassification to be unrelated to diagnosis and to have biased the results towards the null hypothesis.
CONCLUSIONS
Overall, our study results suggest that most FWBD risks decreased in the post-Sandy period relative to the pre-Sandy period, for residents of storm-affected and non-storm affected areas. In the absence of bias, these results suggest that disaster management planning and mitigation, and public health interventions, were effective in preventing FWBD associated with flooding due to the storm surge. However, the risk for outpatient FWBD diagnosis may have increased for residents aged ≥65 years in the post-Sandy period, raising the possibility for a vulnerable population to which targeted strategies should be developed for mitigating risk during future extreme weather events.
Acknowledgments
The authors thank Mr Cris Pantea and Dr Seema Nayak from the Center for Environmental Health, New York State Department of Health; Dr Srishti Shrestha from the National Institute of Environmental Health Sciences; and Mr Ziqiang Lin and Mr Wangjian Zhang from the University at Albany, SUNY, for their support on data management, analysis, and results table preparation. We also thank the staff and administrators from Bureau of Environmental and Occupational Epidemiology, Center for Environmental Health, for their support on this project.
Funding
This work was supported by Grant #1U01 TP000566-01 from the Centers for Disease Control and Prevention (CDC). The content is solely the responsibility of the authors and does not necessarily represent the official views of the CDC.
Supplementary Material
To view supplementary material for this article, please visit http://dx.doi.org/10.1017/dmp.2016.85