


Sustainable diets are defined as nutritionally adequate, safe and healthy, culturally acceptable, financially affordable and with low environmental impacts( 1 ). Reducing emissions arising from the food system is a major lever for achieving greenhouse gas emission (GHGE) reduction targets( 2 – 4 ). This reduction could be partly achieved through shifts in food consumption since the same quantities of different foods emit different levels of greenhouse gas, with livestock products being the largest emitters( Reference Stehfest, Bouwman and van Vuuren 5 ). In the pioneering report How Low Can We Go?, Audsley et al. ( Reference Audsley, Brander and Chatterton 6 ) explored a set of scenarios to reduce UK GHGE by 70 % by 2050, and suggested that a vegetarian diet or a reduction in livestock product consumption could help meet this target. In parallel, public health authorities recommend consuming plenty of plant-based foods and a moderate amount of animal products, especially red and processed meats( 7 ). Hence it has been suggested that dietary changes aimed at reducing diet-related GHGE may also promote health( Reference Friel, Dangour and Garnett 8 , Reference Tukker, Goldbohm and de Koning 9 ).
Some studies investigating dietary scenarios( Reference Scarborough, Allender and Clarke 10 , Reference Aston, Smith and Powles 11 ) or self-selected diets( Reference Monsivais, Scarborough and Lloyd 12 ) with reduced meat consumption in the UK have strengthened the message of a compatibility between health and environmental dimensions. However, in a Dutch cohort, the GHGE of usual diets were not associated with mortality, indicating that an environmentally friendlier diet is not necessarily a healthier diet( Reference Biesbroek, Bueno-de-Mesquita and Peeters 13 ). Other studies showed that higher nutritional quality was associated with higher GHGE in self-selected French diets( Reference Vieux, Soler and Touazi 14 , Reference Masset, Vieux and Verger 15 ). Thus there is still no consensus on the compatibility between health or nutrition and environmental dimensions.
Affordability is another important dimension of sustainable diets( 1 ). Healthy diets are known to be generally more expensive than unhealthy diets( Reference Andrieu, Darmon and Drewnowski 16 , Reference Darmon and Drewnowski 17 ), as recently confirmed in studies investigating affordability, healthy dietary pattern and GHGE( Reference Monsivais, Scarborough and Lloyd 12 ).
Diet optimization by linear programming has been used in human nutrition to assess the compatibility between nutritional adequacy and affordability of diets, or the gaps in consumption between observed and recommended dietary patterns at population and individual levels( Reference Maillot, Vieux and Amiot 18 – Reference Masset, Monsivais and Maillot 21 ). Linear programming is also a powerful tool to design nutritious diets with a low environmental impact: two studies combined affordability, GHGE reduction and nutritional adequacy in linear programming models( Reference Macdiarmid, Kyle and Horgan 22 , Reference Wilson, Nghiem and Ni Mhurchu 23 ). However, these modelling studies were not based on observed food consumption data, which may compromise the cultural acceptability of the proposed modelled diets.
The main objective of the present study was to assess – using diet modelling with linear programming – the compatibility between the reduction of dietary GHGE and the other dimensions of diet sustainability, namely nutritional adequacy, cultural acceptability and affordability. The population’s mean observed diet was considered a proxy for a culturally acceptable diet. Thus, to avoid deteriorating the acceptability as much as possible, the models minimized the departure, in terms of food content, from the mean observed diet. The impact of stepwise GHGE reductions on nutritional quality, cost and cultural acceptability of modelled diets was assessed for increasingly stringent levels of nutritional constraints.
Materials and methods
Population sample and dietary data
Dietary intakes were derived from the 7 d food records of a nationally representative stratified random sample of French adults (n 2624; aged >18 years) participating in the Second French Individual and National Study on Food Consumption cross-sectional dietary survey (Étude Individuelle et Nationale sur les Consommations Alimentaires, INCA2), conducted in 2006–2007 by ANSES (the French agency for food, environmental and occupational health safety)( Reference Lafay, Bénetier and Bertin 24 ). After exclusion of energy under-reporters using Black’s equations( Reference Black 25 ) and individuals consuming hypo-energetic meal substitutes, the present analysis was conducted on a final sample of 1899 adults, aged 47·1 (sd 15·3) years, of whom 1126 were women. The CIQUAL database associated with the survey gives the detailed nutrient composition of all the foods declared to be consumed by the participants (1342 foods and beverages, including water).
Greenhouse gas emissions of foods
GHGE estimates, expressed in grams of CO2 equivalents (g eqCO2), were assigned by the environmental consulting firm Bio by Deloitte (formerly Greenext Service, Paris, France) to 402 foods either selected as being among those most consumed by INCA2 participants, as described by Vieux et al. ( Reference Vieux, Soler and Touazi 14 ), or identified as having a potential nutritional and/or environmental utility (e.g. soya-based products, some unrefined starchy foods, chestnuts). The GHGE values were assigned based on a hybrid input–output/life cycle assessment (LCA) method using the international ISO 1404x:2006 LCA standards( 26 , 27 ) and the specific French BP X30-323-0 guidelines( 28 ). The estimates include the whole life cycle of foods, from farm production to usage and waste management of packaging, but exclude emissions arising from indirect land-use change and the highly variable emissions from consumers’ transport from retail to home. For composite food items, the LCA analysis considers the GHGE of each ingredient and their proportion in the product, based on the recipes provided by the INCA2 survey. The hybrid approach combined French trade and production data( 29 , 30 ) and standard life cycle inventory data (e.g. Ecoinvent( Reference Althaus, Doka and Dones 31 )) so that the GHGE values assigned reflected the average food products as consumed in the French market( Reference Bertoluci, Masset and Gomy 32 ).
Aggregation of dietary data
The intakes of the 1342 foods declared to be consumed by INCA2 participants were aggregated into the 402 foods for which GHGE estimates were available, using a nutritional Euclidean distance method developed specifically for the study (see online supplementary material, Supplemental methods, for a full description). Energy and nutrient intakes calculated with the original database of 1342 foods and with the aggregated database of 402 foods are given in Supplemental Table 1.
Diet modelling by linear programming
Linear programming models were developed to design diets with reduced GHGE and subjected to a set of nutritional constraints, while remaining as close as possible to the mean diet of the French adult population. The impact of the GHGE constraint on food choices, nutritional quality and cultural acceptability was evaluated by incrementally decreasing diet-related GHGE. Three levels of nutritional exigencies were defined by increasingly stringent nutritional constraints. The cultural acceptability dimension was considered through the objective function by minimizing departure from the mean observed diet. In addition, acceptability constraints on food quantities and energy were used in all models to ensure that the modelled diets remained within the range of diets actually consumed by the general French adult population. All linear programming models were run using the statistical software package SAS version 9·4. The characteristics of the linear programming models (objective function and constraints) are summarized in Table 1.
Table 1 Constraints in the FREE, MACRO and ADEQ scenarios

FREE; no nutritional constraints; MACRO, constraints on macronutrients only; ADEQ, constraints on all nutrients; GHGE, greenhouse gas emissions.
* 8109 kJ/d (1938 kcal/d) for women, 10 891 kJ/d (2603 kcal/d) for men.
† Calculated for men and women separately.
‡ For foods, non-consumers excluded; for food subgroups and groups, non-consumers included.
Nutritional constraints defining the FREE, MACRO and ADEQ scenarios
To assess the compatibility between the imposed reductions of dietary GHGE and nutritional quality of modelled diets, three nutritional scenarios were designed based on increasingly stringent levels of nutritional constraints: (i) no nutritional constraints (FREE scenario); (ii) constraints on macronutrients only (MACRO scenario), in which proteins, total fat and carbohydrates were constrained to minimal and maximal percentages of total energy; and (iii) constraints on all nutrients (ADEQ scenario), in which, in addition to macronutrients, micronutrients, fibre and fatty acids were constrained to a minimal quantity based on the RDA estimated to meet the nutrient needs of 97·5 % of adults in the population and/or a maximal quantity based on recommended upper limits. The values of the nutritional constraints, summarized in Table 1, were derived from WHO recommendations for proteins( 7 , 33 ), carbohydrates( Reference Mann, Cummings and Englyst 34 ), total fat, linoleic acid, α-linolenic acid, DHA and EPA, total PUFA( 35 ), cholesterol, SFA and free sugars( 7 ); from the French recommendations for fibre, ten vitamins and nine minerals( Reference Martin 36 ); and from the Nordic Nutrient Recommendations for Na( Reference Pietinen, Valsta and Hirvonen 37 ). The models were run separately for men and women since observed intakes and nutritional recommendations differ between genders.
Environmental constraint: reductions in greenhouse gas emissions
For each of the three scenarios of nutritional constraints, modelled diets were designed at increasingly stringent levels of GHGE reduction. The constraint imposing the total dietary GHGE reduction was gradually strengthened in 10 % steps, starting from no imposed reduction from the GHGE value of the mean observed diet up to the maximal reduction achievable.
Acceptability constraints
To avoid unrealistic modelled diets, the total food quantity was constrained to range between 80 % and 120 % of the mean observed intake (2920 g/d for men, 2581 g/d for women); the total energy had to be equal to the energy of the mean observed diet (10 916 kJ/d (2609 kcal/d) for men and 8109 kJ/d (1938 kcal/d) for women); and the food item, food group and food subgroup quantities were constrained to be lower than the 90th percentile of the observed intakes. The percentiles were calculated by gender, for consumers only in the case of food items and for the whole population in the case of food groups and subgroups.
Objective function
In order to translate the objective of remaining as close as possible to the observed diet, the objective function of the linear programming models was defined as the minimization of the total departure between the observed and modelled diets, at both the food item (n 402) and the food group (n 8; adapted from the food groups used for the French food-based dietary guidelines( Reference Hercberg, Chat-Yung and Chauliac 38 ): Meat/Fish/Eggs, Dairy Products, Fruit and Vegetables, Starch, Foods High in Fat/Salt/Sugar, Drinks, Seasonings, Mixed Dishes) levels. The objective function was expressed mathematically by:
 $$\eqalignno{ {\rm Minimize }\,\,f\,{\equals}\,{1 \over {402}}\mathop{\sum}\limits_{i{\equals}1}^{402} {ABS\left( {{{Q_{{{\mathop{\rm opt}\nolimits} ,i}} {\minus}Q_{{{\mathop{\rm obs}\nolimits} ,i}} } \over {Q_{{{\mathop{\rm obs}\nolimits} ,i}} }}} \right)} \cr{\plus}{1 \over 8}\mathop{\sum}\limits_{j{\equals}1}^8 {ABS\left( {{{Q_{{{\mathop{\rm opt}\nolimits} ,\,j}} {\minus}Q_{{{\mathop{\rm obs}\nolimits} ,\,j}} } \over {Q_{{{\mathop{\rm obs}\nolimits} ,\,j}} }}} \right)} ,$$
where i represents the 402 foods and j the eight food groups, ABS refers to absolute value, Q obs is the mean observed quantity and Q opt the optimized quantity.
The absolute function being non-linear, f was then transformed into a linear function, as previously described by Darmon et al. ( Reference Darmon, Ferguson and Briend 19 ), so that linear programming could be applied.
An alternative objective function minimizing the GHGE was used to assess the maximal GHGE reduction achievable for each scenario.
Strength of nutritional constraints
The dual value, calculated for each nutritional constraint as the improvement in the objective function when the constraint is relaxed by 1 %, enabled us to evaluate how restrictive the constraints were and to compare their strength. A non-zero dual value indicated that the corresponding constraint was restrictive, i.e. that fulfilling the constraint had an influence on food selection and thus on deviation from the observed diet. A null dual value indicated that the constraint was not restrictive. The higher the absolute dual value, the more difficult the constraint was to meet.
Nutritional quality assessment
The mean adequacy ratio (MAR), the mean excess ratio (MER) and the solid energy density (SED) were used to assess the nutritional quality of the observed and modelled diets, as previously described by Vieux et al. ( Reference Vieux, Soler and Touazi 14 ).
The MAR was calculated for each diet as the mean percentage of daily recommended intakes for twenty key nutrients (proteins, fibre, Ca, K, Fe, Mg, Zn, Cu, iodine, Se, vitamin A, vitamin C, vitamin D, vitamin E, thiamin, riboflavin, niacin, vitamin B6, folic acid and vitamin B12) by:
 $${\mathop{\rm MAR}\nolimits} \,{\equals}\,{1 \over {20}}\mathop{\sum}\limits_{{\mathop{\rm bn}\nolimits} {\equals}1}^{20} {{{Q_{{{\mathop{\rm bn}\nolimits} }} } \over {{\mathop{\rm RDA}\nolimits} _{{\rm bn}} }}} {\times}100,$$
where Q bn is the daily quantity of each beneficial nutrient (bn) and RDAbn is the corresponding recommended intake for this nutrient. The reference values for the twenty recommended nutrients are given in Table 1. Each ratio (Q bn/RDAbn×100)>100 was set to 100, so that a high intake of one nutrient could not compensate for the low intake of another( Reference Vieux, Soler and Touazi 14 ).
MER was calculated for each diet as the mean daily percentage of the maximum recommended values (MRV) for three nutrients to limit, namely SFA, Na and free sugars, by:
 $${\mathop{\rm MER}\nolimits} \,{\equals}\,\left( {{1 \over 3}\mathop{\sum}\limits_{\ln {\equals}1}^3 {{{Q_{{\ln }} } \over {{\mathop{\rm MRV}\nolimits} _{{\ln }} }}{\times}100} } \right){\minus}100,$$
where Q ln is the daily quantity of each nutrient to limit (ln) and MRVln is the corresponding maximum recommended value for this nutrient (Table 1). The term ‘free sugars’ refers to added sugars plus sugars naturally present in honey, syrups and fruit juices( 7 ). The MRV for SFA and free sugars corresponded to 10 % of the energy of the mean observed diet. The MRV for Na was 2759 and 2365 mg for men and women, respectively, and corresponded to a daily intake of 7 and 6 g NaCl. Each ratio (Q ln/MRVln×100) <100 was set to 100, so that a low intake of one harmful nutrient could not compensate for the high intake of another.
The SED, expressed in kcal/100 g (1 kcal=4·184 kJ), was calculated as the ratio between energy intake and diet weight. As proposed by Ledikwe et al.( Reference Ledikwe, Blanck and Khan 39 ), only items typically consumed as foods, including soups, were included in the calculation of SED, whereas foods typically consumed as beverages, such as milk, juices and other drinks, were excluded.
Acceptability assessment
The dimension of acceptability was assessed by analysing the changes of quantity (g/d) occurring for each food group and subgroup, and by calculating the percentage of departure from food quantities in the population’s mean observed diet. It was assumed that diets similar, in terms of food composition, to the mean observed diet could be considered as culturally acceptable, with the greatest departure from the observed diet having the highest risk of lower cultural acceptability. The absolute departure was calculated both at the food item level, corresponding to the first term of the objective function, and at the food group level, corresponding to the second term of the objective function.
Diet cost assessment
Diet cost was estimated based on food prices obtained from the 2006 Kantar Worldpanel purchase database( 40 ), which gives the annual expenditure and the quantity purchased for each food item available on the market in a representative sample of 12000 French households. The mean national prices of the 402 food items were calculated by dividing annual expenditures by the quantities purchased, as previously described by Masset et al. ( Reference Masset, Vieux and Verger 15 ), and are representative of the most frequently purchased form of each item.
Results
The GHGE of the mean observed diet were 3667 g eqCO2/d and 4896 g eqCO2/d for women and men, respectively. The maximal GHGE reductions from these observed levels achievable under the constraints were 82·6 %, 82·2 % and 69·7 % reduction for women, and 81·9 %, 79·9 % and 74·0 % reduction for men, for the FREE, MACRO and ADEQ scenarios, respectively.
Results of the diets modelled by linear programming are detailed below for women’s models only. Results obtained for men’s models are presented in the online supplementary material, Supplemental Table 2 and Supplemental Figs 1–3.
Impact of reduction in greenhouse gas emissions on nutritional quality
The MAR, MER and SED of the observed and modelled diets are presented in Fig. 1(a) to 1(c).
In the mean observed diet, the MAR, MER and SED were 89·9 %, 20·7 % and 162 kcal/100 g (678 kJ/100 g), respectively. Thirteen nutrients had a content below 100 % of the RDA, with fibre, vitamin D and Fe contents in particular covering less than 80 % of the RDA (Table 2). SFA and Na contents exceeded the recommended upper limits.

Fig. 1 (a) Mean adequacy ratio (MAR), (b) mean excess ratio (MER), (c) solid energy density (SED), (d) diet cost, (e) mean departure from the observed diet at food level and (f) mean departure from the observed diet at food group level, for the mean observed diet (![]() ) and for modelled diets at different levels of dietary GHGE reduction under the FREE (
) and for modelled diets at different levels of dietary GHGE reduction under the FREE (![]() ), MACRO (
), MACRO (![]() ) and ADEQ (
) and ADEQ (![]() ) scenario, for French women (GHGE, greenhouse gas emissions; FREE; no nutritional constraints; MACRO, constraints on macronutrients only; ADEQ, constraints on all nutrients; minFREE, maximal GHGE reduction (82·6 %) achievable under the constraints of the FREE scenario; minMACRO, maximal GHGE reduction (82·2 %) achievable under the constraints of the MACRO scenario; minADEQ, maximal GHGE reduction (69·7 %) achievable under the constraints of the ADEQ scenario; 1 kcal=4·184 kJ)
) scenario, for French women (GHGE, greenhouse gas emissions; FREE; no nutritional constraints; MACRO, constraints on macronutrients only; ADEQ, constraints on all nutrients; minFREE, maximal GHGE reduction (82·6 %) achievable under the constraints of the FREE scenario; minMACRO, maximal GHGE reduction (82·2 %) achievable under the constraints of the MACRO scenario; minADEQ, maximal GHGE reduction (69·7 %) achievable under the constraints of the ADEQ scenario; 1 kcal=4·184 kJ)
Table 2 Nutrient levels (percentage of the RDA or percentage of the upper limit) in the mean observed diet and in the FREE, MACRO and ADEQ modelled diets at different levels of GHGE reduction from the value of the mean observed diet for French women
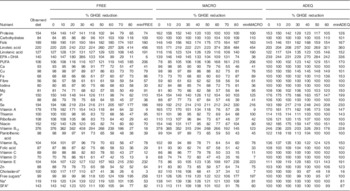
FREE; no nutritional constraints; MACRO, constraints on macronutrients only; ADEQ, constraints on all nutrients; GHGE, greenhouse gas emissions; minFREE, maximal GHGE reduction (82·6 %) achievable under the constraints of the FREE scenario; minMACRO, maximal GHGE reduction (82·2 %) achievable under the constraints of the MACRO scenario; minADEQ, maximal GHGE reduction (69·7 %) achievable under the constraints of the ADEQ scenario.
Results are percentage of the RDA unless otherwise stated.
* Percentage of the upper limit.
In the FREE scenario, the MAR and SED of the modelled diets remained similar to those of the mean observed diet for moderate GHGE reductions (≤30 %). Strengthening the GHGE constraint for reductions higher than 30 % induced a progressive decrease in the MAR and an increase in the SED.
In the MACRO scenario, adding constraints on macronutrients with no imposed reduction of GHGE did not affect the MAR or SED, but increased the MER, when compared with the mean observed diet. When imposing the GHGE constraint, the modelled diets had a similar MAR and SED as in the FREE scenario, whatever the GHGE reductions. For moderate GHGE reductions (≤30 %), the MER of MACRO models were higher than for diets modelled under the FREE scenario (Fig. 1(b)). Strengthening the GHGE reduction tended to reduce the MER.
In the ADEQ scenario, the nutritional constraints ensured that the MAR reached 100 % and the MER 0 %. The nutritional constraints also induced a reduction of SED compared with both the observed diet and the diets modelled under the FREE and MACRO scenarios. This reduction of the SED reflects an increase in total diet weight induced by the set of nutritional constraints. Imposing GHGE reductions up to 30 % did not induce any additional modifications of the SED, but higher GHGE reductions required decreasing the total diet weight, and thus increasing the SED.
Impact of reduction in greenhouse gas emissions on diet composition
The food group quantities of each modelled diet are presented in Fig. 2. In the FREE and MACRO scenarios (Fig. 2(a) and 2(b)), food group quantities did not deviate from those of the mean observed diet for moderate GHGE reductions (≤30 %). Reductions ranging from 30 to 60 % induced a progressive decrease in the Meat/Fish/Eggs (MFE) group quantities. Higher GHGE reductions (≥60 %) required additional food group modifications, namely an increase of the Starch group quantities and a reduction in quantities of the Fruits and Vegetables (FV) and Dairy Products (Dairy) groups. The Seasonings and Foods High in Fat/Salt/Sugar (HFSS) groups did not deviate from their quantity in the mean observed diet, whatever the strength of the GHGE constraint.

Fig. 2 Food group quantities (g/d) in the mean observed diet and at different levels of dietary GHGE reduction from the value of the mean observed diet under the FREE (a), MACRO (b) and ADEQ (c) modelled diets for French women (GHGE, greenhouse gas emissions; FREE; no nutritional constraints; MACRO, constraints on macronutrients only; ADEQ, constraints on all nutrients; FV, Fruits and Vegetables; Dairy, Dairy Products; HFSS, Foods High in Fat/Sugar/Salt; MFE, Meat/Fish/Eggs; minFREE, maximal GHGE reduction (82·6 %) achievable under the constraints of the FREE scenario; minMACRO, maximal GHGE reduction (82·2 %) achievable under the constraints of the MACRO scenario; minADEQ, maximal GHGE reduction (69·7 %) achievable under the constraints of the ADEQ scenario)
In the ADEQ scenario, respecting the set of nutritional constraints with no imposed reduction of GHGE increased the FV quantity up to approximately 500 g/d (Fig. 2(c)). This was explained mainly by an increase in fruit quantity (+57 % from the quantity in the observed diet), as shown in Fig. 3(a) presenting the food subgroup quantities. Adding a GHGE constraint up to 40 % reduction did not require any additional changes in food group quantities, except progressively larger decreases in MFE quantities for reductions ≥20 %. However, other substitutions occurred within food groups (Fig. 3). Within the Dairy food group (Fig. 3(c)), cheese was reduced by almost 50 % from its quantity in the observed diet, in favour of milk. Within the Mixed Dishes food group (Fig. 3(e)), mixed dishes containing animal products were approximately halved in favour of plant-based mixed dishes. Within the MFE food group (Fig. 3(f)), deli and ruminant meats were substituted by the fish subgroup. GHGE reductions higher than 40 % were associated with further decrease in the MFE quantities (suppression of ruminant meat and progressive decrease of the pork, poultry and eggs (PPE) subgroup) together with additional changes at the food group level: the Mixed Dishes group quantity decreased (both animal- and plant-based subgroups) and the Starch group quantity increased (mainly higher quantities of grains and potatoes; Fig. 3(b)). Quantity of the HFSS group remained equal to its levels in the observed diet whatever the GHGE reduction.

Fig. 3 Departure from subgroup quantities in the observed diet (%) for the ADEQ scenario at different levels of dietary GHGE reduction (% GHGE reduction: ![]() , 0;
, 0; ![]() , 10;
, 10; ![]() , 20;
, 20; ![]() , 30;
, 30; ![]() , 40;
, 40; ![]() , 50;
, 50; ![]() , 60;
, 60; ![]() , min) for French women, according to food group: (a) Fruits and Vegetables; (b) Starch; (c) Dairy Products; (d) Foods High in Fat/Sugar/Salt; (e) Mixed Dishes; (f) Meat/Fish/Eggs; (g) Seasonings; (h) Drinks (ADEQ, constraints on all nutrients; GHGE, greenhouse gas emissions; min: maximal GHGE reduction (69·7 %) achievable under the constraints of the ADEQ scenario; PPE, pork, poultry and eggs)
, min) for French women, according to food group: (a) Fruits and Vegetables; (b) Starch; (c) Dairy Products; (d) Foods High in Fat/Sugar/Salt; (e) Mixed Dishes; (f) Meat/Fish/Eggs; (g) Seasonings; (h) Drinks (ADEQ, constraints on all nutrients; GHGE, greenhouse gas emissions; min: maximal GHGE reduction (69·7 %) achievable under the constraints of the ADEQ scenario; PPE, pork, poultry and eggs)
Impact of reduction in greenhouse gas emissions on acceptability
In terms of acceptability, the absolute departure from the mean observed diet remained very low for moderate GHGE reductions in the FREE and MACRO scenarios. In the ADEQ scenario, imposing the set of nutritional constraints with no imposed reduction of GHGE induced a departure of approximately 30 % from the observed diet at the food level and of 5 % at the food group level (Fig. 1(e) and 1(f)). For moderate GHGE reductions (≤30 %), the absolute departure remained close to these values. Higher GHGE reductions (>30 %) increased departure from the observed diet significantly.
Impact of reduction in greenhouse gas emissions on diet cost
The cost of the mean observed diet was 6·4 €/d (Fig. 1(d)). The cost of the diets modelled under the FREE and MACRO scenarios were similar to or lower than the cost of the mean observed diet. Under those scenarios, strengthening the GHGE constraint tended to reduce diet cost.
Imposing the nutritional constraints of the ADEQ scenario slightly increased the cost of the diet. High GHGE reductions (≥50 %) decreased diet cost.
Minimization of greenhouse gas emissions
Changing the objective function for a minimization of GHGE induced dramatic changes in terms of diet composition (Figs 2 and 3). Minimizing the GHGE induced elimination of the Dairy group for both FREE and MACRO scenarios (Fig. 2(a) and 2(b)). Without any nutritional constraints (FREE scenario), the MFE and Mixed Dishes groups were also eliminated, while FV was reduced to less than 6 g/d, leading to a modelled diet composed mainly of three food groups: HFSS, Starch and Seasonings, with almost half of the energy provided by HFSS. In the ADEQ scenario, minimizing the GHGE did not suppress any food category, but induced reductions of the FV quantity down to 245 g/d and of MFE down to 35 g/d.
Strength of nutritional constraints
The comparative strength of each nutritional constraint was evaluated through the analysis of dual values (data not shown). In the MACRO scenario, the most difficult constraint to meet was the minimum energy contribution of carbohydrates (≥50 %) for GHGE reductions ≤50 % and of proteins (≥10 %) for highest GHGE reductions. In the ADEQ scenario, the minimum quantity of fibre (>30 g) was the most difficult constraint to meet. Respecting the upper limit of Na (<2365 mg) was also constraining, especially for GHGE reductions <40 %. Strengthening of the GHGE constraint increased the difficulty in meeting the recommendations for Ca and K. These two recommendations were the most difficult to meet, followed by fibre, when GHGE was minimized.
The main impacts of GHGE reductions on the nutritional quality, diet composition and diet cost observed for women were similar for men’s models. These are presented in the online supplementary material, Supplemental Table 2 and Supplemental Figs 1–3.
Discussion
Based on three nationally representative French data sets, namely on dietary intakes, food prices and food GHGE, the present study shows that diet-related GHGE may be reduced by 30 % while reaching nutritional adequacy without requiring major additional dietary shifts, at the food group level, than those induced by meeting nutritional recommendations, and at a similar cost. Combining cultural acceptability and nutritional adequacy at higher GHGE reductions (>30 %) was not achievable. Such GHGE reductions either impaired nutritional quality, even when recommendations on macronutrients were imposed, or required non-trivial dietary shifts compromising acceptability to reach nutritional adequacy.
By modelling diets at increasingly stringent levels of nutritional constraints, the present study shows that the nutritional dimension of diet sustainability should not be overlooked when acting on GHGE mitigation. Imposing constraints on macronutrients only (proteins, lipids and carbohydrates) did not ensure nutritional adequacy any better than with no nutritional constraint, and even impaired it: the MER actually increased for moderate GHGE reductions (≤30 %), indicating higher quantities of nutrients to be limited, namely free sugars and Na. Imposing higher GHGE reductions (>30 %) without stringent nutritional constraints decreased the MAR, indicating a diet with lower quantities of beneficial nutrients. Hence in the absence of constraints imposing nutritional adequacy, nutritional quality was impaired by GHGE reduction. These results highlight the need to consider the nutritional dimension through appropriate indicators when investigating alternative diets with lower environmental impact.
By modelling diets minimizing the GHGE, the present study showed that the maximal GHGE reduction achievable from the observed level, while respecting all the nutritional recommendations, was 69·7 % for women and 74·0 % for men. A similar level of GHGE reduction (70 %) was investigated by Audsley et al. through a combination of mitigation measures from different sectors( Reference Audsley, Brander and Chatterton 6 ). Sáez-Almendros et al. also suggested that a shift towards a Mediterranean diet would result in a 72 % reduction of the Spanish GHGE( Reference Sáez-Almendros, Obrador and Bach-Faig 41 ), but this required extreme energy restrictions. Our results showed that reaching the maximal reductions of 69·7 % and 74·0 % without energy restrictions required extreme food pattern changes and departure from the observed diet, thus compromising the acceptability of such alternative diets. The model could not identify a combination of foods respecting all the constraints for higher GHGE reductions (>70 %), indicating that nutritional adequacy could not be reached with habitual food items for such a level of GHGE reduction. The nutrients for which needs were the most difficult to fulfil for high GHGE reductions were fibre, Ca and K.
By modelling diets at increasingly stringent levels of nutritional and GHGE constraints, the present study reveals that moderate GHGE reductions did not require any dietary shifts at the food group level additional to those induced by meeting nutritional recommendations, i.e. mainly an increase in fruits and vegetables. This indicates that adopting a nutritionally adequate diet could be coupled to moderate GHGE reductions, and thus would benefit both the environmental and the nutritional dimensions of diet sustainability. However, reaching nutritional adequacy at higher GHGE reductions required further dietary shifts, namely a reduction of foods of animal origin (except fish products), and especially deli and ruminant meats, from 20 % GHGE reduction. The progressive reduction of meat products when the GHGE constraint was strengthened confirmed the role of animal-based foods as the main levers to reduce diet-related GHGE( Reference Stehfest, Bouwman and van Vuuren 5 , Reference McMichael, Powles and Butler 42 , 43 ). GHGE reductions higher than 40 % required an increase in quantity of the starchy food group, which was the main component (approximately one-third of the total energy) of the nutritionally adequate diet minimized on GHGE. Moreover, without adequate constraints on micronutrients, high GHGE reductions resulted in the elimination of some food groups, namely Dairy and MFE. Conversely, all food groups were represented in nutritionally adequate diets with reduced GHGE (ADEQ), even when GHGE were minimized. Hence while vegetarian or vegan diets are often claimed to reduce the environmental impact of diet, the results of the present study suggest that food group diversity must be preserved to improve diet sustainability, rather than drastic dietary changes excluding food categories. Previous studies have estimated that shifting from the average diet to a vegetarian diet would reduce GHGE by 22 % in the UK( Reference Berners-Lee, Hoolohan and Cammack 44 ) or 27 % in Denmark( Reference Saxe, Larsen and Mogensen 45 ). However, the realism of such scenarios is questionable since the prevalence of vegetarianism is quite low in industrialized countries (e.g. estimated to be approximately 2 % in the French( Reference Leblanc, Yoon and Kombadjian 46 ) and US( Reference Craig and Mangels 47 ) populations). In addition, some studies suggest that a large proportion of the population is not yet ready to consume a fully plant-based diet( Reference Lea, Crawford and Worsley 48 , Reference Vanhonacker, Van Loo and Gellynck 49 ). According to the present results, 30 % GHGE reduction could be achieved in a nutritionally adequate diet by increasing fruits and vegetables while maintaining intake of meat/fish/eggs at approximately 100 g/d, mainly by substituting ruminant and deli meats by fish products.
The main strength of the present study was taking into account simultaneously several dimensions of diet sustainability, namely nutritional adequacy, environmental impact, affordability and cultural acceptability. The latter was considered by minimizing the departure from the observed diet and through constraints applied on food quantities based on the most recent dietary survey conducted in the French population. Also, whereas previous diet modelling studies were based on eighty-two foods in the UK( Reference Macdiarmid, Kyle and Horgan 22 ) and seventy-six foods items in New Zealand( Reference Wilson, Nghiem and Ni Mhurchu 23 ), the diets modelled in the present study were based on consumption, nutritional composition, GHGE and price of 402 foods identified among those most consumed by the INCA2 participants and representing the consumption of the 1342 foods declared in the national survey.
A further strength of the study was the reliability of the environmental data. Whereas most of the studies assessing the environmental impact of diet are based on environmental data compiled from heterogeneous studies conducted under different LCA modelling hypotheses or specific in terms of geographical situation or production modes, the present study was based on GHGE data built from a hybrid input–output/LCA standardized method applied to the 402 food items, thus ensuring reliably sourced data representative of national food consumption and production modes( Reference Bertoluci, Masset and Gomy 32 ).
However, a limitation of the present study was that nutritional adequacy may have been compromised by varying bioavailability of some key nutrients for which animal sources are known to be more favourable( 50 – Reference Haddad, Berk and Kettering 52 ). In this context, Fe has been highlighted as of particular concern since animal products are the only source of haem Fe, the most bioavailable source of Fe. Hence further improvements of the models could be achieved by taking the bioavailability of such nutrients into account. Also, other indicators of the environmental impact of diet should be considered. Food production has been shown to account for most of the global water footprint( Reference Vanham, Mekonnen and Hoekstra 53 ) and agricultural production, being an integral part of many ecosystems, can restrict or promote their biodiversity, resilience and socio-economic functions. In particular, biodiversity is of great concern in fish production. Future modelling studies could thus benefit from including additional environmental indicators, but the main obstacles to such improvements are the limited availability and access to data at the food level. This study could also be further improved by using an individual diet modelling approach to integrate individual food preferences. Moreover, in our study, acceptability was taken into account by minimizing the departure from the observed diet in terms of food and food group contents, in order to limit the deterioration of cultural acceptability induced by the modelling. However, such method cannot guarantee that the proposed shift modelled by the linear programming would be acceptable to the consumer. In particular, it is a strong, and perhaps unjustified, assumption that departing the least from the mean diet, in terms of food groups defined on a nutritional basis rather than on practical and/or monetary ones, will be more acceptable to the consumer. Some recent modelling studies considered the acceptability dimension by introducing price elasticity and food expenditure shares in the model to better control the level and type of deviation from current diet( Reference Milner, Green and Dangour 54 ). However, incorporating information on consumer behaviour still does not necessarily ensure that dietary scenarios would be fully acceptable( Reference Macdiarmid, Douglas and Campbell 55 ). This emphasizes the importance of coupling the identification of more sustainable diets with studies on interventions and tools aimed at favouring their adoption by consumers in real life.
Conclusion
The current modelling study highlights the need to consider the nutritional dimension through relevant indicators when assessing how to improve diet sustainability. It also shows that nutritional adequacy, cultural acceptability and affordability of the diet may not be compatible with GHGE reductions higher than 30 %. This underlines the limits of the food consumption shift strategy to reduce GHGE and emphasizes that reaching GHGE reduction targets requires to combine mitigation approaches from different sectors, including production efficiency, demand restraint and food system transformation( Reference Garnett 56 ).
Acknowledgements
Financial support: M.P. was supported by the Daniel & Nina Carasso Foundation under the Avasun project; G.M. was supported by the French National Research Agency under the OCAD project (ANR-11-ALID-0002) and by the Daniel & Nina Carasso Foundation under the Avasun project; GF was supported by the French National Research Agency under the Medina project (ANR-12-TMED-0004); T.B. was financially supported by the SPSA (Science des Procédés et des Aliments) graduate school. The funders had no role in the design, analysis or writing of this article. Conflict of interest: None. Authorship: M.P. and G.M. contributed equally to this work. N.D., M.P., G.M., M.-J.A. and G.F. designed and conducted the research and wrote the manuscript; G.F., T.B., M.P., F.V. and M.M. analysed the data; and N.D. had primary responsibility for the final content. All authors read and approved the final manuscript. Ethics of human subject participation: Not applicable.
Supplementary material
To view supplementary material for this article, please visit http://dx.doi.org/10.1017/S1368980016000653


 Open access