


1 Introduction
Liquid-fuel spray combustion is widely used in combustion engines. Reduction of carbon dioxide ( $\text{CO}_{2}$
) emissions of engines is critical to solving global environmental issues. One of the approaches for such purposes is to use fuels in a blended form, such as a blend of fossil fuels and biofuels (Agarwal Reference Agarwal2007; Kohse-Höinghaus et al.
Reference Kohse-Höinghaus, Oßwald, Cool, Kasper, Hansen, Qi, Westbrook and Westmoreland2010; Shahir et al.
Reference Shahir, Masjuki, Kalam, Imran, Rizwanul Fattah and Sanjid2014), to maximise the benefits of each component fuel. In using such fuel blends, differences in physical properties may induce more complex fluid dynamic issues. Heating, evaporation, mixing and combustion will be all affected, and a thorough understanding is needed to fully utilise the benefits of such fuel blends.
$\text{CO}_{2}$
) emissions of engines is critical to solving global environmental issues. One of the approaches for such purposes is to use fuels in a blended form, such as a blend of fossil fuels and biofuels (Agarwal Reference Agarwal2007; Kohse-Höinghaus et al.
Reference Kohse-Höinghaus, Oßwald, Cool, Kasper, Hansen, Qi, Westbrook and Westmoreland2010; Shahir et al.
Reference Shahir, Masjuki, Kalam, Imran, Rizwanul Fattah and Sanjid2014), to maximise the benefits of each component fuel. In using such fuel blends, differences in physical properties may induce more complex fluid dynamic issues. Heating, evaporation, mixing and combustion will be all affected, and a thorough understanding is needed to fully utilise the benefits of such fuel blends.
In this study, addition of bioethanol to fossil oil is considered. Ethanol ( $\text{C}_{2}\text{H}_{5}\text{OH}$
) is oxygenated, i.e. an ethanol molecule contains an oxygen atom, which enhances the oxidation of carbon, thereby reducing particulate matter (PM). However, ethanol is not well miscible with oil (Shahir et al.
Reference Shahir, Masjuki, Kalam, Imran, Rizwanul Fattah and Sanjid2014). With the help of a surfactant, it can be stabilised in a form of emulsion. Several experimental attempts have been conducted to demonstrate the usefulness of blended fuels. For example, for diesel/biodiesel/bioethanol emulsion mixture, the overall engine performance has been demonstrated (Satgé de Caro et al.
Reference Satgé de Caro, Mouloungui, Vaitilingom and Berge2001; Hansen, Zhang & Lyne Reference Hansen, Zhang and Lyne2005; Rajasekar et al.
Reference Rajasekar, Murugesan, Subramanian and Nedunchezhian2010; Hulwan & Joshi Reference Hulwan and Joshi2011; Pidol et al.
Reference Pidol, Lecointe, Starck and Jeuland2012). However, the quantitative assessment sometimes tends to be combustor-specific. There have also been studies on fundamental droplet and spray processes such as evaporation, mixing and combustion of several oil/alcohol blends (Yang, Jackson & Avedisian Reference Yang, Jackson and Avedisian1990; Jackson & Avedisian Reference Jackson and Avedisian1998; Botero et al.
Reference Botero, Huang, Zhu, Molina and Law2012; Moon et al.
Reference Moon, Tsujimura, Oguma, Chen, Huang and Saitou2013; Pan & Chiu Reference Pan and Chiu2013). Under certain conditions, microexplosion was observed. In these studies, the puffing and microexplosion dynamics was revealed and its impact on the mixing between the fuel vapour and the air was discussed. In experiments, however, detailed vapour field data are not easy to obtain. Therefore, the physical mechanisms of puffing effects on fuel/air mixing of emulsion fuel droplets remain unknown. This fact has motivated the present simulation study.
$\text{C}_{2}\text{H}_{5}\text{OH}$
) is oxygenated, i.e. an ethanol molecule contains an oxygen atom, which enhances the oxidation of carbon, thereby reducing particulate matter (PM). However, ethanol is not well miscible with oil (Shahir et al.
Reference Shahir, Masjuki, Kalam, Imran, Rizwanul Fattah and Sanjid2014). With the help of a surfactant, it can be stabilised in a form of emulsion. Several experimental attempts have been conducted to demonstrate the usefulness of blended fuels. For example, for diesel/biodiesel/bioethanol emulsion mixture, the overall engine performance has been demonstrated (Satgé de Caro et al.
Reference Satgé de Caro, Mouloungui, Vaitilingom and Berge2001; Hansen, Zhang & Lyne Reference Hansen, Zhang and Lyne2005; Rajasekar et al.
Reference Rajasekar, Murugesan, Subramanian and Nedunchezhian2010; Hulwan & Joshi Reference Hulwan and Joshi2011; Pidol et al.
Reference Pidol, Lecointe, Starck and Jeuland2012). However, the quantitative assessment sometimes tends to be combustor-specific. There have also been studies on fundamental droplet and spray processes such as evaporation, mixing and combustion of several oil/alcohol blends (Yang, Jackson & Avedisian Reference Yang, Jackson and Avedisian1990; Jackson & Avedisian Reference Jackson and Avedisian1998; Botero et al.
Reference Botero, Huang, Zhu, Molina and Law2012; Moon et al.
Reference Moon, Tsujimura, Oguma, Chen, Huang and Saitou2013; Pan & Chiu Reference Pan and Chiu2013). Under certain conditions, microexplosion was observed. In these studies, the puffing and microexplosion dynamics was revealed and its impact on the mixing between the fuel vapour and the air was discussed. In experiments, however, detailed vapour field data are not easy to obtain. Therefore, the physical mechanisms of puffing effects on fuel/air mixing of emulsion fuel droplets remain unknown. This fact has motivated the present simulation study.
When the ethanol proportion becomes high, puffing or microexplosion will occur. Puffing is occasional ejection of boiled ethanol vapour from inside the parent diesel droplet. If the rapidly growing vapour bubble violently breaks up the parent droplet, it is usually termed as microexplosion. Puffing and microexplosion are physical processes that deserve special attention (Yang, Jackson & Avedisian Reference Yang, Jackson and Avedisian1990; Jackson & Avedisian Reference Jackson and Avedisian1998). Puffing and microexplosion are particular to blended-fuel droplets, and are caused by distinct differences in physical properties, such as boiling temperature and superheat limit (Avedisian & Glassman Reference Avedisian and Glassman1981; Avedisian & Sullivan Reference Avedisian and Sullivan1984). Since puffing can break up an emulsion droplet, it enhances secondary breakup or atomisation. When it occurs, the local equivalence ratio of the reactive gas is unsteadily varied due to the ejected ethanol vapour. If puffing can be properly utilised in a blended-fuel spray, it may enhance fuel atomisation and fuel/air mixing. Therefore, it is important to better understand puffing and its effect on fuel/air mixing. In a combustor, it is generally expected that puffing (or partial microexplosion) is more likely than complete microexplosion, since the heating time for spray droplets is limited (Watanabe & Okazaki Reference Watanabe and Okazaki2013; Shinjo et al. Reference Shinjo, Xia, Ganippa and Megaritis2014).
Figure 1 exemplifies the significance of puffing on fuel/air mixing and combustion. This figure shows photographs taken at different time instants in an experiment on diesel/biodiesel/bioethanol emulsion droplet combustion conducted by our research group (Avulapati et al.
Reference Avulapati, Ganippa, Xia and Megaritis2016). The blend composition was 50 % diesel, 40 % biodiesel (rapeseed oil methyl ester; RME) and 10 % bioethanol. A droplet of diameter $D=2~\text{mm}$
was used to enable visualisation. As shown in the images, the droplet (the transparent sphere indicated in figure 1
a) was anchored on a thermocouple fibre, and ignition was achieved by a hot electric coil (the bright illuminated spot shown in figure 1
a) on the right-hand side of the droplet. It was confirmed that the ratio of ethanol plays an important role in the flame characteristics. When the ratio of ethanol was low (
$D=2~\text{mm}$
was used to enable visualisation. As shown in the images, the droplet (the transparent sphere indicated in figure 1
a) was anchored on a thermocouple fibre, and ignition was achieved by a hot electric coil (the bright illuminated spot shown in figure 1
a) on the right-hand side of the droplet. It was confirmed that the ratio of ethanol plays an important role in the flame characteristics. When the ratio of ethanol was low ( ${\sim}5\,\%$
), smooth burning was observed. As the ratio of ethanol was raised, puffing was occasionally observed, as shown in figure 1(b). The additional bright flame region on the upper-left side of the droplet indicates that ethanol vapour was ejected and the local equivalence ratio became temporarily high. Puffing was repeated during the droplet lifetime. Similar results have been reported in Yang, Jackson & Avedisian (Reference Yang, Jackson and Avedisian1990), Jackson & Avedisian (Reference Jackson and Avedisian1998), Botero et al. (Reference Botero, Huang, Zhu, Molina and Law2012) and Pan & Chiu (Reference Pan and Chiu2013). These results indicate that puffing can affect the gaseous fuel-vapour/air mixture around the droplet transiently and non-uniformly, thereby impacting on the droplet combustion characteristics. A further understanding of puffing and its effects on mixing is therefore needed.
${\sim}5\,\%$
), smooth burning was observed. As the ratio of ethanol was raised, puffing was occasionally observed, as shown in figure 1(b). The additional bright flame region on the upper-left side of the droplet indicates that ethanol vapour was ejected and the local equivalence ratio became temporarily high. Puffing was repeated during the droplet lifetime. Similar results have been reported in Yang, Jackson & Avedisian (Reference Yang, Jackson and Avedisian1990), Jackson & Avedisian (Reference Jackson and Avedisian1998), Botero et al. (Reference Botero, Huang, Zhu, Molina and Law2012) and Pan & Chiu (Reference Pan and Chiu2013). These results indicate that puffing can affect the gaseous fuel-vapour/air mixture around the droplet transiently and non-uniformly, thereby impacting on the droplet combustion characteristics. A further understanding of puffing and its effects on mixing is therefore needed.

Figure 1. Burning experiment on a single diesel/biodiesel/bioethanol droplet (Avulapati et al. Reference Avulapati, Ganippa, Xia and Megaritis2016). During the droplet lifetime (a) and (b) are repeated in turn. (a) Smooth burning between puffing. (b) Puffing-induced burning.
If multiple droplets exist in the vicinity, puffing may affect the mode of droplet group combustion, which is also important for spray combustion in the dense and transitional spray regimes. Depending on the inter-droplet distance, the combustion mode changes from the single-droplet combustion mode to the group combustion mode (Chiu, Kim & Croke Reference Chiu, Kim and Croke1982; Umemura Reference Umemura1994). A diagram for group combustion was proposed by Chiu, Kim & Croke (Reference Chiu, Kim and Croke1982), where four modes were identified, namely single-droplet combustion, internal group combustion, external group combustion and external sheath combustion. The group combustion mode is determined by the mixing of the oxidiser with the fuel vapour, because a flame is formed around the stoichiometric gas mixture. The original concept assumed no flow convection, and the inter-droplet distance was of primary importance. Later, Umemura (Reference Umemura1990) and Umemura & Li (Reference Umemura and Li1992) extended the group combustion concept to include the gas convection effect. As the droplet Reynolds number ( $Re$
) rises, the stoichiometric surface is dragged towards the wake direction. Wu & Sirignano (Reference Wu and Sirignano2011a
) investigated the group combustion characteristics using direct numerical simulation (DNS), with the inter-droplet distance in the transverse direction fixed at
$Re$
) rises, the stoichiometric surface is dragged towards the wake direction. Wu & Sirignano (Reference Wu and Sirignano2011a
) investigated the group combustion characteristics using direct numerical simulation (DNS), with the inter-droplet distance in the transverse direction fixed at $l=2.4D$
(
$l=2.4D$
( $D=50~{\rm\mu}\text{m}$
). For
$D=50~{\rm\mu}\text{m}$
). For $Re=5.5$
, a large group flame was formed, while for
$Re=5.5$
, a large group flame was formed, while for $Re>13$
, separate flames were formed around each droplet and not grouped in the transverse direction. This indicates that not only the geometrical distances between the droplets but also the convective flow conditions are important for group combustion (Imaoka & Sirignano Reference Imaoka and Sirignano2005; Wu & Sirignano Reference Wu and Sirignano2011a
,Reference Wu and Sirignano
b
; Zoby et al.
Reference Zoby, Navarro-Martinez, Kronenburg and Marquis2011b
; Sirignano Reference Sirignano2014). Puffing will further complicate the group combustion dynamics due to the ejection of boiled ethanol vapour (a secondary fuel) from the parent diesel droplet, which produces primary diesel fuel vapour through normal evaporation. This may temporarily change the droplet grouping characteristics. Therefore, it is interesting and important to investigate the puffing effects on mixing not only in a single droplet but also in a multiple-droplet configuration. It should also be mentioned that the reactive gas mixture under puffing would be different for the two case scenarios where a droplet in a group is already in the wake of other droplets or the droplet is located in front of other droplets (Sirignano Reference Sirignano2014).
$Re>13$
, separate flames were formed around each droplet and not grouped in the transverse direction. This indicates that not only the geometrical distances between the droplets but also the convective flow conditions are important for group combustion (Imaoka & Sirignano Reference Imaoka and Sirignano2005; Wu & Sirignano Reference Wu and Sirignano2011a
,Reference Wu and Sirignano
b
; Zoby et al.
Reference Zoby, Navarro-Martinez, Kronenburg and Marquis2011b
; Sirignano Reference Sirignano2014). Puffing will further complicate the group combustion dynamics due to the ejection of boiled ethanol vapour (a secondary fuel) from the parent diesel droplet, which produces primary diesel fuel vapour through normal evaporation. This may temporarily change the droplet grouping characteristics. Therefore, it is interesting and important to investigate the puffing effects on mixing not only in a single droplet but also in a multiple-droplet configuration. It should also be mentioned that the reactive gas mixture under puffing would be different for the two case scenarios where a droplet in a group is already in the wake of other droplets or the droplet is located in front of other droplets (Sirignano Reference Sirignano2014).
The main objective of the present study is to improve the understanding of puffing effects on fuel/air mixing of blended emulsion in the configurations of both a single droplet and a droplet group under realistic convective heating conditions. As described above, the puffing mode is mainly targeted to link the results to a spray in a combustor. Direct numerical simulation is used to fully resolve the evaporating, puffing and mixing dynamics of the interfacial multiphase flow. Combustion is not included in this study; it will be extended to combustion cases in the future. Decane is used as a surrogate fuel. Namely, ethanol-in-decane emulsion is considered. The boiling point temperature of decane is substantially higher than the boiling point temperature and superheat limit of ethanol, which makes the numerical set-up suitable for the study of puffing and mixing dynamics. This setting does not limit the applicability of the present results to this particular fuel combination, rather they could represent characteristics for blends of ethanol and similar hydrocarbon fuels whose boiling point temperature is higher than the boiling point temperature and superheat limit of ethanol. Results are mostly discussed from the viewpoint of the physics of fluid dynamics. It should also be pointed out that using decane, the observed phenomena were similar in our experiments (Avulapati et al. Reference Avulapati, Ganippa, Xia and Megaritis2016).
The present study has taken advantage of the research outcome of our previous studies. In Shinjo et al. (Reference Shinjo, Xia, Ganippa and Megaritis2014), the droplet breakup dynamics due to puffing and microexplosion was directly simulated under quiescent ambient conditions, although the convective effect on heating and vapour mixing was not included in the first-stage work, where understanding the puffing dynamics was the research aim. In Shinjo et al. (Reference Shinjo, Xia, Megaritis, Ganippa and Cracknell2016), convective heating of an emulsion droplet prior to puffing and microexplosion was investigated. A model was proposed to approximate the temperature distribution inside an emulsion droplet under convective heating. It should be pointed out that the temperature distribution inside a parent droplet largely determines the bubble initiation location – an important initial condition for puffing simulation. In the present study, the simplifications made in the previous studies have been removed, and the model developed in Shinjo et al. (Reference Shinjo, Xia, Megaritis, Ganippa and Cracknell2016) is used to initialise the inner-droplet temperature distribution. Puffing-enhanced mixing will be investigated in fully three-dimensional configurations for both a single emulsion droplet and a droplet group under convective heating. By considering realistic combustor flow conditions, outcomes from the present study can be useful for practical-scale blended-fuel spray simulation, in which puffing and microexplosion effects on the spray are modelled.
The rest of this paper is organised as follows. In § 2, the formulations and numerical methods are detailed. In § 3, the case set-up is described. In § 4, the results and discussion on puffing and its effects on fuel/air mixing are presented. Finally, in § 5, the concluding remarks are given.
2 Formulations and numerical methods
The governing equations are the Navier–Stokes conservation equations of mass, momentum, energy and species (Shinjo & Umemura Reference Shinjo and Umemura2010, Reference Shinjo and Umemura2011, Reference Shinjo and Umemura2013; Shinjo et al.
Reference Shinjo, Xia, Ganippa and Megaritis2014, Reference Shinjo, Xia, Megaritis, Ganippa and Cracknell2016; Shinjo, Xia & Umemura Reference Shinjo, Xia and Umemura2015). Four species, namely $\text{C}_{10}\text{H}_{22},\text{C}_{2}\text{H}_{5}\text{OH}$
,
$\text{C}_{10}\text{H}_{22},\text{C}_{2}\text{H}_{5}\text{OH}$
, $\text{N}_{2}$
and
$\text{N}_{2}$
and $\text{O}_{2}$
, are considered, and chemical reactions are not included. The governing equations are
$\text{O}_{2}$
, are considered, and chemical reactions are not included. The governing equations are
 $$\begin{eqnarray}\partial \boldsymbol{f}/\partial t+(\boldsymbol{u}\boldsymbol{\cdot }\boldsymbol{{\rm\nabla}})\boldsymbol{f}=\boldsymbol{g},\end{eqnarray}$$
where
 $$\begin{eqnarray}\displaystyle & \displaystyle \boldsymbol{f}=({\it\rho},\boldsymbol{u},T,Y_{i}), & \displaystyle\end{eqnarray}$$
 $$\begin{eqnarray}\displaystyle & \displaystyle \boldsymbol{g}=\left(-{\it\rho}\boldsymbol{{\rm\nabla}}\boldsymbol{\cdot }\boldsymbol{u}+S_{{\it\rho}},-\frac{\boldsymbol{{\rm\nabla}}p}{{\it\rho}}+\boldsymbol{Q}_{\boldsymbol{u}}+\mathop{\sum }_{k}\boldsymbol{F}_{\boldsymbol{u}}^{k}+\boldsymbol{S}_{\boldsymbol{u}},-\frac{P_{TH}\boldsymbol{{\rm\nabla}}\boldsymbol{\cdot }\boldsymbol{u}}{{\it\rho}c_{v}}+Q_{T}+S_{T},Q_{Y_{i}}\right). & \displaystyle \nonumber\\ \displaystyle & & \displaystyle\end{eqnarray}$$ ${\it\rho}$
is the density,
${\it\rho}$
is the density, $\boldsymbol{u}$
is the velocity,
$\boldsymbol{u}$
is the velocity, $T$
is the temperature,
$T$
is the temperature, $Y_{i}$
is the mass fraction of species
$Y_{i}$
is the mass fraction of species $i$
,
$i$
, $p$
is the pressure and
$p$
is the pressure and $c_{v}$
is the specific heat at constant volume. The general form for
$c_{v}$
is the specific heat at constant volume. The general form for $P_{TH}$
is
$P_{TH}$
is $P_{TH}=T(\partial p/\partial T)_{{\it\rho}}$
, and for an ideal gas
$P_{TH}=T(\partial p/\partial T)_{{\it\rho}}$
, and for an ideal gas $P_{TH}=p$
. The term
$P_{TH}=p$
. The term $\boldsymbol{Q}_{\boldsymbol{u}}$
is the acceleration due to viscous force, given as
$\boldsymbol{Q}_{\boldsymbol{u}}$
is the acceleration due to viscous force, given as  $$\begin{eqnarray}\displaystyle & \displaystyle Q_{u,i}=\frac{1}{{\it\rho}}\frac{\partial {\it\tau}_{ij}}{\partial x_{j}},\quad i=x,y,z, & \displaystyle\end{eqnarray}$$
 $$\begin{eqnarray}\displaystyle & \displaystyle {\it\tau}_{ij}={\it\mu}\left(\frac{\partial u_{i}}{\partial x_{j}}+\frac{\partial u_{j}}{\partial x_{i}}\right)-\frac{2}{3}{\it\mu}(\boldsymbol{{\rm\nabla}}\boldsymbol{\cdot }\boldsymbol{u}){\it\delta}_{ij}, & \displaystyle\end{eqnarray}$$
 $$\begin{eqnarray}\displaystyle & \displaystyle {\it\mu}=(1-{\it\phi}){\it\mu}_{G}+{\it\phi}{\it\mu}_{L}, & \displaystyle\end{eqnarray}$$ ${\it\mu}$
is the viscosity,
${\it\mu}$
is the viscosity, ${\it\phi}$
is the colour function (
${\it\phi}$
is the colour function ( ${\it\phi}=1$
for liquid and
${\it\phi}=1$
for liquid and ${\it\phi}=0$
for gas) and
${\it\phi}=0$
for gas) and ${\it\delta}_{ij}$
is Kronecker’s delta. The subscript
${\it\delta}_{ij}$
is Kronecker’s delta. The subscript $L$
denotes the liquid phase and
$L$
denotes the liquid phase and $G$
the gas phase. The term
$G$
the gas phase. The term $\boldsymbol{F}_{\boldsymbol{u}}^{k}$
is the acceleration due to surface tension at interface
$\boldsymbol{F}_{\boldsymbol{u}}^{k}$
is the acceleration due to surface tension at interface $k$
(the interface can be between liquid and gas or liquid and liquid). It is formulated using the CSF (continuum surface force) method (Brackbill, Kothe & Zemach Reference Brackbill, Kothe and Zemach1992) as
$k$
(the interface can be between liquid and gas or liquid and liquid). It is formulated using the CSF (continuum surface force) method (Brackbill, Kothe & Zemach Reference Brackbill, Kothe and Zemach1992) as  $$\begin{eqnarray}\boldsymbol{F}_{\boldsymbol{u}}^{k}=\frac{{\it\sigma}^{k}}{[{\it\rho}]^{k}\langle {\it\rho}\rangle ^{k}}{\it\kappa}^{k}\boldsymbol{{\rm\nabla}}{\it\rho},\end{eqnarray}$$
where ${\it\sigma}^{k}$
is the surface tension coefficient of interface
${\it\sigma}^{k}$
is the surface tension coefficient of interface $k$
,
$k$
, $[{\it\rho}]^{k}=|{\it\rho}_{k+}-{\it\rho}_{k-}|$
is the density difference at the interface and
$[{\it\rho}]^{k}=|{\it\rho}_{k+}-{\it\rho}_{k-}|$
is the density difference at the interface and $\langle {\it\rho}\rangle ^{k}=1/2\cdot ({\it\rho}_{k+}+{\it\rho}_{k-})$
. The subscript
$\langle {\it\rho}\rangle ^{k}=1/2\cdot ({\it\rho}_{k+}+{\it\rho}_{k-})$
. The subscript $k+$
indicates a value on one side of the interface and
$k+$
indicates a value on one side of the interface and $k-$
on the other side. Here,
$k-$
on the other side. Here, ${\it\kappa}^{k}$
is the local curvature given by
${\it\kappa}^{k}$
is the local curvature given by
 $$\begin{eqnarray}{\it\kappa}^{k}=-\boldsymbol{{\rm\nabla}}\boldsymbol{\cdot }\boldsymbol{n}^{k},\end{eqnarray}$$
where $\boldsymbol{n}^{k}$
is the surface-normal unit vector. Using a level-set function for interface
$\boldsymbol{n}^{k}$
is the surface-normal unit vector. Using a level-set function for interface $k$
,
$k$
, $F^{k}$
(defined later),
$F^{k}$
(defined later), $\boldsymbol{n}^{k}$
is
$\boldsymbol{n}^{k}$
is
 $$\begin{eqnarray}\boldsymbol{n}^{k}=\frac{\boldsymbol{{\rm\nabla}}F^{k}}{|\boldsymbol{{\rm\nabla}}F^{k}|}.\end{eqnarray}$$
The term $Q_{Y_{i}}$
is the mass fraction change rate due to diffusion and
$Q_{Y_{i}}$
is the mass fraction change rate due to diffusion and $Q_{T}$
is the temperature change rate due to heat conduction, diffusion and the work done by viscous forces, given as
$Q_{T}$
is the temperature change rate due to heat conduction, diffusion and the work done by viscous forces, given as
 $$\begin{eqnarray}\displaystyle & \displaystyle Q_{Y_{i}}=\frac{1}{{\it\rho}}\boldsymbol{{\rm\nabla}}\boldsymbol{\cdot }({\it\rho}D_{dif}\boldsymbol{{\rm\nabla}}Y_{i}), & \displaystyle\end{eqnarray}$$
 $$\begin{eqnarray}\displaystyle & \displaystyle Q_{T}=\frac{1}{{\it\rho}c_{v}}\left[\boldsymbol{{\rm\nabla}}\boldsymbol{\cdot }({\it\lambda}\boldsymbol{{\rm\nabla}}T)-\boldsymbol{{\rm\nabla}}\boldsymbol{\cdot }\left({\it\rho}\mathop{\sum }_{i}h_{i}Y_{i}\boldsymbol{V}_{i}\right)+\frac{\partial }{\partial x_{j}}({\it\tau}_{ij}u_{i})\right], & \displaystyle\end{eqnarray}$$
where $D_{dif}$
is the diffusion coefficient,
$D_{dif}$
is the diffusion coefficient, ${\it\lambda}$
is the thermal conductivity,
${\it\lambda}$
is the thermal conductivity, $h_{i}$
is the enthalpy of species
$h_{i}$
is the enthalpy of species $i$
and
$i$
and $\boldsymbol{V}_{i}$
is the diffusion velocity for species
$\boldsymbol{V}_{i}$
is the diffusion velocity for species $i$
modelled by Fick’s law. The terms
$i$
modelled by Fick’s law. The terms $S_{\ast }$
are the evaporation source terms described below. The pressure is obtained by solving the pressure Poisson equation derived from (2.1),
$S_{\ast }$
are the evaporation source terms described below. The pressure is obtained by solving the pressure Poisson equation derived from (2.1),
 $$\begin{eqnarray}\boldsymbol{{\rm\nabla}}\boldsymbol{\cdot }\left(\frac{\boldsymbol{{\rm\nabla}}p^{\ast }}{{\it\rho}}\right)=\frac{p^{\ast }-p}{{\it\rho}{c_{s}}^{2}{\rm\Delta}t^{2}}+\frac{\boldsymbol{{\rm\nabla}}\boldsymbol{\cdot }\boldsymbol{u}}{{\rm\Delta}t},\end{eqnarray}$$
where $c_{s}$
is the speed of sound and the superscript
$c_{s}$
is the speed of sound and the superscript $\ast$
denotes the updated pressure value at time
$\ast$
denotes the updated pressure value at time $t^{\ast }=t+{\rm\Delta}t$
. This method to include compressibility effects is called the CUP (combined and unified procedure) formulation (Yabe, Xiao & Utsumi Reference Yabe, Xiao and Utsumi2001; Shinjo et al.
Reference Shinjo, Xia, Ganippa and Megaritis2014). For the gas phase, the perfect-gas equation of state is used. For the liquid phase, Tait’s equation of state
$t^{\ast }=t+{\rm\Delta}t$
. This method to include compressibility effects is called the CUP (combined and unified procedure) formulation (Yabe, Xiao & Utsumi Reference Yabe, Xiao and Utsumi2001; Shinjo et al.
Reference Shinjo, Xia, Ganippa and Megaritis2014). For the gas phase, the perfect-gas equation of state is used. For the liquid phase, Tait’s equation of state
 $$\begin{eqnarray}\frac{p+A_{w}}{p_{0}+A_{w}}=\left(\frac{{\it\rho}}{{\it\rho}_{0}}\right)^{{\it\gamma}_{w}}\end{eqnarray}$$
is used, where the subscript $0$
denotes reference values,
$0$
denotes reference values, $A_{w}=296.3~\text{MPa}$
and
$A_{w}=296.3~\text{MPa}$
and ${\it\gamma}_{w}=7.415$
(Shinjo et al.
Reference Shinjo, Xia, Ganippa and Megaritis2014).
${\it\gamma}_{w}=7.415$
(Shinjo et al.
Reference Shinjo, Xia, Ganippa and Megaritis2014).
The phase change is formulated by the jump conditions at the evaporating or boiling interface between liquid and gas (Tanguy, Ménard & Berlemont Reference Tanguy, Ménard and Berlemont2007). The superscript $k$
is omitted below for simplicity. At the outer surface of a parent droplet, evaporation of decane occurs since the liquid decane temperature remains below the boiling point temperature. The vapour mass fraction at the droplet surface
$k$
is omitted below for simplicity. At the outer surface of a parent droplet, evaporation of decane occurs since the liquid decane temperature remains below the boiling point temperature. The vapour mass fraction at the droplet surface $Y_{V}$
is determined by the Clapeyron–Clausius relation
$Y_{V}$
is determined by the Clapeyron–Clausius relation
 $$\begin{eqnarray}\displaystyle & \displaystyle p_{V}=p_{\infty }\exp \left(-\frac{h_{l}W_{V}}{\tilde{R}}\left(\frac{1}{T}-\frac{1}{T_{b}}\right)\right), & \displaystyle\end{eqnarray}$$
 $$\begin{eqnarray}\displaystyle & \displaystyle Y_{V}=\frac{p_{V}W_{V}}{(p_{\infty }-p_{V})W_{G}+p_{V}W_{V}}, & \displaystyle\end{eqnarray}$$ $p_{V}$
is the vapour pressure,
$p_{V}$
is the vapour pressure, $p_{\infty }$
is the ambient pressure,
$p_{\infty }$
is the ambient pressure, $h_{l}$
is the latent heat of evaporation,
$h_{l}$
is the latent heat of evaporation, $\tilde{R}$
is the universal gas constant,
$\tilde{R}$
is the universal gas constant, $T_{b}$
is the boiling temperature,
$T_{b}$
is the boiling temperature, $W_{V}$
is the vapour molecular weight and
$W_{V}$
is the vapour molecular weight and $W_{G}$
is the ambient gas molecular weight. The evaporation rate
$W_{G}$
is the ambient gas molecular weight. The evaporation rate $\dot{{\it\omega}}$
is determined by the jump conditions of heat and mass transfer at the interface as
$\dot{{\it\omega}}$
is determined by the jump conditions of heat and mass transfer at the interface as  $$\begin{eqnarray}\displaystyle & h_{l}\dot{{\it\omega}}=[{\it\lambda}\boldsymbol{{\rm\nabla}}T\boldsymbol{\cdot }\boldsymbol{n}], & \displaystyle\end{eqnarray}$$
 $$\begin{eqnarray}\displaystyle & \dot{{\it\omega}}(Y_{i,G}-Y_{i,L})=[{\it\rho}D_{dif}\boldsymbol{{\rm\nabla}}Y_{i}\boldsymbol{\cdot }\boldsymbol{n}]. & \displaystyle\end{eqnarray}$$
The square brackets denote the difference of a variable $f$
between the liquid and gas phases at the interface, i.e.
$f$
between the liquid and gas phases at the interface, i.e. $[f]=f_{L}-f_{G}$
. In one or multiple ethanol sub-droplets inside the parent droplet, explosive boiling occurs after the ethanol is superheated. At the interface between the liquid ethanol and the gaseous ethanol vapour, the jump conditions are also given by the above formulation with
$[f]=f_{L}-f_{G}$
. In one or multiple ethanol sub-droplets inside the parent droplet, explosive boiling occurs after the ethanol is superheated. At the interface between the liquid ethanol and the gaseous ethanol vapour, the jump conditions are also given by the above formulation with $Y_{V}=1$
. The superheat degree
$Y_{V}=1$
. The superheat degree ${\rm\Delta}T=T-T_{b}$
determines the mass boiling rate in (2.12). The velocity at the interface satisfies (Tanguy, Ménard & Berlemont Reference Tanguy, Ménard and Berlemont2007; Shinjo et al.
Reference Shinjo, Xia, Ganippa and Megaritis2014)
${\rm\Delta}T=T-T_{b}$
determines the mass boiling rate in (2.12). The velocity at the interface satisfies (Tanguy, Ménard & Berlemont Reference Tanguy, Ménard and Berlemont2007; Shinjo et al.
Reference Shinjo, Xia, Ganippa and Megaritis2014)
 $$\begin{eqnarray}\dot{{\it\omega}}={\it\rho}_{L}(\boldsymbol{u}_{\boldsymbol{s}}-\boldsymbol{u}_{\boldsymbol{L}})\boldsymbol{\cdot }\boldsymbol{n}={\it\rho}_{G}(\boldsymbol{u}_{\boldsymbol{s}}-\boldsymbol{u}_{\boldsymbol{G}})\boldsymbol{\cdot }\boldsymbol{n},\end{eqnarray}$$
where the surface velocity $\boldsymbol{u}_{\boldsymbol{s}}$
is defined as the sum of the liquid velocity and the surface regression velocity, namely
$\boldsymbol{u}_{\boldsymbol{s}}$
is defined as the sum of the liquid velocity and the surface regression velocity, namely $\boldsymbol{u}_{\boldsymbol{s}}=\boldsymbol{u}_{\boldsymbol{L}}+\boldsymbol{s}_{\boldsymbol{L}}$
and
$\boldsymbol{u}_{\boldsymbol{s}}=\boldsymbol{u}_{\boldsymbol{L}}+\boldsymbol{s}_{\boldsymbol{L}}$
and $\boldsymbol{s}_{\boldsymbol{L}}=s_{L}\boldsymbol{n}=(\dot{{\it\omega}}/{\it\rho}_{L})\boldsymbol{n}$
. The velocity jump is
$\boldsymbol{s}_{\boldsymbol{L}}=s_{L}\boldsymbol{n}=(\dot{{\it\omega}}/{\it\rho}_{L})\boldsymbol{n}$
. The velocity jump is
 $$\begin{eqnarray}\boldsymbol{u}_{\boldsymbol{G}}-\boldsymbol{u}_{\boldsymbol{L}}=-({\it\rho}_{G}^{-1}-{\it\rho}_{L}^{-1})\dot{{\it\omega}}\boldsymbol{n}.\end{eqnarray}$$
Therefore, the source terms for phase change in (2.2b ) are
 $$\begin{eqnarray}\displaystyle S_{{\it\rho}} & = & \displaystyle {\it\rho}({\it\rho}_{G}^{-1}-{\it\rho}_{L}^{-1})\dot{{\it\omega}}{\it\delta},\end{eqnarray}$$
 $$\begin{eqnarray}\displaystyle \boldsymbol{S}_{\boldsymbol{u}} & = & \displaystyle ({\it\rho}_{G}^{-1}-{\it\rho}_{L}^{-1})\dot{{\it\omega}}(\dot{{\it\omega}}/{\it\rho}){\it\delta}\boldsymbol{n},\end{eqnarray}$$
 $$\begin{eqnarray}\displaystyle S_{T} & = & \displaystyle -(h_{l}/{\it\rho}c_{p})\dot{{\it\omega}}{\it\delta},\end{eqnarray}$$ ${\it\delta}$
is the delta function and is used to identify an interface, and
${\it\delta}$
is the delta function and is used to identify an interface, and $c_{p}$
is the specific heat at constant pressure (Shinjo et al.
Reference Shinjo, Xia, Ganippa and Megaritis2014).
$c_{p}$
is the specific heat at constant pressure (Shinjo et al.
Reference Shinjo, Xia, Ganippa and Megaritis2014).
In addition to (2.1), level-set functions are solved to capture the liquid/liquid and liquid/gas interfaces (Sussman, Smereka & Osher Reference Sussman, Smereka and Osher1994; Sussman & Puckett Reference Sussman and Puckett2000). The level-set function for interface $k$
, denoted as
$k$
, denoted as $F^{k}$
, is a signed-distance function and follows
$F^{k}$
, is a signed-distance function and follows
 $$\begin{eqnarray}\frac{\partial F^{k}}{\partial t}+(\boldsymbol{u}\boldsymbol{\cdot }\boldsymbol{{\rm\nabla}})F^{k}=-|\boldsymbol{{\rm\nabla}}F^{k}|s_{L}^{k}.\end{eqnarray}$$
Here, $F^{k}=0$
represents the interface. For a fluid system with multiple interfaces, multiple level-set functions can be superimposed. The surface regression velocity of interface
$F^{k}=0$
represents the interface. For a fluid system with multiple interfaces, multiple level-set functions can be superimposed. The surface regression velocity of interface $k$
,
$k$
, $s_{L}^{k}$
, is zero for a liquid/liquid interface. For ethanol sub-droplets in a parent decane droplet, any neighbouring sub-droplets are captured by different level-set functions, although physically all of the sub-droplet surfaces have no difference. This is a numerical setting to prevent unphysical coalescence of ethanol sub-droplets at low temperature. This approach, called the MLE (multiple level-set functions for emulsion) method, has been validated in Shinjo et al. (Reference Shinjo, Xia, Megaritis, Ganippa and Cracknell2016). The volume conservation is improved by combining the level-set method with the MARS (multi-interface advection and reconstruction solver) method, a kind of VOF (volume of fluid) method (Kunugi Reference Kunugi1997). The numerical scheme used for the advection calculation is the CIP (cubic interpolated pseudo-particle or constrained interpolation profile) method (Takewaki, Nishiguchi & Yabe Reference Takewaki, Nishiguchi and Yabe1985).
$s_{L}^{k}$
, is zero for a liquid/liquid interface. For ethanol sub-droplets in a parent decane droplet, any neighbouring sub-droplets are captured by different level-set functions, although physically all of the sub-droplet surfaces have no difference. This is a numerical setting to prevent unphysical coalescence of ethanol sub-droplets at low temperature. This approach, called the MLE (multiple level-set functions for emulsion) method, has been validated in Shinjo et al. (Reference Shinjo, Xia, Megaritis, Ganippa and Cracknell2016). The volume conservation is improved by combining the level-set method with the MARS (multi-interface advection and reconstruction solver) method, a kind of VOF (volume of fluid) method (Kunugi Reference Kunugi1997). The numerical scheme used for the advection calculation is the CIP (cubic interpolated pseudo-particle or constrained interpolation profile) method (Takewaki, Nishiguchi & Yabe Reference Takewaki, Nishiguchi and Yabe1985).
The numerical code used is MEX (MicroEXplosion) (Shinjo & Umemura Reference Shinjo and Umemura2010, Reference Shinjo and Umemura2011, Reference Shinjo and Umemura2013; Shinjo et al. Reference Shinjo, Xia, Ganippa and Megaritis2014, Reference Shinjo, Xia and Umemura2015, Reference Shinjo, Xia, Megaritis, Ganippa and Cracknell2016). The code has been used for direct simulation of interfacial multiphase flows such as droplet pinch-off (Shinjo & Umemura Reference Shinjo and Umemura2010), turbulent liquid spray atomisation (Shinjo & Umemura Reference Shinjo and Umemura2010, Reference Shinjo and Umemura2011) and evaporating spray dynamics (Shinjo & Umemura Reference Shinjo and Umemura2013; Shinjo et al. Reference Shinjo, Xia and Umemura2015). In Shinjo et al. (Reference Shinjo, Xia, Ganippa and Megaritis2014), the MEX code has satisfactorily demonstrated its capability of directly simulating boiling surface dynamics (Stefan problem) and linear/nonlinear droplet oscillation, which are directly related to puffing and microexplosion. In Shinjo et al. (Reference Shinjo, Xia, Megaritis, Ganippa and Cracknell2016), the MEX code has demonstrated its capability of directly simulating convective heat/mass transfer of an emulsion droplet, including the internal circulation motion inside the droplet.
3 Case set-up
An ethanol-blended diesel spray would be the ideal configuration to study puffing effects on fuel/air mixing in a fuel spray. Due to computational cost considerations, however, convective heating of a single emulsion droplet and a droplet group has been taken as the computational configuration in the present study. It is therefore important to set up proper boundary conditions to approximate realistic flow conditions in a fuel spray process.
In a fuel spray, the relationship between the droplet scale (diameter $D$
) and the turbulence scale (Kolmogorov scale
$D$
) and the turbulence scale (Kolmogorov scale ${\it\eta}$
) is
${\it\eta}$
) is $D\sim {\it\eta}$
in the dense spray region near the nozzle, where the generation of turbulence is mainly due to the formation of boundary layers and wake flows around finite-volume droplets (Sirignano Reference Sirignano2010; Shinjo et al.
Reference Shinjo, Xia and Umemura2015). In the downstream dilute spray region where the relative velocity between the droplet and the gas is nearly zero, the scale relation is
$D\sim {\it\eta}$
in the dense spray region near the nozzle, where the generation of turbulence is mainly due to the formation of boundary layers and wake flows around finite-volume droplets (Sirignano Reference Sirignano2010; Shinjo et al.
Reference Shinjo, Xia and Umemura2015). In the downstream dilute spray region where the relative velocity between the droplet and the gas is nearly zero, the scale relation is $D<{\it\eta}$
. The droplet Reynolds number,
$D<{\it\eta}$
. The droplet Reynolds number, $Re=U_{r}D/{\it\nu}_{G}$
, where
$Re=U_{r}D/{\it\nu}_{G}$
, where $U_{r}$
is the relative velocity between the droplet and the gas, and
$U_{r}$
is the relative velocity between the droplet and the gas, and ${\it\nu}_{G}$
is the gas kinematic viscosity, is at most
${\it\nu}_{G}$
is the gas kinematic viscosity, is at most $Re\sim O(10)$
in the near-nozzle region under typical combustor conditions (Sirignano Reference Sirignano2010). In this study, the flow conditions are set in this Reynolds number regime, with the droplet diameter
$Re\sim O(10)$
in the near-nozzle region under typical combustor conditions (Sirignano Reference Sirignano2010). In this study, the flow conditions are set in this Reynolds number regime, with the droplet diameter $D=30~{\rm\mu}\text{m}$
, which gives
$D=30~{\rm\mu}\text{m}$
, which gives $D\sim {\it\eta}$
. Therefore, the free-stream gaseous flow is laminar with a fixed velocity and no fluctuations.
$D\sim {\it\eta}$
. Therefore, the free-stream gaseous flow is laminar with a fixed velocity and no fluctuations.
For a droplet group, its geometrical location in the spray also matters. Figure 2(a) shows a schematic of a near-nozzle dense spray, where some droplets are located on the periphery of the dense spray area and directly exposed to the hot air, while most other droplets are located inside a large droplet cloud. The heating conditions are different for droplet groups of these two categories. Therefore, different boundary conditions should be used to approximate the two different heating conditions for a droplet group.

Figure 2. Schematic of the simulation cases in this study; $+y$
is the convective flow direction. (a) Droplet groups in a spray. (b) Single-droplet case. (c) Multiple-droplet case.
$+y$
is the convective flow direction. (a) Droplet groups in a spray. (b) Single-droplet case. (c) Multiple-droplet case.
Table 1. Case set-up. For the upstream boundary condition, F stands for fixed-velocity convection and P for the periodic condition. It is therefore implied that the droplet group is located on the periphery of a dense spray for B1 and inside a large droplet cloud for B2.

Taking into account the above considerations, table 1 shows the cases simulated in this study. Cases A1–A5 are single-droplet cases illustrated in figure 2(b), where the number of nucleation is varied inside the parent decane droplet. Cases B1 and B2 are multiple-droplet cases. For cases A1–A5, the flow velocity is fixed at the upstream boundary and free outflow conditions are given at all of the other boundaries. For case B1, the incoming velocity is fixed, free outflow conditions are given at the downstream boundary and periodic conditions are imposed at the side boundaries. For case B2, periodic conditions are given at all of the boundaries. Therefore, in cases A1–A5 and B1, the upstream droplet(s) is/are always exposed to the fresh hot air flow, mimicking a droplet or a droplet group on the spray periphery (see figure 2 b,c). In case B2, all of the droplets are in the wake region of other preceding droplets, mimicking a droplet group inside a large droplet cloud (see figure 2 a).
The volume fraction of ethanol and the sub-droplet size affect the degree of breakup (Shinjo et al.
Reference Shinjo, Xia, Ganippa and Megaritis2014). These are input parameters for the system, basically determined at the stage of fuel preparation. In this study, a realistic fuel spray is considered for which a moderate volume fraction is practical. Based on the results of Shinjo et al. (Reference Shinjo, Xia, Ganippa and Megaritis2014), the sub-droplet number and size are chosen to be moderate so that they characterise a representative puffing-dominant mode. For all of the cases, the diameters of the parent decane droplet and ethanol sub-droplets are $D=30~{\rm\mu}\text{m}$
and
$D=30~{\rm\mu}\text{m}$
and $D_{sub}=4.6~{\rm\mu}\text{m}$
respectively. The number of ethanol sub-droplets is 19 in a parent decane droplet, and the volume fraction of ethanol is 7.4 %. The air velocity is
$D_{sub}=4.6~{\rm\mu}\text{m}$
respectively. The number of ethanol sub-droplets is 19 in a parent decane droplet, and the volume fraction of ethanol is 7.4 %. The air velocity is $U_{G}=10~\text{m}~\text{s}^{-1}$
, the air temperature
$U_{G}=10~\text{m}~\text{s}^{-1}$
, the air temperature $T_{G}=900~\text{K}$
, the air pressure
$T_{G}=900~\text{K}$
, the air pressure $p=1~\text{MPa}$
and the droplet Reynolds number
$p=1~\text{MPa}$
and the droplet Reynolds number $Re=30$
. The number of nucleation in cases A1–A5 is varied to cover a range of the degree of breakup. Physical properties such as heat capacity
$Re=30$
. The number of nucleation in cases A1–A5 is varied to cover a range of the degree of breakup. Physical properties such as heat capacity $c_{p}$
, thermal conductivity
$c_{p}$
, thermal conductivity ${\it\lambda}$
, viscosity
${\it\lambda}$
, viscosity ${\it\mu}$
, latent heat of evaporation
${\it\mu}$
, latent heat of evaporation $h_{l}$
and surface tension
$h_{l}$
and surface tension ${\it\sigma}$
are retrieved from the databases of NIST (National Institute of Standards and Technology) (NIST 2011) and Jasper (Reference Jasper1974). For all of the physical properties, temperature dependence is considered.
${\it\sigma}$
are retrieved from the databases of NIST (National Institute of Standards and Technology) (NIST 2011) and Jasper (Reference Jasper1974). For all of the physical properties, temperature dependence is considered.
The ambient pressure is set at $p=1~\text{MPa}$
. At this pressure, the boiling temperature of decane is 565 K, which is higher than that of ethanol (425 K). The superheat limit of ethanol is 477 K. The embedded ethanol sub-droplets can be superheated up to this limit, which is still below the boiling temperature of decane. As the liquid ethanol temperature approaches the superheat limit, nucleation (initial generation of vapour bubbles) occurs and triggers explosive boiling. Nucleation is strongly dependent on the local liquid temperature. In homogeneous nucleation theory, the nucleation rate
$p=1~\text{MPa}$
. At this pressure, the boiling temperature of decane is 565 K, which is higher than that of ethanol (425 K). The superheat limit of ethanol is 477 K. The embedded ethanol sub-droplets can be superheated up to this limit, which is still below the boiling temperature of decane. As the liquid ethanol temperature approaches the superheat limit, nucleation (initial generation of vapour bubbles) occurs and triggers explosive boiling. Nucleation is strongly dependent on the local liquid temperature. In homogeneous nucleation theory, the nucleation rate $J~(\text{m}^{-3}~\text{s}^{-1})$
is given by Avedisian & Andres (Reference Avedisian and Andres1978), Avedisian & Glassman (Reference Avedisian and Glassman1981) and Avedisian (Reference Avedisian1985) as
$J~(\text{m}^{-3}~\text{s}^{-1})$
is given by Avedisian & Andres (Reference Avedisian and Andres1978), Avedisian & Glassman (Reference Avedisian and Glassman1981) and Avedisian (Reference Avedisian1985) as
 $$\begin{eqnarray}J={\it\Gamma}k_{f}N_{0}\exp (-{\it\Delta}/kT),\end{eqnarray}$$
where the activation energy is ${\it\Delta}=16{\rm\pi}{\it\sigma}^{3}/3(p_{V}-p_{L})^{2}$
,
${\it\Delta}=16{\rm\pi}{\it\sigma}^{3}/3(p_{V}-p_{L})^{2}$
, ${\it\Gamma}$
is a pre-exponential factor,
${\it\Gamma}$
is a pre-exponential factor, $k_{f}$
is a rate constant,
$k_{f}$
is a rate constant, $N_{0}$
is the molecular number density,
$N_{0}$
is the molecular number density, $k$
is the Boltzmann constant,
$k$
is the Boltzmann constant, ${\it\sigma}$
is the surface tension coefficient,
${\it\sigma}$
is the surface tension coefficient, $p_{V}$
is the vapour pressure and
$p_{V}$
is the vapour pressure and $p_{L}$
is the liquid pressure. The nucleation rate rapidly increases above a certain temperature due to the exponential effects of temperature. It is impossible to deterministically predict the nucleation location and timing in the framework of the continuum dynamics; therefore, in this study nucleation is initiated by placing tiny vapour bubbles. Past findings show that the bubble nucleation is more likely to occur at a liquid–liquid interface rather than deep inside a sub-droplet (Avedisian & Andres Reference Avedisian and Andres1978; Avedisian & Glassman Reference Avedisian and Glassman1981; Avedisian Reference Avedisian1985). To mimic this in the present simulation, bubbles are placed within the ethanol sub-droplets adjacent to the ethanol/decane interface. This has been also discussed in Shinjo et al. (Reference Shinjo, Xia, Ganippa and Megaritis2014).
$p_{L}$
is the liquid pressure. The nucleation rate rapidly increases above a certain temperature due to the exponential effects of temperature. It is impossible to deterministically predict the nucleation location and timing in the framework of the continuum dynamics; therefore, in this study nucleation is initiated by placing tiny vapour bubbles. Past findings show that the bubble nucleation is more likely to occur at a liquid–liquid interface rather than deep inside a sub-droplet (Avedisian & Andres Reference Avedisian and Andres1978; Avedisian & Glassman Reference Avedisian and Glassman1981; Avedisian Reference Avedisian1985). To mimic this in the present simulation, bubbles are placed within the ethanol sub-droplets adjacent to the ethanol/decane interface. This has been also discussed in Shinjo et al. (Reference Shinjo, Xia, Ganippa and Megaritis2014).
The droplet heating process prior to puffing is much slower than puffing. Inside an emulsion droplet, an internal circulation motion is developed due to convective heating, and therefore the inner-droplet temperature is not uniform. To properly approximate the heating outcome to save computational time, the model proposed in Shinjo et al. (Reference Shinjo, Xia, Megaritis, Ganippa and Cracknell2016) is utilised. In this previous study, the flow physics of convective heating of an emulsion droplet in a transient liquid Péclet number regime ( $100<Pe_{L}<500$
) was elucidated. This regime corresponds to realistic flow conditions in a combustor at
$100<Pe_{L}<500$
) was elucidated. This regime corresponds to realistic flow conditions in a combustor at $Re\sim 30$
. The initial temperature distribution in the parent droplet is approximated by the ECME (effective conductivity with modified eccentricity) model, which calculates the inner-droplet liquid temperature by using an eccentric axisymmetric coordinate system to reproduce the internal circulation effect, as schematically shown in figure 3(a).
$Re\sim 30$
. The initial temperature distribution in the parent droplet is approximated by the ECME (effective conductivity with modified eccentricity) model, which calculates the inner-droplet liquid temperature by using an eccentric axisymmetric coordinate system to reproduce the internal circulation effect, as schematically shown in figure 3(a).

Figure 3. Temperature field before vapour bubble nucleation. (a) Schematic of the liquid temperature inside the parent droplet predicted by the ECME model. (b) Temperature (K) field before nucleation. The liquid shape is represented by green isosurfaces and the temperature distribution is drawn on a two-dimensional cut plane. The solid black line shows the parent droplet surface on the cut plane. The convective air flow is from $-y$
to
$-y$
to $+y$
.
$+y$
.
During the droplet heating process, coalescence of embedded ethanol sub-droplets is expected to occur gradually, which changes the number and size of the sub-droplets. This is due to thermocapillary migration induced by the non-uniform liquid temperature distribution inside a parent diesel droplet and reduced effectiveness of the biodiesel surfactant at high temperature (Kadota & Yamasaki Reference Kadota and Yamasaki2002). However, this coalescence process is slow and only has a minor effect on a fuel spray, since the elapsed heating time is short for complete coalescence to occur in a combustor (Watanabe & Okazaki Reference Watanabe and Okazaki2013; Shinjo et al. Reference Shinjo, Xia, Ganippa and Megaritis2014). Even when puffing starts, the inner-droplet liquid temperature (except in the near-surface region) is still relatively low where the surfactant still maintains the repelling force between the sub-droplets. For the time scale of puffing studied here, sub-droplet coalescence does not occur even if the sub-droplets are clustered. Therefore, in this study, coalescence of sub-droplets is not simulated. Instead, the simulation cases start with finite-size ethanol sub-droplets, and the number of nucleation is varied to change the strength of puffing and thus the extent of droplet breakup.
The numerical procedure for simulation initialisation in this study is as follows. First, the initial inner-droplet liquid temperature field is given by the ECME model. Then, the coupled gas/liquid heating simulation is started, initially with uniform gas-phase temperature and velocity. This fully coupled heating simulation is continued until the gas-phase velocity and species concentration fields around the droplet reach a quasi-steady state, as shown in figure 3(b). Then, nucleation is triggered. Inside the parent droplet, the liquid temperature is high in the rear region (Shinjo et al. Reference Shinjo, Xia, Megaritis, Ganippa and Cracknell2016). Therefore, for all of the cases, the nucleation starts from the rear region of a parent droplet.
To resolve the embedded sub-droplet structures, the grid spacing is equidistantly set as ${\rm\Delta}x={\rm\Delta}y={\rm\Delta}z=0.19~{\rm\mu}\text{m}$
, and the total number of grid points is 243 million for cases A1–A5 and 576 million for cases B1 and B2. A grid convergence study was conducted in Shinjo et al. (Reference Shinjo, Xia, Ganippa and Megaritis2014), and the current grid spacing is smaller than that used there. The simulations have been conducted on the UK national supercomputer ARCHER using 1728 and 4096 processor cores for the series-A and series-B cases respectively. The wall-clock time is 300–400 h for each case.
${\rm\Delta}x={\rm\Delta}y={\rm\Delta}z=0.19~{\rm\mu}\text{m}$
, and the total number of grid points is 243 million for cases A1–A5 and 576 million for cases B1 and B2. A grid convergence study was conducted in Shinjo et al. (Reference Shinjo, Xia, Ganippa and Megaritis2014), and the current grid spacing is smaller than that used there. The simulations have been conducted on the UK national supercomputer ARCHER using 1728 and 4096 processor cores for the series-A and series-B cases respectively. The wall-clock time is 300–400 h for each case.
4 Results and discussion
4.1 Dynamics of puffing
Figure 4 shows the temporal sequence of puffing for case A2. In this figure, the parent decane droplet and embedded ethanol sub-droplets are shown by green isosurfaces, decane vapour by blue isosurfaces for $Y_{decane}=0.1$
and 0.2, and ethanol vapour by red isosurfaces for
$Y_{decane}=0.1$
and 0.2, and ethanol vapour by red isosurfaces for $Y_{ethanol}=0.05$
and 0.1. In this case, two distantly separated vapour bubbles are activated in the rear region of the emulsion droplet. As time passes, the bubbles grow to two substantially large ones before puffing occurs, because the two ethanol sub-droplets in which nucleation is triggered are rather deep inside the parent droplet. As the bubbles grow, the emulsion droplet finally ruptures and ejects boiled ethanol vapour.
$Y_{ethanol}=0.05$
and 0.1. In this case, two distantly separated vapour bubbles are activated in the rear region of the emulsion droplet. As time passes, the bubbles grow to two substantially large ones before puffing occurs, because the two ethanol sub-droplets in which nucleation is triggered are rather deep inside the parent droplet. As the bubbles grow, the emulsion droplet finally ruptures and ejects boiled ethanol vapour.

Figure 4. Ethanol ejection and droplet breakup for case A2. The convective air flow is from $-y$
to
$-y$
to $+y$
. The decane vapour is shown by blue (light grey in the printed version) isosurfaces for
$+y$
. The decane vapour is shown by blue (light grey in the printed version) isosurfaces for $Y_{decane}=0.1$
and 0.2, and ethanol vapour by red (dark grey in the printed version) isosurfaces for
$Y_{decane}=0.1$
and 0.2, and ethanol vapour by red (dark grey in the printed version) isosurfaces for $Y_{ethanol}=0.05$
and 0.1. The solid rectangle in (b) shows the region where detailed analysis of puffing effects on mixing will be conducted in § 4.2.3: (a)
$Y_{ethanol}=0.05$
and 0.1. The solid rectangle in (b) shows the region where detailed analysis of puffing effects on mixing will be conducted in § 4.2.3: (a) $t=10.56~{\rm\mu}\text{s}$
; (b)
$t=10.56~{\rm\mu}\text{s}$
; (b) $t=11.88~{\rm\mu}\text{s}$
; (c)
$t=11.88~{\rm\mu}\text{s}$
; (c) $t=13.20~{\rm\mu}\text{s}$
.
$t=13.20~{\rm\mu}\text{s}$
.
From the ejection on the upper $z$
side, which is directed towards the
$z$
side, which is directed towards the $+xz$
direction, a ligament is pushed out due to the recoiling motion of the liquid surface after ethanol vapour ejection (figure 4
a,b). The mechanism is schematically shown in figure 5. The ligament ejection occurs when the recoiling motion is strong. This is likely to occur when the bubble size is large before the emulsion droplet ruptures, namely when the boiling sub-droplet is deep inside the parent droplet as in the present case. When a boiling ethanol sub-droplet is close to the parent decane droplet surface, the recoiling motion is relatively weak and will lead to oscillations of the remaining sub-droplet (Shinjo et al.
Reference Shinjo, Xia, Ganippa and Megaritis2014).
$+xz$
direction, a ligament is pushed out due to the recoiling motion of the liquid surface after ethanol vapour ejection (figure 4
a,b). The mechanism is schematically shown in figure 5. The ligament ejection occurs when the recoiling motion is strong. This is likely to occur when the bubble size is large before the emulsion droplet ruptures, namely when the boiling sub-droplet is deep inside the parent droplet as in the present case. When a boiling ethanol sub-droplet is close to the parent decane droplet surface, the recoiling motion is relatively weak and will lead to oscillations of the remaining sub-droplet (Shinjo et al.
Reference Shinjo, Xia, Ganippa and Megaritis2014).

Figure 5. Schematic of the puffing dynamics and after-puffing ligament ejection.

Figure 6. Sequence of boiled ethanol vapour ejection for case A2. The puffing jet in the region indicated by the rectangle in figure 4(b) is investigated. The unit of the velocity is $\text{m}~\text{s}^{-1}$
: (a)
$\text{m}~\text{s}^{-1}$
: (a) $t=10.56~{\rm\mu}\text{s}$
; (b)
$t=10.56~{\rm\mu}\text{s}$
; (b) $t=11.22~{\rm\mu}\text{s}$
; (c)
$t=11.22~{\rm\mu}\text{s}$
; (c) $t=11.88~{\rm\mu}\text{s}$
; (d)
$t=11.88~{\rm\mu}\text{s}$
; (d) $t=13.20~{\rm\mu}\text{s}$
.
$t=13.20~{\rm\mu}\text{s}$
.
From the ejection in the lower $z$
side in figure 4(b), only gaseous ethanol vapour is ejected and no liquid fragmentation occurs. The ejection is mostly directed towards the wake direction, where the mixture of decane/air is already fuel-rich. The ejected ethanol vapour (a secondary fuel) makes the mixture richer locally, and extends the wake in the downstream, but the width of the wake is not much affected in the side transverse direction.
$z$
side in figure 4(b), only gaseous ethanol vapour is ejected and no liquid fragmentation occurs. The ejection is mostly directed towards the wake direction, where the mixture of decane/air is already fuel-rich. The ejected ethanol vapour (a secondary fuel) makes the mixture richer locally, and extends the wake in the downstream, but the width of the wake is not much affected in the side transverse direction.

Figure 7. Temporal evolution of puffing. The frame rate is 4000 f.p.s.. The blend composition is decane 60 % and bioethanol 40 % in volume fraction. In (c), the ejecting ethanol vapour is outlined by the dashed lines. Puffing is repeated during the droplet lifetime.
The ejection velocity is examined, since it is related to the trajectory of an ethanol vapour pocket discussed in § 4.3.1. Although the bubble growth inside the parent droplet is quasi-steady, the ejection process is rather rapid and unsteady after a hole is generated. Figure 6 shows the sequence of the velocity field for the ejection in the lower $z$
side. At
$z$
side. At $t=10.56~{\rm\mu}\text{s}$
(figure 6
a), the ejection hole opens and ethanol vapour starts to come out. At
$t=10.56~{\rm\mu}\text{s}$
(figure 6
a), the ejection hole opens and ethanol vapour starts to come out. At $t=11.22~{\rm\mu}\text{s}$
(figure 6
b), the ethanol vapour jet is accelerating. As schematically shown in figure 5, the periphery of the hole is shrinking due to surface tension and the hole is becoming larger quickly afterwards. At
$t=11.22~{\rm\mu}\text{s}$
(figure 6
b), the ethanol vapour jet is accelerating. As schematically shown in figure 5, the periphery of the hole is shrinking due to surface tension and the hole is becoming larger quickly afterwards. At $t=11.88~{\rm\mu}\text{s}$
(figure 6
c), the magnitude of the ejection velocity is at maximum and the bubble size has become smaller. Finally, at
$t=11.88~{\rm\mu}\text{s}$
(figure 6
c), the magnitude of the ejection velocity is at maximum and the bubble size has become smaller. Finally, at $t=13.20~{\rm\mu}\text{s}$
(figure 6
d), the jet stops as most of the ethanol vapour has ejected out. The jet velocity magnitude can be estimated from the vapour pressure
$t=13.20~{\rm\mu}\text{s}$
(figure 6
d), the jet stops as most of the ethanol vapour has ejected out. The jet velocity magnitude can be estimated from the vapour pressure $p_{V}$
of the bubble by using the quasi-steady Rayleigh–Plesset equation. The Rayleigh–Plesset equation predicts the growth of a spherical bubble and can be written as (Rayleigh Reference Rayleigh1917; Plesset & Zwick Reference Plesset and Zwick1954; Mikic Rohsenow & Griffith Reference Mikic, Rohsenow and Griffith1970)
$p_{V}$
of the bubble by using the quasi-steady Rayleigh–Plesset equation. The Rayleigh–Plesset equation predicts the growth of a spherical bubble and can be written as (Rayleigh Reference Rayleigh1917; Plesset & Zwick Reference Plesset and Zwick1954; Mikic Rohsenow & Griffith Reference Mikic, Rohsenow and Griffith1970)
 $$\begin{eqnarray}R\ddot{R}+(3/2){\dot{R}}^{2}=(p_{V}-p_{0})/{\it\rho}_{L}-2{\it\sigma}/{\it\rho}_{L}R,\end{eqnarray}$$
where $R$
is the bubble radius,
$R$
is the bubble radius, ${\dot{R}}=\text{d}R/\text{d}t$
,
${\dot{R}}=\text{d}R/\text{d}t$
, $\ddot{R}=\text{d}^{2}R/\text{d}t^{2}$
,
$\ddot{R}=\text{d}^{2}R/\text{d}t^{2}$
, $p_{0}$
is the ambient pressure,
$p_{0}$
is the ambient pressure, ${\it\rho}_{L}$
is the liquid density and
${\it\rho}_{L}$
is the liquid density and ${\it\sigma}$
is the surface tension coefficient. It should be stressed that the prediction of the Rayleigh–Plesset equation for the bubble growth is only used for comparison with the DNS results. In the DNS, the bubble growth is directly resolved. Although the actual bubble shape is not perfectly spherical, the result below indicates that the effect of non-sphericity is minor in the estimation. Assuming a quasi-steady balance between the pressure difference and the surface tension, the vapour pressure is
${\it\sigma}$
is the surface tension coefficient. It should be stressed that the prediction of the Rayleigh–Plesset equation for the bubble growth is only used for comparison with the DNS results. In the DNS, the bubble growth is directly resolved. Although the actual bubble shape is not perfectly spherical, the result below indicates that the effect of non-sphericity is minor in the estimation. Assuming a quasi-steady balance between the pressure difference and the surface tension, the vapour pressure is $p_{V}\sim p_{0}+2{\it\sigma}/R$
. The estimated pressure difference is
$p_{V}\sim p_{0}+2{\it\sigma}/R$
. The estimated pressure difference is $p_{V}-p_{0}\sim 2{\it\sigma}/R=4.8~\text{kPa}$
, with
$p_{V}-p_{0}\sim 2{\it\sigma}/R=4.8~\text{kPa}$
, with ${\it\sigma}\sim 9\times 10^{-3}~\text{N}~\text{m}^{-1}$
and
${\it\sigma}\sim 9\times 10^{-3}~\text{N}~\text{m}^{-1}$
and $R\sim 0.25D$
, which is in good agreement with the observed pressure difference
$R\sim 0.25D$
, which is in good agreement with the observed pressure difference $p_{V}-p_{0}\sim 4.9~\text{kPa}$
in the present DNS just before the droplet rupture. Using
$p_{V}-p_{0}\sim 4.9~\text{kPa}$
in the present DNS just before the droplet rupture. Using ${\it\rho}_{V}U_{jet}^{2}/2=p_{V}-p_{0}$
, the jet velocity is
${\it\rho}_{V}U_{jet}^{2}/2=p_{V}-p_{0}$
, the jet velocity is $U_{jet}=\sqrt{2(p_{V}-p_{0})/{\it\rho}_{V}}\sim \sqrt{4{\it\sigma}/{\it\rho}_{V}R}$
. Using the observed representative values in the DNS,
$U_{jet}=\sqrt{2(p_{V}-p_{0})/{\it\rho}_{V}}\sim \sqrt{4{\it\sigma}/{\it\rho}_{V}R}$
. Using the observed representative values in the DNS, $p_{V}-p_{0}\sim 4.9~\text{kPa}$
,
$p_{V}-p_{0}\sim 4.9~\text{kPa}$
, ${\it\sigma}\sim 9\times 10^{-3}~\text{N}~\text{m}^{-1}$
,
${\it\sigma}\sim 9\times 10^{-3}~\text{N}~\text{m}^{-1}$
, ${\it\rho}_{V}\sim 13.9~\text{kg}~\text{m}^{-3}$
,
${\it\rho}_{V}\sim 13.9~\text{kg}~\text{m}^{-3}$
, $R\sim 0.25D$
, the jet velocity is estimated to be
$R\sim 0.25D$
, the jet velocity is estimated to be $U_{jet}=26~\text{m}~\text{s}^{-1}$
, which is close to the observed magnitude of
$U_{jet}=26~\text{m}~\text{s}^{-1}$
, which is close to the observed magnitude of $U_{jet}\sim 20~\text{m}~\text{s}^{-1}$
in figure 6. When puffing is accompanied by ligaments or liquid fragments, as in the ejection in the upper
$U_{jet}\sim 20~\text{m}~\text{s}^{-1}$
in figure 6. When puffing is accompanied by ligaments or liquid fragments, as in the ejection in the upper $z$
region in figure 4, the estimation of the jet velocity is more complicated, but the puffing dynamics is the same.
$z$
region in figure 4, the estimation of the jet velocity is more complicated, but the puffing dynamics is the same.
The puffing dynamics has been also visualised as direct images in our experiment (Avulapati et al.
Reference Avulapati, Ganippa, Xia and Megaritis2016), as shown in figure 7, for a decane/bioethanol droplet. Similarly to figure 1, a droplet of $D=2~\text{mm}$
is suspended on a fibre under combustion conditions. This figure is only used for qualitative comparison. In figure 7(a), some part of the embedded liquid ethanol has already become gaseous ethanol vapour by boiling. In figure 7(c), the ethanol vapour ejects towards the lower-right direction. Since it is difficult to see the ethanol vapour in this photo, the dashed lines are added to outline the vapour pocket. Ligament ejection is observed after the ethanol vapour ejection as a result of the recoiling motion, as shown in figure 7(e). The puffing and after-puffing dynamics is similar to the simulation result shown in figure 4. This indicates that the present numerical results reproduce the dynamics of puffing properly, although it should be pointed out that the fibre used to anchor the droplet has an influence on nucleation, and the location and direction of boiled ethanol vapour ejection will also be affected. Therefore, the experimental result is only qualitatively referenced here.
$D=2~\text{mm}$
is suspended on a fibre under combustion conditions. This figure is only used for qualitative comparison. In figure 7(a), some part of the embedded liquid ethanol has already become gaseous ethanol vapour by boiling. In figure 7(c), the ethanol vapour ejects towards the lower-right direction. Since it is difficult to see the ethanol vapour in this photo, the dashed lines are added to outline the vapour pocket. Ligament ejection is observed after the ethanol vapour ejection as a result of the recoiling motion, as shown in figure 7(e). The puffing and after-puffing dynamics is similar to the simulation result shown in figure 4. This indicates that the present numerical results reproduce the dynamics of puffing properly, although it should be pointed out that the fibre used to anchor the droplet has an influence on nucleation, and the location and direction of boiled ethanol vapour ejection will also be affected. Therefore, the experimental result is only qualitatively referenced here.
As the number of boiling sub-droplets increases, the degree of breakup increases. Figure 8 shows the ethanol vapour ejection and droplet breakup dynamics for cases A3 and A4, where more ethanol sub-droplets boil compared with case A2 in figure 4. The boiling behaviour of each sub-droplet is similar to that seen in figure 4. If neighbouring vapour bubbles merge during the bubble growth, the vapour ejection becomes more intense (figure 8 a,b). As a result, the recoiling motion becomes intense and ligament ejection occurs, as shown in figure 8(b). Subsequently, secondary-droplet pinch-off occurs due to the surface tension effect. In case A4, where more ethanol sub-droplets boil than in case A3, the additional vapour bubbles near the side periphery of the parent droplet do not merge with other ethanol vapour bubbles, and thus the effect of the additional vapour ejection is found to be minor, as indicated by the comparison between figures 8(b) and 8(c). This is similar for case A5. Therefore, in §§ 4.2.3 and 4.2.4, A2 and A3 are chosen as two representative multi-nucleation cases for further analysis of vapour mixing due to puffing.

Figure 8. Puffing dynamics in cases A3 and A4. See figure 4 for the meaning of surface colours. The direction of the ejected vapour clouds is inclined towards the $+xz$
direction. The solid rectangle in (a) shows the region where detailed analysis of puffing effects on mixing will be conducted in § 4.2.4: (a)
$+xz$
direction. The solid rectangle in (a) shows the region where detailed analysis of puffing effects on mixing will be conducted in § 4.2.4: (a) $t=10.56~{\rm\mu}\text{s}$
(case A3); (b)
$t=10.56~{\rm\mu}\text{s}$
(case A3); (b) $t=13.20~{\rm\mu}\text{s}$
(case A3); (c)
$t=13.20~{\rm\mu}\text{s}$
(case A3); (c) $t=13.20~{\rm\mu}\text{s}$
(case A4).
$t=13.20~{\rm\mu}\text{s}$
(case A4).

Figure 9. Increase of the liquid surface area due to puffing. Boiling is initiated at $t=5.5~{\rm\mu}\text{s}$
;
$t=5.5~{\rm\mu}\text{s}$
; $S_{0}$
is the initial surface area of the droplet.
$S_{0}$
is the initial surface area of the droplet.
The profiles of the liquid surface area for cases A1–A5 are plotted in figure 9. For all of the cases, boiling is initiated at $t=5.5~{\rm\mu}\text{s}$
. As the boiling progresses, the droplet breakup increases the liquid surface area. Generally, breakup of the parent emulsion droplet becomes more intense as the number of boiling sub-droplets increases. A large increase in the surface area of cases A2 and A3 indicates that the bubble merging motion has induced large breakup, as shown in figure 8. A relatively small difference in the surface area between A3 and A4 (and also A5) also confirms the limited effect of additional ethanol vapour ejection in cases A4 and A5, as stated above.
$t=5.5~{\rm\mu}\text{s}$
. As the boiling progresses, the droplet breakup increases the liquid surface area. Generally, breakup of the parent emulsion droplet becomes more intense as the number of boiling sub-droplets increases. A large increase in the surface area of cases A2 and A3 indicates that the bubble merging motion has induced large breakup, as shown in figure 8. A relatively small difference in the surface area between A3 and A4 (and also A5) also confirms the limited effect of additional ethanol vapour ejection in cases A4 and A5, as stated above.
4.2 Effects of puffing on fuel/air mixing
4.2.1 Mixture fraction $Z$
and scalar dissipation rate
${\it\chi}$
$Z$
and scalar dissipation rate
${\it\chi}$


The mixture fraction $Z$
and the dissipation rate of the mixture fraction, or the scalar dissipation rate (SDR),
$Z$
and the dissipation rate of the mixture fraction, or the scalar dissipation rate (SDR), ${\it\chi}$
quantify the mixing and micromixing of the reactants in the gas phase respectively, and are two key variables in a variety of non-premixed flame models. In the present study, two mixture fractions
${\it\chi}$
quantify the mixing and micromixing of the reactants in the gas phase respectively, and are two key variables in a variety of non-premixed flame models. In the present study, two mixture fractions $Z_{1}$
and
$Z_{1}$
and $Z_{2}$
are used to describe the mixing of the vapour of the primary fuel decane and the secondary fuel ethanol with air. They are defined as
$Z_{2}$
are used to describe the mixing of the vapour of the primary fuel decane and the secondary fuel ethanol with air. They are defined as
 $$\begin{eqnarray}Z_{i}=(Y_{i}-Y_{i,0})/(Y_{i,1}-Y_{i,0}),\quad i=1,2,\end{eqnarray}$$
where $Y_{i}$
is the mass fraction of species
$Y_{i}$
is the mass fraction of species $i$
. Setting
$i$
. Setting $Y_{i,0}=0$
in the far field and
$Y_{i,0}=0$
in the far field and $Y_{i,1}=1$
at the droplet centre, the mixture fraction
$Y_{i,1}=1$
at the droplet centre, the mixture fraction $Z_{i}$
reduces to the fuel mass fraction
$Z_{i}$
reduces to the fuel mass fraction $Y_{F,i}$
(Zoby et al.
Reference Zoby, Navarro-Martinez, Kronenburg and Marquis2011a
), namely
$Y_{F,i}$
(Zoby et al.
Reference Zoby, Navarro-Martinez, Kronenburg and Marquis2011a
), namely $Z_{1}=Y_{decane}$
and
$Z_{1}=Y_{decane}$
and $Z_{2}=Y_{ethanol}$
in the gas phase. Without chemical reactions, the transport equation for each mixture fraction in the physical space
$Z_{2}=Y_{ethanol}$
in the gas phase. Without chemical reactions, the transport equation for each mixture fraction in the physical space $x_{i}$
is
$x_{i}$
is
 $$\begin{eqnarray}\frac{\partial }{\partial t}({\it\rho}Z_{i})+\frac{\partial }{\partial x_{j}}({\it\rho}u_{j}Z_{i})=\frac{\partial }{\partial x_{j}}\left[{\it\rho}D_{dif}\left(\frac{\partial Z_{i}}{\partial x_{j}}\right)\right]+S_{Z_{i}},\end{eqnarray}$$
where $S_{Z_{i}}$
is the evaporation source term. Conversion into the
$S_{Z_{i}}$
is the evaporation source term. Conversion into the $Z$
space, following the framework of the flamelet model, yields (Peters Reference Peters2000; Hasse & Peters Reference Hasse and Peters2005; Zoby et al.
Reference Zoby, Navarro-Martinez, Kronenburg and Marquis2011a
)
$Z$
space, following the framework of the flamelet model, yields (Peters Reference Peters2000; Hasse & Peters Reference Hasse and Peters2005; Zoby et al.
Reference Zoby, Navarro-Martinez, Kronenburg and Marquis2011a
)
 $$\begin{eqnarray}{\it\rho}\frac{\partial Y_{i}}{\partial t}-\frac{{\it\rho}}{2Le_{i}}\left({\it\chi}_{1}\frac{\partial ^{2}Y_{i}}{\partial Z_{1}^{2}}+2{\it\chi}_{12}\frac{\partial ^{2}Y_{i}}{\partial Z_{1}\partial Z_{2}}+{\it\chi}_{2}\frac{\partial ^{2}Y_{i}}{\partial Z_{2}^{2}}\right)=S_{Y_{i}},\end{eqnarray}$$
where $Le_{i}={\it\lambda}_{i}/{\it\rho}c_{p,i}D_{dif}$
is the Lewis number of species
$Le_{i}={\it\lambda}_{i}/{\it\rho}c_{p,i}D_{dif}$
is the Lewis number of species $i$
and
$i$
and $S_{Y_{i}}$
is the evaporation source term. A similar equation can be derived for the temperature
$S_{Y_{i}}$
is the evaporation source term. A similar equation can be derived for the temperature $T$
(Hasse & Peters Reference Hasse and Peters2005). In these equations, the SDRs characterise the diffusion effect. They are defined as
$T$
(Hasse & Peters Reference Hasse and Peters2005). In these equations, the SDRs characterise the diffusion effect. They are defined as
 $$\begin{eqnarray}\displaystyle {\it\chi}_{1} & = & \displaystyle 2D_{dif}|\boldsymbol{{\rm\nabla}}Z_{1}|^{2},\end{eqnarray}$$
 $$\begin{eqnarray}\displaystyle {\it\chi}_{2} & = & \displaystyle 2D_{dif}|\boldsymbol{{\rm\nabla}}Z_{2}|^{2},\end{eqnarray}$$
 $$\begin{eqnarray}\displaystyle {\it\chi}_{12} & = & \displaystyle 2D_{dif}(\boldsymbol{{\rm\nabla}}Z_{1}\boldsymbol{\cdot }\boldsymbol{{\rm\nabla}}Z_{2}).\end{eqnarray}$$ ${\it\chi}_{1}$
is governed by
${\it\chi}_{1}$
is governed by  $$\begin{eqnarray}\underbrace{\frac{\partial {\it\chi}_{1}}{\partial t}}_{\text{Rate of change}}=\underbrace{-\frac{1}{4}\left(\frac{\partial {\it\chi}_{1}}{\partial Z_{1}}\right)^{2}}_{\text{Dissipation}}+\underbrace{2a{\it\chi}_{1}}_{\text{Production}}+~\biggl(\underbrace{\frac{{\it\chi}_{1}}{2}\frac{\partial ^{2}{\it\chi}_{1}}{\partial Z_{1}^{2}}}_{\text{Diffusion}\,{-}\,{\it\chi}_{1}}+\underbrace{{\it\chi}_{12}\frac{\partial ^{2}{\it\chi}_{1}}{\partial Z_{1}\partial Z_{2}}}_{\text{Diffusion}\,{-}\,{\it\chi}_{12}}+\underbrace{\frac{{\it\chi}_{2}}{2}\frac{\partial ^{2}{\it\chi}_{1}}{\partial Z_{2}^{2}}}_{\text{Diffusion}\,{-}\,{\it\chi}_{2}}\biggr)+\underbrace{S_{{\it\chi}_{1}}}_{\text{Source}},\end{eqnarray}$$
where $a$
is the dominant compressive strain rate. The physical meaning of each term is shown in (4.6). The dissipation term is always negative. The compressive strain rate makes the local gradients steeper, which contributes positively to the rate of change of the SDR. Three diffusion terms exist since there are two fuels. The effect of the evaporation source term is confined in the vicinity of an evaporating/boiling liquid surface. An analogous equation can be formulated for
$a$
is the dominant compressive strain rate. The physical meaning of each term is shown in (4.6). The dissipation term is always negative. The compressive strain rate makes the local gradients steeper, which contributes positively to the rate of change of the SDR. Three diffusion terms exist since there are two fuels. The effect of the evaporation source term is confined in the vicinity of an evaporating/boiling liquid surface. An analogous equation can be formulated for ${\it\chi}_{2}$
. It is clear from (4.4) and (4.6) that the additional terms due to the dissipation rate
${\it\chi}_{2}$
. It is clear from (4.4) and (4.6) that the additional terms due to the dissipation rate ${\it\chi}_{2}$
and cross-SDR
${\it\chi}_{2}$
and cross-SDR ${\it\chi}_{12}$
quantify the direct puffing effects on the mixing and micromixing of the vapour of the primary fuel decane with air.
${\it\chi}_{12}$
quantify the direct puffing effects on the mixing and micromixing of the vapour of the primary fuel decane with air.

Figure 10. Comparison between DNS results and model predictions of the conditional mean SDR in the downstream laminar wake of the emulsion droplet. For the scatter plot, each dot represents a value at a grid point along the line. The dashed line represents $F(Z)$
and the solid line in (b) represents
$F(Z)$
and the solid line in (b) represents $S(Z)$
: (a) locations of examined lines; (b)
$S(Z)$
: (a) locations of examined lines; (b) $l_{1}=2.3D$
; (c)
$l_{1}=2.3D$
; (c) $l_{2}=1.3D$
.
$l_{2}=1.3D$
.
4.2.2 Decane-vapour/air mixing field before puffing
First, the decane-vapour distribution before puffing is examined ( $Z_{2}={\it\chi}_{2}={\it\chi}_{12}=0$
). The data samples are taken from a line in the transverse direction at two downstream positions of
$Z_{2}={\it\chi}_{2}={\it\chi}_{12}=0$
). The data samples are taken from a line in the transverse direction at two downstream positions of $l_{1}=2.3D$
and
$l_{1}=2.3D$
and $l_{2}=1.3D$
from the droplet centre, as shown in figure 10(a). It is known that the fuel-vapour field in the
$l_{2}=1.3D$
from the droplet centre, as shown in figure 10(a). It is known that the fuel-vapour field in the $Z$
space in the wake of a droplet takes a similar form to the gaseous fuel field of a laminar diffusion flame in the
$Z$
space in the wake of a droplet takes a similar form to the gaseous fuel field of a laminar diffusion flame in the $Z$
space (Zoby et al.
Reference Zoby, Navarro-Martinez, Kronenburg and Marquis2011a
). The conditional mean
$Z$
space (Zoby et al.
Reference Zoby, Navarro-Martinez, Kronenburg and Marquis2011a
). The conditional mean $\langle {\it\chi}_{1}\mid Z_{1}\rangle$
, or simplified as
$\langle {\it\chi}_{1}\mid Z_{1}\rangle$
, or simplified as $\langle {\it\chi}\mid Z\rangle$
in this subsection, downstream of an evaporating fuel droplet has been modelled using an error function profile as (Peters Reference Peters2000; Hasse & Peters Reference Hasse and Peters2005; Zoby et al.
Reference Zoby, Navarro-Martinez, Kronenburg and Marquis2011a
)
$\langle {\it\chi}\mid Z\rangle$
in this subsection, downstream of an evaporating fuel droplet has been modelled using an error function profile as (Peters Reference Peters2000; Hasse & Peters Reference Hasse and Peters2005; Zoby et al.
Reference Zoby, Navarro-Martinez, Kronenburg and Marquis2011a
)
 $$\begin{eqnarray}\langle {\it\chi}\mid Z\rangle \sim F(Z)\sim {\it\chi}_{ref}\exp (-2[\text{erfc}^{-1}(2Z/Z_{max})]^{2}),\end{eqnarray}$$
where ${\it\chi}_{ref}$
is a reference value,
${\it\chi}_{ref}$
is a reference value, $\text{erfc}^{-1}$
is the inverse complementary error function and
$\text{erfc}^{-1}$
is the inverse complementary error function and $Z_{max}$
is the maximum mixture fraction value. Another proposed model is (Zoby et al.
Reference Zoby, Navarro-Martinez, Kronenburg and Marquis2011a
)
$Z_{max}$
is the maximum mixture fraction value. Another proposed model is (Zoby et al.
Reference Zoby, Navarro-Martinez, Kronenburg and Marquis2011a
)
 $$\begin{eqnarray}\langle {\it\chi}\mid Z\rangle \sim S(Z)=8D_{dif}{\it\alpha}[Z^{2}\ln (A/Z)],\end{eqnarray}$$
where ${\it\alpha}=U/4D_{dif}l$
,
${\it\alpha}=U/4D_{dif}l$
, $A={\dot{m}}_{d}(Z_{d}-Z_{\infty })/4{\rm\pi}{\it\rho}D_{dif}l$
,
$A={\dot{m}}_{d}(Z_{d}-Z_{\infty })/4{\rm\pi}{\it\rho}D_{dif}l$
, ${\dot{m}}_{d}$
is the mass evaporation rate,
${\dot{m}}_{d}$
is the mass evaporation rate, $Z_{d}$
and
$Z_{d}$
and $Z_{\infty }$
are the mixture fractions inside and far from the droplet respectively, and
$Z_{\infty }$
are the mixture fractions inside and far from the droplet respectively, and $l$
is the streamwise distance of the considered location from the droplet centre. This solution is based on the assumption
$l$
is the streamwise distance of the considered location from the droplet centre. This solution is based on the assumption
 $$\begin{eqnarray}Z=Z_{\infty }+A\exp (-{\it\alpha}r_{tr}^{2}),\end{eqnarray}$$
where $r_{tr}$
is the transverse distance from the droplet centre.
$r_{tr}$
is the transverse distance from the droplet centre.
Figure 10(b) shows the comparison of the observed $Z$
–
$Z$
– ${\it\chi}$
correlation for decane from the DNS results and the fitted
${\it\chi}$
correlation for decane from the DNS results and the fitted $F(Z)$
and
$F(Z)$
and $S(Z)$
at
$S(Z)$
at $l_{1}=2.3D$
in case A2. Both the
$l_{1}=2.3D$
in case A2. Both the $F(Z)$
and
$F(Z)$
and $S(Z)$
curves are in good agreement with the DNS results, and
$S(Z)$
curves are in good agreement with the DNS results, and $F(Z)$
shows slightly better agreement with regard to its curve shape. At a closer distance of
$F(Z)$
shows slightly better agreement with regard to its curve shape. At a closer distance of $l_{2}=1.3D$
, the observed
$l_{2}=1.3D$
, the observed $Z$
–
$Z$
– ${\it\chi}$
correlation and the
${\it\chi}$
correlation and the $F(Z)$
curve again show good agreement. This indicates that the two models, especially
$F(Z)$
curve again show good agreement. This indicates that the two models, especially $F(Z)$
, can properly predict the fuel/air mixing before puffing occurs. This information is used as a reference for the following discussion.
$F(Z)$
, can properly predict the fuel/air mixing before puffing occurs. This information is used as a reference for the following discussion.
4.2.3 Weak puffing effects on mixing
Puffing of boiled vapour of the secondary fuel ethanol is expected to enhance the gas-phase mixing in both space and time. Here, effects of weak puffing, with no ejection of liquid fragments, on mixing are first investigated. Since the primary fuel is decane, puffing effects on ${\it\chi}_{1}$
and
${\it\chi}_{1}$
and $Z_{1}$
are of particular interest. The data samples taken for analysis in this section are from the rectangular region in figure 4(b) in case A2. For this case, most of the ethanol vapour is ejected into the decane-rich wake region, and the shape of the stoichiometric mixture fraction (
$Z_{1}$
are of particular interest. The data samples taken for analysis in this section are from the rectangular region in figure 4(b) in case A2. For this case, most of the ethanol vapour is ejected into the decane-rich wake region, and the shape of the stoichiometric mixture fraction ( $Z_{st}$
) isosurface is not strongly affected during the puffing. However, the ethanol vapour strongly affects the production of decane vapour from the parent droplet surface. It is therefore important and interesting to investigate the ethanol vapour puffing effects on the local fuel/air mixing.
$Z_{st}$
) isosurface is not strongly affected during the puffing. However, the ethanol vapour strongly affects the production of decane vapour from the parent droplet surface. It is therefore important and interesting to investigate the ethanol vapour puffing effects on the local fuel/air mixing.
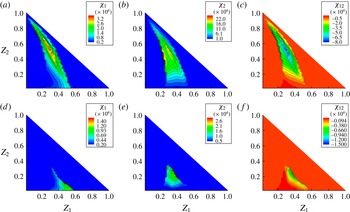
Figure 11. Doubly conditional mean SDRs $\langle {\it\chi}_{1}\mid Z_{1},Z_{2}\rangle$
,
$\langle {\it\chi}_{1}\mid Z_{1},Z_{2}\rangle$
, $\langle {\it\chi}_{2}\mid Z_{1},Z_{2}\rangle$
and
$\langle {\it\chi}_{2}\mid Z_{1},Z_{2}\rangle$
and $\langle {\it\chi}_{12}\mid Z_{1},Z_{2}\rangle ~(\text{s}^{-1})$
for case A2. It should be noted that the contour legends are different. Data points only exist in
$\langle {\it\chi}_{12}\mid Z_{1},Z_{2}\rangle ~(\text{s}^{-1})$
for case A2. It should be noted that the contour legends are different. Data points only exist in $Z_{1}+Z_{2}\leqslant 1$
by definition: (a–c)
$Z_{1}+Z_{2}\leqslant 1$
by definition: (a–c) $t=11.88~{\rm\mu}\text{s}$
; (d–f)
$t=11.88~{\rm\mu}\text{s}$
; (d–f) $t=13.20~{\rm\mu}\text{s}$
.
$t=13.20~{\rm\mu}\text{s}$
.
Figure 11 shows the SDRs doubly conditioned on $Z_{1}$
and
$Z_{1}$
and $Z_{2}$
,
$Z_{2}$
, $\langle {\it\chi}_{1}\mid Z_{1},Z_{2}\rangle$
and
$\langle {\it\chi}_{1}\mid Z_{1},Z_{2}\rangle$
and $\langle {\it\chi}_{2}\mid Z_{1},Z_{2}\rangle$
, and the cross-SDR,
$\langle {\it\chi}_{2}\mid Z_{1},Z_{2}\rangle$
, and the cross-SDR, $\langle {\it\chi}_{12}\mid Z_{1},Z_{2}\rangle$
, at
$\langle {\it\chi}_{12}\mid Z_{1},Z_{2}\rangle$
, at $t=11.88~{\rm\mu}\text{s}$
when the puffing is most intense (figure 4
b), and at
$t=11.88~{\rm\mu}\text{s}$
when the puffing is most intense (figure 4
b), and at $t=13.20~{\rm\mu}\text{s}$
when puffing-enhanced mixing has progressed further (figure 4
c). It should be noted that the upper limit of the mixture fractions in the figure is bounded by
$t=13.20~{\rm\mu}\text{s}$
when puffing-enhanced mixing has progressed further (figure 4
c). It should be noted that the upper limit of the mixture fractions in the figure is bounded by $Z_{1}+Z_{2}=1$
by definition. Immediately after the ejection starts,
$Z_{1}+Z_{2}=1$
by definition. Immediately after the ejection starts, ${\it\chi}_{1}$
and
${\it\chi}_{1}$
and ${\it\chi}_{2}$
increase, as shown in figure 11(a–c). Cross-mixing of the decane and ethanol fuel vapour is also evident, as
${\it\chi}_{2}$
increase, as shown in figure 11(a–c). Cross-mixing of the decane and ethanol fuel vapour is also evident, as ${\it\chi}_{12}$
is negative. The SDRs in the region of large values of
${\it\chi}_{12}$
is negative. The SDRs in the region of large values of $Z_{2}$
are due to the ethanol vapour ejection and those in the region of large values of
$Z_{2}$
are due to the ethanol vapour ejection and those in the region of large values of $Z_{1}$
are due to the evaporation of decane from the parent droplet. The distributions of
$Z_{1}$
are due to the evaporation of decane from the parent droplet. The distributions of ${\it\chi}_{1}$
and
${\it\chi}_{1}$
and ${\it\chi}_{2}$
are qualitatively symmetric in this region where weak puffing occurs. As the mixing progresses further, the magnitude of the SDRs decreases, as shown in figure 11(d–f) at
${\it\chi}_{2}$
are qualitatively symmetric in this region where weak puffing occurs. As the mixing progresses further, the magnitude of the SDRs decreases, as shown in figure 11(d–f) at $t=13.20~{\rm\mu}\text{s}$
.
$t=13.20~{\rm\mu}\text{s}$
.

Figure 12. Puffing-enhanced micromixing and detailed budget analysis for case A2. The thick lines show profiles at $t=11.88~{\rm\mu}\text{s}$
and the thin lines at
$t=11.88~{\rm\mu}\text{s}$
and the thin lines at $t=13.20~{\rm\mu}\text{s}$
: (a)
$t=13.20~{\rm\mu}\text{s}$
: (a) $\langle {\it\chi}_{1}\mid Z_{1}\rangle$
; (b) contribution of each right-hand side term.
$\langle {\it\chi}_{1}\mid Z_{1}\rangle$
; (b) contribution of each right-hand side term.
To focus on puffing effects on the mixing of the primary fuel decane with air, the mean SDR conditioned on $Z_{1}$
,
$Z_{1}$
, $\langle {\it\chi}_{1}\mid Z_{1}\rangle$
, is shown in figure 12(a). By comparing figure 12(a) with figures 10(b) and 10(c), in which
$\langle {\it\chi}_{1}\mid Z_{1}\rangle$
, is shown in figure 12(a). By comparing figure 12(a) with figures 10(b) and 10(c), in which $\langle {\it\chi}_{1}\mid Z_{1}\rangle$
is presented before puffing occurs, two conclusions are evident. First,
$\langle {\it\chi}_{1}\mid Z_{1}\rangle$
is presented before puffing occurs, two conclusions are evident. First, $\langle {\it\chi}_{1}\mid Z_{1}\rangle$
during the puffing cannot be approximated by
$\langle {\it\chi}_{1}\mid Z_{1}\rangle$
during the puffing cannot be approximated by $F(Z)$
or
$F(Z)$
or $S(Z)$
. Second, the magnitude of
$S(Z)$
. Second, the magnitude of $\langle {\it\chi}_{1}\mid Z_{1}\rangle$
has increased by one to two orders of magnitude after puffing, demonstrating that the micromixing has been considerably enhanced by puffing. At
$\langle {\it\chi}_{1}\mid Z_{1}\rangle$
has increased by one to two orders of magnitude after puffing, demonstrating that the micromixing has been considerably enhanced by puffing. At $t=11.88~{\rm\mu}\text{s}$
, enhanced mixing due to the ejected ethanol vapour is evident in
$t=11.88~{\rm\mu}\text{s}$
, enhanced mixing due to the ejected ethanol vapour is evident in $Z_{1}=0.1$
–
$Z_{1}=0.1$
– $0.25$
. The other peak in the region of large values of
$0.25$
. The other peak in the region of large values of $Z_{1}$
is due to the evaporation of decane from the parent droplet. At
$Z_{1}$
is due to the evaporation of decane from the parent droplet. At $t=13.20~{\rm\mu}\text{s}$
, the puffing jet has already stopped (figure 6
d) and
$t=13.20~{\rm\mu}\text{s}$
, the puffing jet has already stopped (figure 6
d) and ${\it\chi}_{1}$
is much smaller, which indicates that puffing-induced mixing has weakened. Therefore, puffing enhances mixing in a short period of the ethanol vapour ejection.
${\it\chi}_{1}$
is much smaller, which indicates that puffing-induced mixing has weakened. Therefore, puffing enhances mixing in a short period of the ethanol vapour ejection.
To better understand puffing effects on mixing in quantified detail, budget analysis of the conditionally averaged (4.6) is performed. The contributions of each conditionally averaged right-hand side term to the rate of change $\partial \langle {\it\chi}_{1}\mid Z_{1}\rangle /\partial t$
are shown in figure 12(b). Such an analysis will shed crucial light on how puffing would affect the modelling of
$\partial \langle {\it\chi}_{1}\mid Z_{1}\rangle /\partial t$
are shown in figure 12(b). Such an analysis will shed crucial light on how puffing would affect the modelling of $\langle {\it\chi}_{1}\mid Z_{1}\rangle$
in the framework of the conditional moment closure (CMC) approach. These budget terms are conditionally averaged in the indicated region in figure 4(b), excluding the region within
$\langle {\it\chi}_{1}\mid Z_{1}\rangle$
in the framework of the conditional moment closure (CMC) approach. These budget terms are conditionally averaged in the indicated region in figure 4(b), excluding the region within $5{\rm\Delta}x$
of the liquid surface of the parent droplet to remove the local peak evaporation source terms for clarity. The production term
$5{\rm\Delta}x$
of the liquid surface of the parent droplet to remove the local peak evaporation source terms for clarity. The production term $2a{\it\chi}_{1}$
in (4.6) is approximated as
$2a{\it\chi}_{1}$
in (4.6) is approximated as $2S{\it\chi}_{1}$
, where
$2S{\it\chi}_{1}$
, where $S$
is the norm of the strain rate tensor
$S$
is the norm of the strain rate tensor $\unicode[STIX]{x1D61A}_{ij}=(1/2)(\partial u_{i}/\partial x_{j}+\partial u_{j}/\partial x_{i})$
.
$\unicode[STIX]{x1D61A}_{ij}=(1/2)(\partial u_{i}/\partial x_{j}+\partial u_{j}/\partial x_{i})$
.
As can be seen in figure 12(b), the dissipation term is negative by definition, and its magnitude is small. One leading positive contribution is from the production term due to the strong strain rate of the ejecting ethanol vapour jet (figure 6). It is interesting to note that the cross-diffusion due to ${\it\chi}_{12}$
is another strong source that is comparable to the production term. This indicates that puffing-induced cross-diffusion of the primary and secondary fuels works to increase the magnitude of
${\it\chi}_{12}$
is another strong source that is comparable to the production term. This indicates that puffing-induced cross-diffusion of the primary and secondary fuels works to increase the magnitude of ${\it\chi}_{1}$
in the full spectrum of
${\it\chi}_{1}$
in the full spectrum of $Z_{1}$
. The other two diffusion terms related to
$Z_{1}$
. The other two diffusion terms related to ${\it\chi}_{1}$
and
${\it\chi}_{1}$
and ${\it\chi}_{2}$
are negative, which represents a normal diffusion process. At
${\it\chi}_{2}$
are negative, which represents a normal diffusion process. At $t=11.88~{\rm\mu}\text{s}$
, the puffing motion is strong with mixing in progress. The net contribution of all of the right-hand side terms in figure 12(b) is negative, which decreases
$t=11.88~{\rm\mu}\text{s}$
, the puffing motion is strong with mixing in progress. The net contribution of all of the right-hand side terms in figure 12(b) is negative, which decreases ${\it\chi}_{1}$
. Later, at
${\it\chi}_{1}$
. Later, at $t=13.20~{\rm\mu}\text{s}$
, the magnitudes of these terms are smaller, which means that the puffing jet has stopped and the fuel/air mixing has progressed further.
$t=13.20~{\rm\mu}\text{s}$
, the magnitudes of these terms are smaller, which means that the puffing jet has stopped and the fuel/air mixing has progressed further.

Figure 13. Doubly conditional mean SDRs $\langle {\it\chi}_{1}\mid Z_{1},Z_{2}\rangle$
,
$\langle {\it\chi}_{1}\mid Z_{1},Z_{2}\rangle$
, $\langle {\it\chi}_{2}\mid Z_{1},Z_{2}\rangle$
and
$\langle {\it\chi}_{2}\mid Z_{1},Z_{2}\rangle$
and $\langle {\it\chi}_{12}\mid Z_{1},Z_{2}\rangle ~(\text{s}^{-1})$
for case A3. Data points only exist in
$\langle {\it\chi}_{12}\mid Z_{1},Z_{2}\rangle ~(\text{s}^{-1})$
for case A3. Data points only exist in $Z_{1}+Z_{2}\leqslant 1$
by definition: (a–c)
$Z_{1}+Z_{2}\leqslant 1$
by definition: (a–c) $t=9.24~{\rm\mu}\text{s}$
; (d–f)
$t=9.24~{\rm\mu}\text{s}$
; (d–f) $t=10.56~{\rm\mu}\text{s}$
.
$t=10.56~{\rm\mu}\text{s}$
.
4.2.4 Strong puffing effects on mixing accompanying ejection of liquid-fuel ligaments
In case A3, the ejecting vapour and ligaments interact with each other in the region shown by the rectangle in figure 8(a). This ejection is oriented towards the side transverse direction and strongly influences the shape of the stoichiometric mixture fraction isosurface (see § 4.3). Figure 13 shows the doubly conditional mean SDRs at $t=9.24~{\rm\mu}\text{s}$
and
$t=9.24~{\rm\mu}\text{s}$
and $t=10.56~{\rm\mu}\text{s}$
, corresponding to the initial and middle stages of the puffing. The distributions of the SDRs are similar to those in case A2, for example between figures 13(d–f) and 11(a–c). The magnitude of the SDRs is larger, since the puffing jet ejection motion is stronger than in case A2. One obvious difference between figures 13 and 11 is that the SDR values are more strongly disturbed in figure 13 due to multiple ejections and ejected liquid fragments.
$t=10.56~{\rm\mu}\text{s}$
, corresponding to the initial and middle stages of the puffing. The distributions of the SDRs are similar to those in case A2, for example between figures 13(d–f) and 11(a–c). The magnitude of the SDRs is larger, since the puffing jet ejection motion is stronger than in case A2. One obvious difference between figures 13 and 11 is that the SDR values are more strongly disturbed in figure 13 due to multiple ejections and ejected liquid fragments.
The conditional mean $\langle {\it\chi}_{1}\mid Z_{1}\rangle$
is shown in figure 14(a), and the budget analysis using (4.6) is presented in figure 14(b). Similar trends to those in figure 12 are found. One important difference in figure 14(b) compared with figure 12(b) is that the cross-scalar diffusion due to
$\langle {\it\chi}_{1}\mid Z_{1}\rangle$
is shown in figure 14(a), and the budget analysis using (4.6) is presented in figure 14(b). Similar trends to those in figure 12 are found. One important difference in figure 14(b) compared with figure 12(b) is that the cross-scalar diffusion due to ${\it\chi}_{12}$
now takes the dominant role in enhancing
${\it\chi}_{12}$
now takes the dominant role in enhancing $\langle {\it\chi}_{1}\mid Z_{1}\rangle$
, whereas in figure 12(b) the magnitudes of the production and cross-scalar diffusion are comparable.
$\langle {\it\chi}_{1}\mid Z_{1}\rangle$
, whereas in figure 12(b) the magnitudes of the production and cross-scalar diffusion are comparable.

Figure 14. Puffing-enhanced micromixing and detailed budget analysis for case A3. In (b), the thick lines show profiles at $t=9.24~{\rm\mu}\text{s}$
and the thin lines at
$t=9.24~{\rm\mu}\text{s}$
and the thin lines at $t=10.56~{\rm\mu}\text{s}$
. The magnitudes of the terms at
$t=10.56~{\rm\mu}\text{s}$
. The magnitudes of the terms at $t=13.20~{\rm\mu}\text{s}$
are small, and therefore their profiles are not plotted: (a)
$t=13.20~{\rm\mu}\text{s}$
are small, and therefore their profiles are not plotted: (a) $\langle {\it\chi}_{1}\mid Z_{1}\rangle$
; (b) contribution of each right-hand side term.
$\langle {\it\chi}_{1}\mid Z_{1}\rangle$
; (b) contribution of each right-hand side term.
Through the detailed analysis, it is clear that ejection of boiled ethanol vapour initially makes a strong stratification in the reactive fuel gas mixture of decane and air, followed by mixing that homogenises the stratification. This indicates that puffing, which is an intermittent ethanol vapour ejection motion, will change the local mixing characteristics around the emulsion droplet temporarily and spatially. In the next subsection, puffing effects on droplet grouping will be investigated.
4.3 Effects of puffing on droplet grouping
4.3.1 Region of influence of ejected ethanol vapour pockets
A flame around an evaporating fuel droplet is basically a non-premixed (diffusion) flame. The fuel vapour is supplied from the droplet surface and the oxidiser from the ambient air. The stoichiometric mixture fraction isosurface is determined by the mixing balance between the fuel and the oxidiser. The stoichiometric condition well represents the flame structure for non-premixed combustion. Therefore, in the present study it is indicative to investigate how puffing affects the stoichiometric mixture fraction isosurface. A variable transformation is useful to define the overall mixture fraction $Z$
and a mixing parameter
$Z$
and a mixing parameter $Y$
as (Hasse & Peters Reference Hasse and Peters2005)
$Y$
as (Hasse & Peters Reference Hasse and Peters2005)
 $$\begin{eqnarray}\displaystyle Z & = & \displaystyle Z_{1}+Z_{2},\end{eqnarray}$$
 $$\begin{eqnarray}\displaystyle Y & = & \displaystyle Z_{2}/(Z_{1}+Z_{2}).\end{eqnarray}$$
 $$\begin{eqnarray}\text{reactants}~(\text{C}_{10}\text{H}_{22},\text{C}_{2}\text{H}_{5}\text{OH},\text{O}_{2})\rightarrow \text{products}~(\text{CO}_{2},\text{H}_{2}\text{O}).\end{eqnarray}$$
For each location in the flow field, the gas composition is represented by $(Z,Y)$
. From mass conservation, the stoichiometric condition, where the fuels and oxygen are consumed in exact proportions, is given by
$(Z,Y)$
. From mass conservation, the stoichiometric condition, where the fuels and oxygen are consumed in exact proportions, is given by
 $$\begin{eqnarray}Z_{st}=0.01456/(0.23286-0.0879Y),\end{eqnarray}$$
where one degree of freedom ( $Y$
, which represents the ratio of the two fuels) remains.
$Y$
, which represents the ratio of the two fuels) remains.
Figure 15 shows the stoichiometric mixture fraction isosurface and streamlines for case A3 at three time instants. Initially, when the effect of puffing is limited, the stoichiometric surface surrounds the droplet almost axisymmetrically (figure 15 a). The fuel-rich area extends towards the wake direction due to the convective flow. After the ethanol ejection starts in the transverse direction, it is clear that the fuel-rich region is rapidly expanding in the transverse direction (figure 15 b,c). Although the ejection direction is not fully perpendicular to the air flow direction and is slightly inclined towards the downstream direction, the effect of puffing on expanding the stoichiometric surface is evident. The ejected ethanol vapour pocket gradually becomes affected by the momentum of the air flow, and the trajectory of the pocket becomes bent further downstream. In figure 15(c), the ethanol pocket has reached a few diameters away from the parent droplet surface in the transverse direction.

Figure 15. The stoichiometric mixture fraction isosurface and streamlines for case A3. The triangles indicate the positions of the centres of gravity of the ethanol vapour pockets for $r=3.3$
, corresponding to those shown in figure 16: (a)
$r=3.3$
, corresponding to those shown in figure 16: (a) $t=10.56~{\rm\mu}\text{s}$
; (b)
$t=10.56~{\rm\mu}\text{s}$
; (b) $t=13.20~{\rm\mu}\text{s}$
; (c)
$t=13.20~{\rm\mu}\text{s}$
; (c) $t=14.52~{\rm\mu}\text{s}$
.
$t=14.52~{\rm\mu}\text{s}$
.
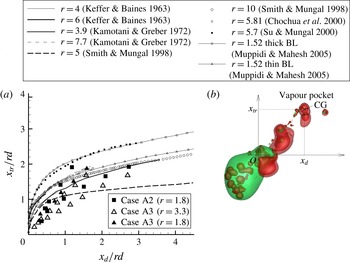
Figure 16. Comparison between trajectories of ejected ethanol vapour and jets in cross-flow. In the present cases, the position of the centre of gravity of a vapour pocket is plotted, as schematically shown in the figure; $O$
is defined as the location where vapour ejection starts. See also figure 15. Reference data are replotted from figures 1 and 8 in Muppidi & Mahesh (Reference Muppidi and Mahesh2005). For the two simulation cases from Muppidi & Mahesh (Reference Muppidi and Mahesh2005), the difference lies in the upstream boundary layer (BL) thickness.
$O$
is defined as the location where vapour ejection starts. See also figure 15. Reference data are replotted from figures 1 and 8 in Muppidi & Mahesh (Reference Muppidi and Mahesh2005). For the two simulation cases from Muppidi & Mahesh (Reference Muppidi and Mahesh2005), the difference lies in the upstream boundary layer (BL) thickness.
The trajectory of an ejected ethanol vapour pocket is determined by the convective effect. The convective length scale is ${\rm\Delta}l_{c}=U_{jet}{\rm\Delta}t$
and the diffusion length scale is
${\rm\Delta}l_{c}=U_{jet}{\rm\Delta}t$
and the diffusion length scale is ${\rm\Delta}l_{dif}=\sqrt{D_{dif}{\rm\Delta}t}$
during the time scale
${\rm\Delta}l_{dif}=\sqrt{D_{dif}{\rm\Delta}t}$
during the time scale ${\rm\Delta}t$
. With the estimation of
${\rm\Delta}t$
. With the estimation of ${\rm\Delta}t=1~{\rm\mu}\text{s}$
,
${\rm\Delta}t=1~{\rm\mu}\text{s}$
, $D_{dif}=1.0\times 10^{-5}~\text{m}^{2}~\text{s}^{-1}$
and
$D_{dif}=1.0\times 10^{-5}~\text{m}^{2}~\text{s}^{-1}$
and $U_{jet}=20~\text{m}~\text{s}^{-1}$
, the scale ratio is
$U_{jet}=20~\text{m}~\text{s}^{-1}$
, the scale ratio is ${\rm\Delta}l_{c}/{\rm\Delta}l_{dif}=6.3$
. Therefore, the convective effect is dominant compared with diffusion. This implies that the trajectory of an ethanol vapour pocket has a similarity to that of a jet in cross-flow (Keffer & Baines Reference Keffer and Baines1963; Kamotani & Greber Reference Kamotani and Greber1972; Broadwell & Breidenthal Reference Broadwell and Breidenthal1984; Smith & Mungal Reference Smith and Mungal1998; Chochua et al.
Reference Chochua, Shyy, Thakur, Brankovic, Lienau, Porter and Lischinsky2000; Su et al.
Reference Su, Han, Miraflor and Mungal2000; Muppidi & Mahesh Reference Muppidi and Mahesh2005). A correlation for the jet-in-cross-flow trajectory obtained by several experiments and simulations is known to scale with a power law as
${\rm\Delta}l_{c}/{\rm\Delta}l_{dif}=6.3$
. Therefore, the convective effect is dominant compared with diffusion. This implies that the trajectory of an ethanol vapour pocket has a similarity to that of a jet in cross-flow (Keffer & Baines Reference Keffer and Baines1963; Kamotani & Greber Reference Kamotani and Greber1972; Broadwell & Breidenthal Reference Broadwell and Breidenthal1984; Smith & Mungal Reference Smith and Mungal1998; Chochua et al.
Reference Chochua, Shyy, Thakur, Brankovic, Lienau, Porter and Lischinsky2000; Su et al.
Reference Su, Han, Miraflor and Mungal2000; Muppidi & Mahesh Reference Muppidi and Mahesh2005). A correlation for the jet-in-cross-flow trajectory obtained by several experiments and simulations is known to scale with a power law as
 $$\begin{eqnarray}x_{tr}/rd\sim (x_{d}/rd)^{{\it\alpha}_{j}},\end{eqnarray}$$
where $x_{d}$
and
$x_{d}$
and $x_{tr}$
are the downstream distance (in the air flow direction) and the transverse distance (in the flow-normal direction) respectively, and
$x_{tr}$
are the downstream distance (in the air flow direction) and the transverse distance (in the flow-normal direction) respectively, and $d$
is the jet diameter. Here,
$d$
is the jet diameter. Here, $r$
is the effective velocity ratio
$r$
is the effective velocity ratio
 $$\begin{eqnarray}r=({\it\rho}_{j}u_{j}^{2}/{\it\rho}_{mf}u_{mf}^{2})^{1/2},\end{eqnarray}$$
where the subscript $j$
denotes the jet and
$j$
denotes the jet and $mf$
the main free-stream air flow. For a wide range of
$mf$
the main free-stream air flow. For a wide range of $r$
, it is known that the constant
$r$
, it is known that the constant ${\it\alpha}_{j}$
is
${\it\alpha}_{j}$
is ${\it\alpha}_{j}=1/3{-}1/2$
(Keffer & Baines Reference Keffer and Baines1963; Kamotani & Greber Reference Kamotani and Greber1972; Broadwell & Breidenthal Reference Broadwell and Breidenthal1984; Smith & Mungal Reference Smith and Mungal1998; Chochua et al.
Reference Chochua, Shyy, Thakur, Brankovic, Lienau, Porter and Lischinsky2000; Su et al.
Reference Su, Han, Miraflor and Mungal2000; Muppidi & Mahesh Reference Muppidi and Mahesh2005).
${\it\alpha}_{j}=1/3{-}1/2$
(Keffer & Baines Reference Keffer and Baines1963; Kamotani & Greber Reference Kamotani and Greber1972; Broadwell & Breidenthal Reference Broadwell and Breidenthal1984; Smith & Mungal Reference Smith and Mungal1998; Chochua et al.
Reference Chochua, Shyy, Thakur, Brankovic, Lienau, Porter and Lischinsky2000; Su et al.
Reference Su, Han, Miraflor and Mungal2000; Muppidi & Mahesh Reference Muppidi and Mahesh2005).
Figure 16 shows the trajectory profiles of jets in cross-flow, which are replotted from figures 1 and 8 in Muppidi & Mahesh (Reference Muppidi and Mahesh2005), and those of several ethanol vapour pockets in two cases in the present study. In the present cases, the pocket position is defined as that of the centre of gravity (CG) of the pocket. Most experiments in the literature (Keffer & Baines Reference Keffer and Baines1963; Kamotani & Greber Reference Kamotani and Greber1972; Broadwell & Breidenthal Reference Broadwell and Breidenthal1984; Smith & Mungal Reference Smith and Mungal1998; Chochua et al.
Reference Chochua, Shyy, Thakur, Brankovic, Lienau, Porter and Lischinsky2000; Su et al.
Reference Su, Han, Miraflor and Mungal2000) are in turbulent conditions, and the simulation cases of Muppidi & Mahesh (Reference Muppidi and Mahesh2005) are in laminar conditions. The trajectories are affected to some extent by the effective velocity ratio $r$
, the boundary layer thickness of the main free-stream flow and the jet velocity profile (Muppidi & Mahesh Reference Muppidi and Mahesh2005). However, all of the trajectories scale well with (4.13) within a limited range of scatter. This indicates that the trajectories of the ethanol vapour pockets ejected by puffing in the present study are also similar to the trajectory of a jet in cross-flow. In puffing,
$r$
, the boundary layer thickness of the main free-stream flow and the jet velocity profile (Muppidi & Mahesh Reference Muppidi and Mahesh2005). However, all of the trajectories scale well with (4.13) within a limited range of scatter. This indicates that the trajectories of the ethanol vapour pockets ejected by puffing in the present study are also similar to the trajectory of a jet in cross-flow. In puffing, $d$
cannot be strictly defined and
$d$
cannot be strictly defined and $d\sim D/3$
is used. It should also be noted that puffing is not continuous ejection but finite-duration ejection, and that the initial ejection direction is slightly inclined towards the downstream (
$d\sim D/3$
is used. It should also be noted that puffing is not continuous ejection but finite-duration ejection, and that the initial ejection direction is slightly inclined towards the downstream ( $x_{d}$
) direction, resulting in a relatively smaller
$x_{d}$
) direction, resulting in a relatively smaller $x_{tr}/rd$
compared with the jet-in-cross-flow results. Still, it can be said that the trajectory of an ethanol vapour pocket is similar to that of a jet in cross-flow.
$x_{tr}/rd$
compared with the jet-in-cross-flow results. Still, it can be said that the trajectory of an ethanol vapour pocket is similar to that of a jet in cross-flow.
For a wide range of $r$
, the penetration length in the transverse (
$r$
, the penetration length in the transverse ( $x_{tr}$
) direction is approximately
$x_{tr}$
) direction is approximately $x_{tr}/rd<2$
. Considering the ejected ethanol vapour and air densities, the effective velocity ratio becomes
$x_{tr}/rd<2$
. Considering the ejected ethanol vapour and air densities, the effective velocity ratio becomes $r\sim 1.8{-}3.3$
in the present puffing cases. Assuming
$r\sim 1.8{-}3.3$
in the present puffing cases. Assuming $d\sim D/3$
, this relation becomes
$d\sim D/3$
, this relation becomes $x_{tr}/D<2.2$
. Therefore, the ejected ethanol vapour may reach a few diameters away from the parent decane droplet in the transverse direction under the current convective conditions (see figure 15). For an isolated droplet that is far away from other droplets, such as those in the downstream dilute spray region, this length scale may not be significant in terms of droplet grouping because flames surrounding droplets may remain isolated. When other droplets exist in the vicinity, such as those in the dense and transient spray regions, however, the ejected ethanol vapour may reach the region of influence of neighbouring droplets. Therefore, puffing may induce mutual interactions between droplets and change the group combustion configuration. In § 4.3.2, the droplet grouping under puffing will be investigated in the multiple-droplet configuration.
$x_{tr}/D<2.2$
. Therefore, the ejected ethanol vapour may reach a few diameters away from the parent decane droplet in the transverse direction under the current convective conditions (see figure 15). For an isolated droplet that is far away from other droplets, such as those in the downstream dilute spray region, this length scale may not be significant in terms of droplet grouping because flames surrounding droplets may remain isolated. When other droplets exist in the vicinity, such as those in the dense and transient spray regions, however, the ejected ethanol vapour may reach the region of influence of neighbouring droplets. Therefore, puffing may induce mutual interactions between droplets and change the group combustion configuration. In § 4.3.2, the droplet grouping under puffing will be investigated in the multiple-droplet configuration.
The primary-fuel SDR at the stoichiometric condition ${\it\chi}_{1,st}$
is strongly related to the local non-premixed flame structure. In a turbulent combusting flow, it is known that the probability density function (p.d.f.) of
${\it\chi}_{1,st}$
is strongly related to the local non-premixed flame structure. In a turbulent combusting flow, it is known that the probability density function (p.d.f.) of ${\it\chi}_{1,st}$
can be approximated by a log-normal distribution (Pitsch & Steiner Reference Pitsch and Steiner2000). In the present study, without puffing, the flow field around a droplet is laminar and axisymmetric. Therefore, at a fixed position downstream of the droplet in the streamwise direction, the p.d.f. of
${\it\chi}_{1,st}$
can be approximated by a log-normal distribution (Pitsch & Steiner Reference Pitsch and Steiner2000). In the present study, without puffing, the flow field around a droplet is laminar and axisymmetric. Therefore, at a fixed position downstream of the droplet in the streamwise direction, the p.d.f. of ${\it\chi}_{1,st}$
has a sharp peak at a specific value. Figure 17 shows the p.d.f. profiles of
${\it\chi}_{1,st}$
has a sharp peak at a specific value. Figure 17 shows the p.d.f. profiles of ${\it\chi}_{1,st}$
for case A3 at the downstream position of
${\it\chi}_{1,st}$
for case A3 at the downstream position of $l_{1}=2.3D$
from the droplet centre. It should be noted that this position is the same as that shown in figure 10(a) for case A2. The corresponding flow field can be seen in figure 15. At
$l_{1}=2.3D$
from the droplet centre. It should be noted that this position is the same as that shown in figure 10(a) for case A2. The corresponding flow field can be seen in figure 15. At $t=10.56~{\rm\mu}\text{s}$
, the p.d.f. has a peak around
$t=10.56~{\rm\mu}\text{s}$
, the p.d.f. has a peak around ${\it\chi}_{1,st}\sim 190~\text{s}^{-1}$
, which is in agreement with the peak SDR shown in figure 10(b). After puffing (
${\it\chi}_{1,st}\sim 190~\text{s}^{-1}$
, which is in agreement with the peak SDR shown in figure 10(b). After puffing ( $t=13.20~{\rm\mu}\text{s}$
and
$t=13.20~{\rm\mu}\text{s}$
and $t=14.52~{\rm\mu}\text{s}$
), the decane vapour field gradually becomes asymmetric and the p.d.f. profiles are shifted towards a larger
$t=14.52~{\rm\mu}\text{s}$
), the decane vapour field gradually becomes asymmetric and the p.d.f. profiles are shifted towards a larger ${\it\chi}_{1,st}$
. This indicates that the motion of ejected ethanol vapour pockets causes an increase of
${\it\chi}_{1,st}$
. This indicates that the motion of ejected ethanol vapour pockets causes an increase of ${\it\chi}_{1,st}$
. Puffing occurs from the parent decane droplet surface, which is in a decane-rich region. Affected by the puffing motion, the stoichiometric surface is expanded and
${\it\chi}_{1,st}$
. Puffing occurs from the parent decane droplet surface, which is in a decane-rich region. Affected by the puffing motion, the stoichiometric surface is expanded and ${\it\chi}_{1,st}$
increases. This indicates that when a flame is existent, both the flame topology and the reaction rate will be affected by puffing.
${\it\chi}_{1,st}$
increases. This indicates that when a flame is existent, both the flame topology and the reaction rate will be affected by puffing.

Figure 17. The p.d.f.s of ${\it\chi}_{1,st}~(\text{s}^{-1})$
at different time instants during puffing at the downstream position of
${\it\chi}_{1,st}~(\text{s}^{-1})$
at different time instants during puffing at the downstream position of $l_{1}=2.3D$
from the droplet centre.
$l_{1}=2.3D$
from the droplet centre.

Figure 18. Puffing effects on droplet grouping in case B1. In (a) and (b), the yellow isosurface represents the stoichiometric surface and the pink isosurface represents $Y_{ethanol}=0.05$
: (a)
$Y_{ethanol}=0.05$
: (a) $t=9.24~{\rm\mu}\text{s}$
; (b)
$t=9.24~{\rm\mu}\text{s}$
; (b) $t=13.20~{\rm\mu}\text{s}$
. The dashed line in (a) indicates the region where data samples are obtained to plot the mixture fraction profiles
$t=13.20~{\rm\mu}\text{s}$
. The dashed line in (a) indicates the region where data samples are obtained to plot the mixture fraction profiles $Z_{1}$
,
$Z_{1}$
, $Z_{2}$
and
$Z_{2}$
and $Z_{st}$
in (c).
$Z_{st}$
in (c).
4.3.2 Droplet grouping under puffing
The above discussion in § 4.3.1 indicates that mutual droplet interaction becomes significant when the inter-droplet distance $l$
is on the scale of
$l$
is on the scale of $D$
in a multiple-droplet configuration with puffing. In this subsection, puffing effects on droplet grouping characteristics are investigated using cases B1 and B2. The present setting mimics a droplet group in the dense spray region. Case B1 is a baseline case and has four droplets in the front and four in the back. Case B2 has the same geometrical droplet locations, but the streamwise boundary conditions are periodic. Thus, all of the droplets are in the wake region in this case. The droplet positions (normalised by
$D$
in a multiple-droplet configuration with puffing. In this subsection, puffing effects on droplet grouping characteristics are investigated using cases B1 and B2. The present setting mimics a droplet group in the dense spray region. Case B1 is a baseline case and has four droplets in the front and four in the back. Case B2 has the same geometrical droplet locations, but the streamwise boundary conditions are periodic. Thus, all of the droplets are in the wake region in this case. The droplet positions (normalised by $D$
) are
$D$
) are $(x,y,z)=(0,0,0),(+1.47,+0.13,+1.28)$
and
$(x,y,z)=(0,0,0),(+1.47,+0.13,+1.28)$
and $(+1.47,+2.05,+0.96)$
for droplets D1, D2 and D3 respectively (see figure 18
a). Droplets D2 and D3 are placed in tandem in the streamwise direction and named as a droplet pair P2. The inter-droplet distance between D1 and P2 in the transverse direction (
$(+1.47,+2.05,+0.96)$
for droplets D1, D2 and D3 respectively (see figure 18
a). Droplets D2 and D3 are placed in tandem in the streamwise direction and named as a droplet pair P2. The inter-droplet distance between D1 and P2 in the transverse direction ( $+xz$
direction) is
$+xz$
direction) is $l=1.95D$
. D1 and P2 are not grouped at the current droplet Reynolds number of
$l=1.95D$
. D1 and P2 are not grouped at the current droplet Reynolds number of $Re=30$
without puffing. The interaction between D1 and P2 under puffing and its effects on the grouping characteristics will be the main interest in this subsection. The other droplets are located at
$Re=30$
without puffing. The interaction between D1 and P2 under puffing and its effects on the grouping characteristics will be the main interest in this subsection. The other droplets are located at $(x,y,z)=(-0.13,+1.09,+1.41),(-1.09,+0.13,+0.96),(+1.15,+2.37,-0.51),(-1.09,+2.05,-0.96)$
and
$(x,y,z)=(-0.13,+1.09,+1.41),(-1.09,+0.13,+0.96),(+1.15,+2.37,-0.51),(-1.09,+2.05,-0.96)$
and $(-0.45,+0.45,-1.15)$
.
$(-0.45,+0.45,-1.15)$
.
For a droplet group, the interaction occurs in both the transverse and streamwise directions. For the effect of puffing on droplet grouping under convective conditions, the transverse direction is more important, as can be expected from § 4.3.1. Puffing itself is, once initiated, strong, fast and mostly independent of the free-stream flow. Even if there are neighbouring droplets, the dynamics of puffing and vapour ejection is similar to that for an isolated single droplet. Therefore, whether there are other droplets in the region of influence of a puffing droplet becomes the sole factor determining puffing effects on droplet grouping.
Figures 18(a) and 18(b) show the temporal evolution of puffing in case B1. The yellow isosurface represents the stoichiometric surface and the pink isosurface represents $Y_{ethanol}=0.05$
. Puffing occurs for droplet D1 located in the centre and upstream. Under the droplet Reynolds number
$Y_{ethanol}=0.05$
. Puffing occurs for droplet D1 located in the centre and upstream. Under the droplet Reynolds number $Re=30$
, the stoichiometric surface does not spread much in the transverse direction. In the pair P2, D3 is in the wake of D2. Although the transverse distance
$Re=30$
, the stoichiometric surface does not spread much in the transverse direction. In the pair P2, D3 is in the wake of D2. Although the transverse distance $l$
is not large, the wakes of droplet D1 and P2 do not affect each other before puffing, as indicated in figure 18(a). As already stated, puffing progresses almost independently of neighbouring droplets and expands the local stoichiometric surface surrounding D1 in the transverse direction. The ejected ethanol vapour pockets travel towards the droplet pair P2. Finally, the fuel vapour from D1 starts to interact with the stoichiometric surface surrounding P2, as shown by the dashed arrow in figure 18(b).
$l$
is not large, the wakes of droplet D1 and P2 do not affect each other before puffing, as indicated in figure 18(a). As already stated, puffing progresses almost independently of neighbouring droplets and expands the local stoichiometric surface surrounding D1 in the transverse direction. The ejected ethanol vapour pockets travel towards the droplet pair P2. Finally, the fuel vapour from D1 starts to interact with the stoichiometric surface surrounding P2, as shown by the dashed arrow in figure 18(b).
To further quantify puffing effects on droplet grouping, the profiles of $Z_{1}$
,
$Z_{1}$
, $Z_{2}$
and
$Z_{2}$
and $Z_{st}$
along the free-stream flow direction (
$Z_{st}$
along the free-stream flow direction ( $+y$
) at the middle transverse distance between D1 and P2 are shown in figure 18(c). The position of the line of interest is indicated by the dashed line in figure 18(a). The stoichiometric mixture fraction (the thin solid line in figure 18
c) represents the criterion whether D1 and P2 interact or not, namely if
$+y$
) at the middle transverse distance between D1 and P2 are shown in figure 18(c). The position of the line of interest is indicated by the dashed line in figure 18(a). The stoichiometric mixture fraction (the thin solid line in figure 18
c) represents the criterion whether D1 and P2 interact or not, namely if $Z=Z_{1}+Z_{2}<Z_{st}$
, D1 and P2 are separate, and if
$Z=Z_{1}+Z_{2}<Z_{st}$
, D1 and P2 are separate, and if $Z_{1}+Z_{2}\geqslant Z_{st}$
, they are in the same group. At
$Z_{1}+Z_{2}\geqslant Z_{st}$
, they are in the same group. At $t=9.24~{\rm\mu}\text{s}$
, D1 and P2 are separate at
$t=9.24~{\rm\mu}\text{s}$
, D1 and P2 are separate at $y/D<2.8$
, as indicated by the dashed red arrow in figure 18(c), which is also clear in figure 18(a). At
$y/D<2.8$
, as indicated by the dashed red arrow in figure 18(c), which is also clear in figure 18(a). At $t=13.20~{\rm\mu}\text{s}$
, the ejected ethanol vapour leads to the increased
$t=13.20~{\rm\mu}\text{s}$
, the ejected ethanol vapour leads to the increased $Z_{2}$
in
$Z_{2}$
in $y/D=1.8{-}3.2$
, as shown in figure 18(c). Accordingly, this region becomes fuel-rich, and D1 and P2 now belong to the same group at
$y/D=1.8{-}3.2$
, as shown in figure 18(c). Accordingly, this region becomes fuel-rich, and D1 and P2 now belong to the same group at $y/D>1.8$
, as shown by the solid red arrow in figure 18(c). It should be noted that the apparent rise in
$y/D>1.8$
, as shown by the solid red arrow in figure 18(c). It should be noted that the apparent rise in $Z_{1}$
is a combined result of its magnitude increase and the stoichiometric surface displacement due to puffing of the stratified decane vapour, as shown in figures 15 and 18.
$Z_{1}$
is a combined result of its magnitude increase and the stoichiometric surface displacement due to puffing of the stratified decane vapour, as shown in figures 15 and 18.
The DNS results of case B1 indicate that puffing may change the droplet grouping characteristics, even if the geometrical configuration is not changed during the puffing. The effect is significant especially for puffing in the transverse direction. The discussion in § 4.3.1 (figure 16) has indicated that a critically influenced region exists within a distance of a few droplet diameters away from the puffing droplet in the transverse direction. This conclusion gives important information for modelling puffing effects on droplet grouping and group combustion.
In case B2, the boundary conditions in the free-stream flow direction ( $+y$
) are changed to periodic conditions, mimicking a droplet group inside a large droplet cloud. In this case, all of the droplets are already in the wake of their preceding droplets and surrounded by fuel-rich gas mixture of decane and air. Figure 19(a) shows the stoichiometric surface distribution at
$+y$
) are changed to periodic conditions, mimicking a droplet group inside a large droplet cloud. In this case, all of the droplets are already in the wake of their preceding droplets and surrounded by fuel-rich gas mixture of decane and air. Figure 19(a) shows the stoichiometric surface distribution at $t=13.20~{\rm\mu}\text{s}$
. It is clear that the ethanol puffing dynamics of D1 is similar to that shown in figure 18(b). However, the mixing of the ejected ethanol vapour with the decane/air reactive gas mixture does not change the droplet grouping characteristics. As shown in figure 19(b), a similar puffing effect to that in figure 18(c) can be seen, as shown by the increased
$t=13.20~{\rm\mu}\text{s}$
. It is clear that the ethanol puffing dynamics of D1 is similar to that shown in figure 18(b). However, the mixing of the ejected ethanol vapour with the decane/air reactive gas mixture does not change the droplet grouping characteristics. As shown in figure 19(b), a similar puffing effect to that in figure 18(c) can be seen, as shown by the increased $Z_{2}$
(and
$Z_{2}$
(and $Z_{1}$
) in
$Z_{1}$
) in $y/D=1.8{-}2.6$
. In this case, however, the investigated region already has a fuel-rich mixture in the upstream due to the wake of preceding droplets, and D1 and P2 have already been grouped before the puffing. Therefore, the puffing effect is not significant in terms of the droplet grouping.
$y/D=1.8{-}2.6$
. In this case, however, the investigated region already has a fuel-rich mixture in the upstream due to the wake of preceding droplets, and D1 and P2 have already been grouped before the puffing. Therefore, the puffing effect is not significant in terms of the droplet grouping.
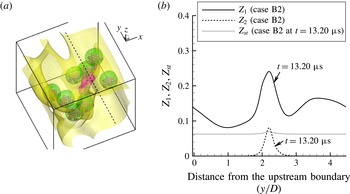
Figure 19. (a) Puffing and droplet grouping in case B2, for $t=13.20~{\rm\mu}\text{s}$
; (b)
$t=13.20~{\rm\mu}\text{s}$
; (b) $Z_{1}$
,
$Z_{1}$
, $Z_{2}$
and
$Z_{2}$
and $Z_{st}$
along the dashed line in (a).
$Z_{st}$
along the dashed line in (a).
As schematically shown in figure 2(a), actual droplet groups in a dense spray can be categorised into the above two cases, namely droplet groups on the periphery of the spray or droplet groups inside the spray. Recent studies on the droplet interaction in a multi-dimensional droplet array also reflect the conclusion that the interaction is different between the most upstream droplets and inner droplets (Sirignano Reference Sirignano2014). For emulsion droplets with puffing, it is more significant to consider the configuration of case B1 which includes front droplets on the periphery of a spray, since the puffing probability is strongly related to the droplet heating conditions and is therefore different for the two kinds of droplet groups. It is known that downstream droplets in the wake region undergo less heat and mass transfer compared with front droplets (Tal, Lee & Sirignano Reference Tal, Lee and Sirignano1984; Tsai & Sterling Reference Tsai and Sterling1991; Chiang & Kleinstreuer Reference Chiang and Kleinstreuer1992; Umemura Reference Umemura1994). This suggests that emulsion fuel droplets on the periphery of a spray may be more prone to puffing than those in the wake region.
The local Nusselt number $Nu$
, a normalised heat flux, is defined as
$Nu$
, a normalised heat flux, is defined as
 $$\begin{eqnarray}Nu=\left({\it\lambda}\frac{\partial T}{\partial n}\right)_{s}\frac{D}{{\it\lambda}_{0}(T_{0}-T_{s})},\end{eqnarray}$$
where $n$
denotes the droplet surface-normal direction, the subscript
$n$
denotes the droplet surface-normal direction, the subscript $s$
indicates surface and
$s$
indicates surface and $0$
indicates free-stream air. In order to identify which droplet is more prone to heating prior to puffing, figure 20 shows the instantaneous local
$0$
indicates free-stream air. In order to identify which droplet is more prone to heating prior to puffing, figure 20 shows the instantaneous local $Nu$
along the surface of the droplets D1–D3 in case B1 at
$Nu$
along the surface of the droplets D1–D3 in case B1 at $t=9.24~{\rm\mu}\text{s}$
when puffing has just started. The flow asymmetry due to puffing is not strong at this stage and, for simplicity, each plot shows the distribution for 0–180° from the front stagnation point along a droplet surface line that includes the top position on the droplet surface, as shown in figure 20 (see also figure 18). It is clear that for the front droplets (D1 and D2) the Nusselt numbers are higher compared with that for the droplet (D3) in the wake, which is similar to the results in the literature. Therefore, the puffing probability for the front droplets is typically higher due to the higher heat flux at the droplet surface. The different puffing probabilities due to different heating conditions for droplets in different regions of a spray should also be incorporated, in addition to the change of droplet grouping due to puffing discussed above, in modelling of puffing in a biofuel-blended diesel spray.
$t=9.24~{\rm\mu}\text{s}$
when puffing has just started. The flow asymmetry due to puffing is not strong at this stage and, for simplicity, each plot shows the distribution for 0–180° from the front stagnation point along a droplet surface line that includes the top position on the droplet surface, as shown in figure 20 (see also figure 18). It is clear that for the front droplets (D1 and D2) the Nusselt numbers are higher compared with that for the droplet (D3) in the wake, which is similar to the results in the literature. Therefore, the puffing probability for the front droplets is typically higher due to the higher heat flux at the droplet surface. The different puffing probabilities due to different heating conditions for droplets in different regions of a spray should also be incorporated, in addition to the change of droplet grouping due to puffing discussed above, in modelling of puffing in a biofuel-blended diesel spray.

Figure 20. Profiles of the local Nusselt number in case B1 at $t=9.24~{\rm\mu}\text{s}$
. The angle is measured from the upstream stagnation point on the droplet.
$t=9.24~{\rm\mu}\text{s}$
. The angle is measured from the upstream stagnation point on the droplet.
5 Concluding remarks
Puffing dynamics and its effects on fuel/air mixing and micromixing for a single droplet and multiple droplets of a decane/bioethanol emulsion mixture under convective heating have been investigated by DNS, which solves all interface dynamics. Under convective heating, the inner-droplet temperature becomes high in the rear region of an emulsion droplet, where initiation of boiling occurs. As the ethanol vapour is ejected into the decane/air gaseous mixture, intense mixing occurs locally and transiently among the vapour of the primary fuel decane, the vapour of the secondary fuel ethanol and air. The mixing characteristics have been investigated using SDRs, which quantify the diffusion processes among the three scalars. The contribution of cross-fuel scalar mixing to the primary-fuel SDR is identified to be predominant due to ethanol vapour puffing. Since the ejected ethanol vapour increases the local mixture fraction, the stoichiometric mixture fraction isosurface is also affected by puffing. When the ethanol ejection is in the wake direction, the wake is elongated but the shape of the stoichiometric surface is not much affected. When the ejection is in the transverse region, the stoichiometric surface shape is considerably changed. The ejection dynamics in the transverse direction is similar to that of a jet in cross-flow. The ethanol fuel-vapour trajectory scales well with the correlation obtained for jets in cross-flow. The transient travelling distance of ethanol fuel-vapour pockets may reach a few diameters away from the parent decane droplet in the transverse direction. When other droplets are present in the neighbourhood of the puffing droplet, this ejection may change the droplet grouping transiently, even if the geometrical locations of the droplets are not changed. This effect is especially significant for droplets in the upstream of a droplet group on the periphery of a spray due to their direct exposure to the hot air and thus higher heat transfer, which can be quantified by the local Nusselt number. On the other hand, droplets in the wake of other droplets receive less heat and thus puffing is less likely. Even if puffing occurs for these downstream droplets, the ejected ethanol vapour may not change the droplet grouping significantly, since these droplets are already surrounded by fuel-rich gaseous mixture. In modelling puffing effects on an emulsion fuel spray, such a difference in puffing possibility also needs to be considered, in addition to puffing effects on droplet grouping characteristics.
Acknowledgements
Financial support from the Engineering and Physical Sciences Research Council (EPSRC) of the UK under the grant no. EP/J018023/1 is gratefully acknowledged. This work used the ARCHER UK National Supercomputing Service (http://www.archer.ac.uk). Computing resources on ARCHER were supported by the UK Consortium on Turbulent Reacting Flows (UKCTRF).
Appendix
A list of variable notation is presented for clarity.


 Open access