


The consumption of processed foods is increasingly recognized as one of the major factors contributing to the global obesity epidemic. A new framework for classifying food based on the extent and purpose of industrial processing (Table 1) was introduced in 2009( Reference Monteiro 1 ) and suggests the most extensively processed products (ultra-processed products) to be the main dietary driver of the obesity epidemic.
Table 1 The new classification of food according to the extent and purpose of industrial processing (NOVA): definitions and examples (adapted from Monteiro et al.( Reference Monteiro, Cannon and Levy 31 , 32 ))

Studies conducted with this new framework indicate that ultra-processed products are replacing traditional diets( Reference Moubarac, Batal and Martins 2 – Reference Juul and Hemmingsson 6 ), rapidly penetrating markets and market segments across the globe( Reference Monteiro and Cannon 7 – Reference Monteiro, Moubarac and Cannon 9 ). Diets dominated by ultra-processed products have poor nutrient profiles( Reference Monteiro, Levy and Claro 3 , Reference Moubarac, Martins and Claro 10 – Reference Louzada, Bortoletto Martins and Silva Canella 12 ) and are associated with a higher prevalence of overweight, obesity( Reference Canella, Levy and Martins 13 , Reference Louzada, Baraldi and Steele 14 ) and metabolic syndrome( Reference Tavares, Fonseca and Garcia Rosa 15 ). Other studies on processed foods indicate that they are the main vectors for sugar, salt and fats (saturated and trans), directly linked with the nutrition transition and the increase in diet-related non-communicable diseases (NCD)( Reference Swinburn, Caterson and Seidell 16 , Reference Baker and Friel 17 ). Consumption of ultra-processed products is also inducing unfavourable eating habits such as snacking, as they are ready-to-eat convenience foods( Reference Monteiro, Gomes and Cannon 18 ). The replacement of traditional diets for ultra-processed products has been seen as related to a food system characterized by a lightly regulated global food industry( Reference Monteiro and Cannon 7 ). In Brazil, the new classification of food is the basis for the widely recognized food-based dietary guidelines issued in 2014( Reference Monteiro, Cannon and Moubarac 19 ).
Up until now, dietary patterns based on this classification have been examined in only four countries( Reference Moubarac, Batal and Martins 2 , Reference Martins, Levy and Claro 4 , Reference Juul and Hemmingsson 6 , Reference Crovetto, Uauy and Martins 11 ).
In Norway, overweight, obesity and diet-related NCD are public health issues( 20 ). Evidence suggests that more than half of the population is overweight, including almost 20 % with obesity( Reference Meyer and Tverdal 21 , 22 ). NCD account for the majority of deaths in Norway( 22 ). Dietary changes over the past decades have been identified as an important cause and dietary improvement is a core strategy for promoting public health by the Norwegian government( 23 ). Although there have been positive changes in dietary patterns over the past few years, such as increasing intakes of fish, fruits and vegetables, and decreasing intake of sugar( 24 ), unhealthy diets are still the largest risk factor for mortality( 22 ).
The present study aimed to identify the participation of ultra-processed foods (vectors of salt, sugar and fats) in the Norwegian diet through an investigation of food sales in the country, assessing: (i) current food sales and changes between 2005 and 2013 in the country as a whole; (ii) differences in food sales between six geographic regions; and (iii) differences in food sales from three retail concepts.
Methods
Data source and sampling
The data analysed in the present study are derived from monthly collection of sales data routinely carried out by Statistics Norway (SSB)Footnote * from August 2005 onwards. The data set reports from a nationally representative sample of grocery retailers and consists of barcode data generated electronically at the point of purchase for each individual sale of food and non-alcoholic beverage item. Sales for close to all food products available in Norway are reported( Reference Rodrigues and Haraldsen 25 ), including minimally processed foods such as fruits and vegetables. Due to extensive amounts of data reported each month, the present analysis is focused on data from September 2005 and September 2013.
The retailers were sampled, by SSB, from a population defined as grocery retailers reporting barcode data to one of the four leading retail groups in Norway( Reference Henriksen 26 ). The population covers more than 99 % of the Norwegian grocery retail market( Reference Johansen and Nygaard 27 ). In the present analysis, sample size was 150 retailers in September 2005 and 170 retailers in September 2013, accounting for about 5 % of the total number of retailers in the population. The sampling procedure applied by SSB to ensure national representativeness includes stratifying retailers according to retail chains and their concepts,Footnote † and calculating strata size based on turnover values within each stratum. Detailed description of the sampling strategy is available elsewhere( Reference Rodrigues and Haraldsen 25 – Reference Johansen 28 ).
Data collection
The barcode data analysed in the present study included 296 121 observations (individual food item purchases) in September 2005 and 501 938 observations in September 2013.
The following variables (units in brackets) were obtained for each observation from SSB: turnover (Norwegian Kroner, NOK), price (NOK per unit), county, retail concept and food group (COICOP6 code). Food and beverage items are assigned by SSB to 139 food groupsFootnote ‡ according to a UN consumption classification called COICOP (Classification of Individual Consumption According to Purpose)( Reference Johansen and Nygaard 27 , 29 ). Retail chains are assigned by SSB to four retail concepts: supermarkets, low-price stores, convenience stores and kiosks. Data from the kiosk retail concept were not available for the present study, due to problems with anonymizing the data. However, these accounted for less than 1 % of turnover in the sample; hence, the effect of this exclusion is minimal.
Classification
For the purposes of the present study, the barcode data were systematically analysed using a new classification system for foodstuffs developed by a Brazilian research group( Reference Monteiro, Levy and Claro 30 – 32 ), termed the NOVA classification. Food items are grouped according to the extent and purpose of industrial processing they undergo, into minimally processed foods, culinary ingredients, processed products and ultra-processed products.Footnote § Table 1 summarizes the definitions of the food groups and provides examples of food items belonging to each group.
The 139 COICOP food groups in the barcode data were assigned to one of the food groups in the new classification. COICOP food groups that combined foods that were processed to different extents were for the most part excluded from the analysis, to avoid misclassification. These are listed in Table 2. For example, ‘nuts and seeds’ contains both unsalted nuts and seeds (minimally processed) and salted or roasted nuts (processed).
Table 2 List of excluded observations and their share of total purchases and expenditure in Norway in September 2005 and September 2013
* Combines cured ham and cured sausages, pâtés, side meat or knuckles, which are both processed and ultra-processed products.
† Seafood where processing is not known.
‡ Syrup and unknown sweet spreads.
§ Combines sour cream and fresh cheese.
However, when sufficient information was available assumptions were made. For example, COICOP did not distinguish between yoghurts that are flavoured/sweetened and those that are not, thus all yoghurts were classified as ultra-processed products, as consumption of sweetened yoghurt is the most common in Norway( 33 ).
To assess composition of food sales within the four food groups, all observations were further divided into thirty-one subgroups (Table 3).
Table 3 Share of purchases (%) and share of expenditure (%) in Norway in September 2005 and September 2013 for food subgroups within four food groups classified according to their extent and purpose of industrial processing, and relative change (%)
* Count significantly higher than expected at P<0·05 in χ 2 test.
† Count significantly lower than expected at P<0·05 in χ 2 test.
Data analysis
Frequency of purchase of food items (each barcode scan equals one food purchase) and expenditure on food items were used as proxies for food consumption. These indicators are not direct measures of consumption, but provide a good indication of consumption trends, as indicated in other studies( Reference Baker and Friel 17 ).
The first analysis involved counting the share of total purchases accounted for by each of the food groups in 2005 and 2013. The relative difference in share between 2005 and 2013 for each group was calculated and Pearson’s χ 2 tests for the association between time and food purchases were performed. The same was done for subgroups.
Second, the share of expenditure and the relative difference in share between 2005 and 2013 for the four groups and subgroups were calculated. For this indicator findings could not be tested for statistical significance with the data available (from only two points in time).
To assess food sales in different geographical regions, the counties were divided into six geographical regions in Norway (East, South, West, Middle, North and Oslo (capital city)). Share of purchases and expenditure for the four food groups were calculated in each region. Then χ 2 tests for the association between region and frequency of food purchases were performed for 2005 and 2013 separately. The same procedure was followed to assess food sales in the three different retail concepts (supermarkets, low-price stores and convenience stores).
Calculations were carried out in Microsoft® Excel version 2010 using pivot tables. Statistical analyses were performed in the statistical software package IBM SPSS Statistics 21.
Results
Food sales of NOVA food groups
Figure 1 shows the share of food sales for the four food groups in 2005 and 2013 in terms of the frequency of purchase and expenditure. Sales of ultra-processed products were at a much higher level than sales of minimally processed foods, culinary ingredients and processed products for both indicators in both years. Approximately 58 % of purchases and 48 % of expenditure corresponded to ultra-processed foods. Minimally processed foods accounted for 17 % of purchases and 33 % of expenditure. The higher share of expenditure than purchases for minimally processed foods indicates that these foods had a relatively higher average price per purchase than did the three other food groups. Processed products accounted for 11 % of purchases and 10 % of expenditure. Culinary ingredients were purchased least frequently (6 %) and accounted for the smallest share of expenditure (3–4 %) in both years.
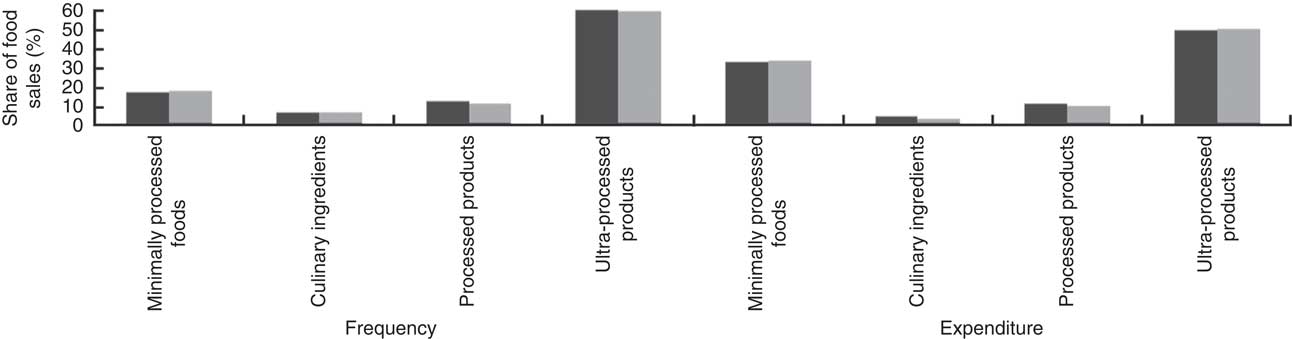
Fig. 1 Share of food sales in Norway in September 2005 (![]() ) and September 2013 (
) and September 2013 (![]() ), in terms of frequency of purchase and expenditure, for four food groups classified according to their extent and purpose of industrial processing
), in terms of frequency of purchase and expenditure, for four food groups classified according to their extent and purpose of industrial processing
The unclassifiable food items (Table 2) totalled 8·4 % of purchases in 2005 and 2013, 6·3 % of expenditure in 2005 and 5·9 % in 2013. Table 2 shows how they contribute to underestimation of frequency and expenditure for the four NOVA groups by being excluded from the analysis.
Food sales per subgroup
Shares of purchases and expenditure for subgroups are shown in Figs 2 and 3, respectively. The subgroup that was most frequently purchased and held the largest expenditure share, both in 2005 and 2013, is sweets, snacks and desserts. These items were purchased more than twice as often as the second most purchased group (cakes, pastries and cookies in 2005 and breads in 2013) and equally as often as all minimally processed foods items combined.
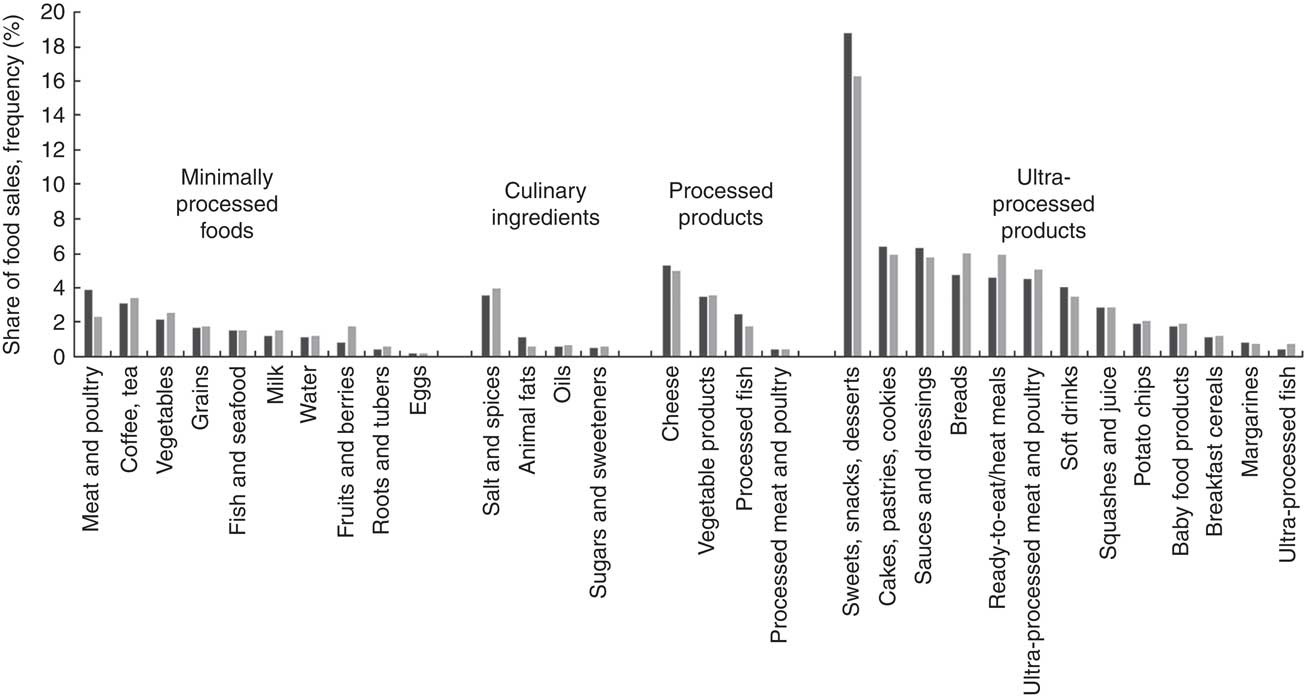
Fig. 2 Share of food sales in Norway in September 2005 (![]() ) and September 2013 (
) and September 2013 (![]() ), in terms of frequency of purchase, for food subgroups within four food groups classified according to their extent and purpose of industrial processing
), in terms of frequency of purchase, for food subgroups within four food groups classified according to their extent and purpose of industrial processing
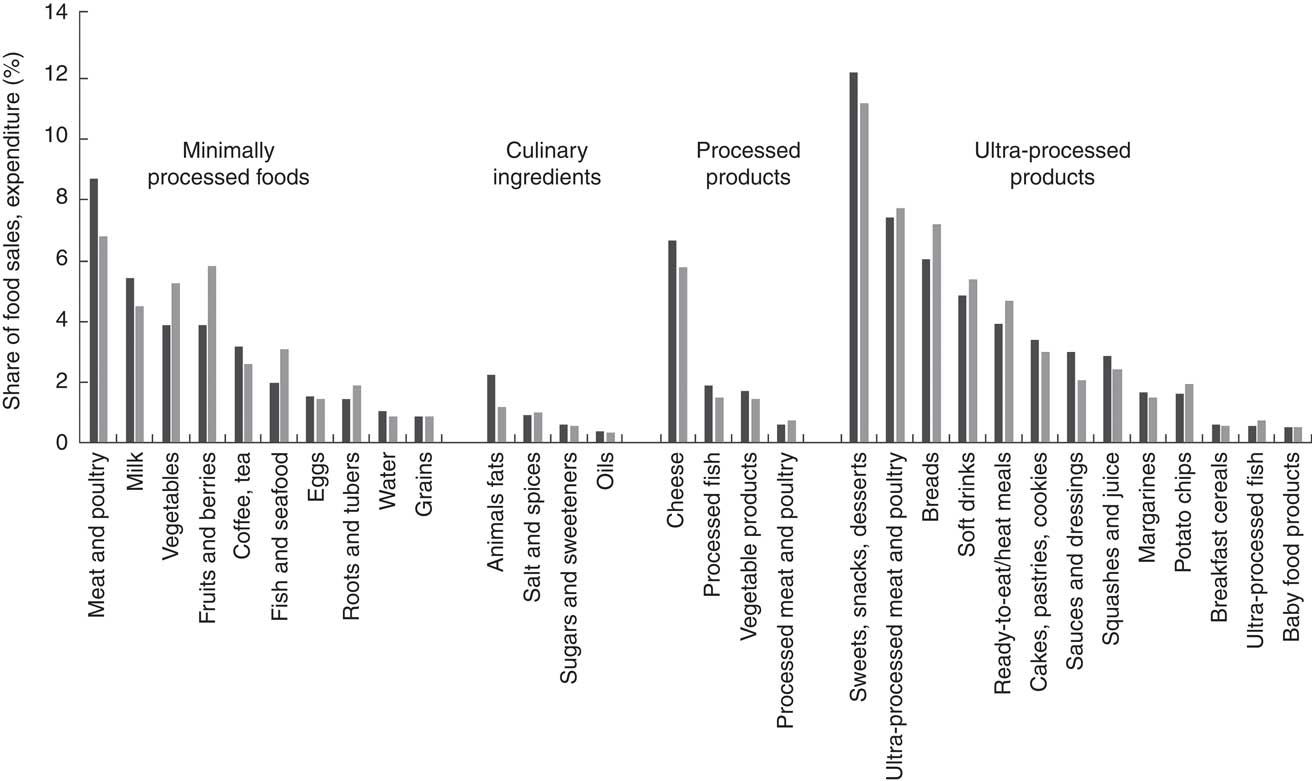
Fig. 3 Share of food sales in Norway in September 2005 (![]() ) and September 2013 (
) and September 2013 (![]() ), in terms of expenditure, for food subgroups within four food groups classified according to their extent and purpose of industrial processing
), in terms of expenditure, for food subgroups within four food groups classified according to their extent and purpose of industrial processing
Table 3 shows shares of food sales for all subgroups. If aggregating all purchases of sweet ultra-processed products,Footnote * these accounted for every third purchase in 2013. Thus, for each purchase of a minimally processed food, two sweet ultra-processed products were purchased. In expenditure share, sweet ultra-processed products accounted for about 23 %, compared with 33 % for all minimally processed foods, in 2013.
Results also show that Norwegians spent less and purchased less frequently minimally processed meat and poultry compared with processed and ultra-processed meat and poultry. The same was found for fish and potatoes (roots and tubers, compared with potato chips).
Table 4 lists the ten most sold subgroups and shows a predominance of food groups from ultra-processed products in both years and for both purchases and expenditure. Ultra-processed products accounted for the seven most frequently purchased items in 2005 and 2013. Of the ten subgroups on which Norwegians spent the most, five were ultra-processed products in 2005 and 2013.
Table 4 Ten most sold subgroups in Norway in September 2005 and September 2013, in terms of share of purchases (%) and share of expenditure (%)
UPP, ultra-processed products; PP, processed products; MPF, minimally processed foods; CI, culinary ingredients.
Evolution of food sales between 2005 and 2013
Table 3 shows that share of purchase and expenditure on the four food groups changed minimally between 2005 and 2013, but in favour of minimally processed foods and in disfavour of processed products. Share of food expenditure on culinary ingredients decreased. Ultra-processed products decreased their share of purchases, but accounted for a larger share of expenditure, meaning that average value of purchases increased. Pearson’s χ 2 test showed that time had a small, but significant effect on the frequency of purchase of food groups (χ 2 (3)=203 195, P<0·001, Cramer’s V=0·017, P<0·001). Significant standardized residuals are shown in Table 3. As indicated by the weak effect size measure, the absolute changes in share of frequency of purchases were small for all food groups.
Table 3 also shows relative changes between 2005 and 2013 for subgroups. There was a statistically significant association between purchases of subgroups and time (χ 2 (30)=6 699 211, P<0·001). The relationship was weak (Cramer’s V=0·096, P<0·001). Significant standardized residuals are shown in Table 3. Fish and seafood, squashes and juice, eggs, vegetable products, and processed meat and poultry were the only subgroups that did not have statistically significant standardized residuals in either year.
The changes in the subgroups within minimally processed foods show increased sales of fruits, vegetables, roots and tubers – these foods were both purchased more frequently and a larger share of expenditure was dedicated to them. Most remarkable was the increase for fruits and berries with a doubling of the share of purchases and a 50 % increase in the share of expenditure. Fish and seafood were not purchased more frequently, but Norwegians spent more of their food budgets on fish and seafood. Meat and poultry were purchased less frequently and a smaller share of expenditure was dedicated to them.
Within ultra-processed products, results show increased purchases and expenditures on ready-to-eat/heat meals, breads, ultra-processed meat and poultry, and ultra-processed fish, which are all ‘meal-type’ products. Purchases and expenditures on chocolate, sweets, snacks, desserts, cakes and pastries, which are all sweet ‘snack-type’ products, decreased. Soft drinks were purchased less frequently, but a higher share of expenditure was dedicated to them.
Comparison of retail concepts
Retail concept had a statistically significant, but weak effect on the frequency of purchase of food groups in both 2005 (χ 2 (6)=399 739, P<0·001, Cramer’s V=0·038, P<0·001) and 2013 (χ 2 (6)=647 255, P<0·001, Cramer’s V=0·027, P<0·001).
Figure 4 shows shares of purchases and expenditure on the four food groups in the three retail concepts. In general, a higher share of minimally processed foods and a lower share of ultra-processed products than in other concepts characterized food sales in supermarkets. Food sales in convenience stores were characterized by the opposite. In supermarkets, about 34 % of expenditure was on minimally processed foods and 47 % on ultra-processed products, compared with 27 % and 54 %, respectively, in convenience stores. For culinary ingredients and processed products, share of expenditure was almost equal in 2013 across concepts. In 2013, convenience stores had the highest share of purchases of minimally processed foods.
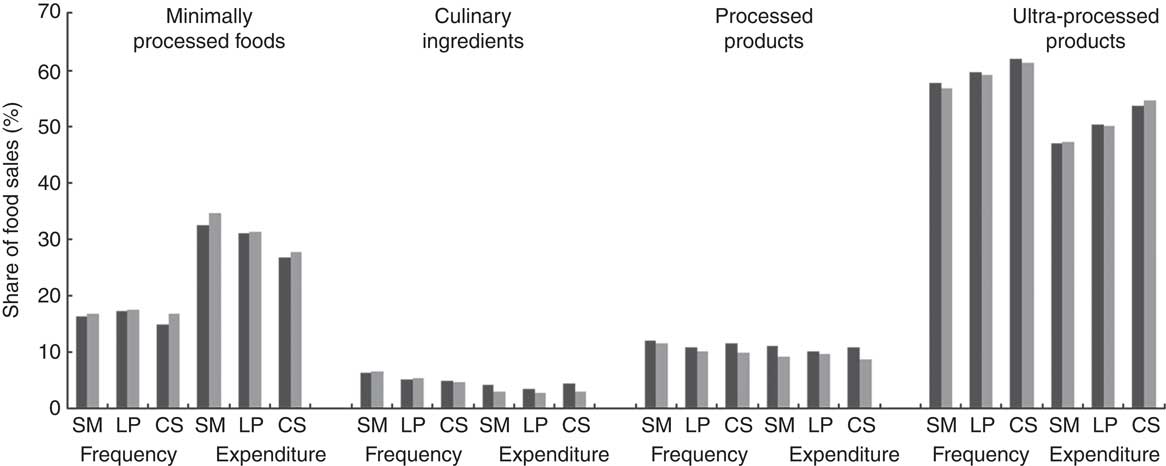
Fig. 4 Share of food sales in Norway in September 2005 (![]() ) and September 2013 (
) and September 2013 (![]() ), in terms of frequency of purchase and expenditure, for four food groups classified according to their extent and purpose of industrial processing in three retail concepts (SM, supermarket, LP, low-price store, CS, convenience store)
), in terms of frequency of purchase and expenditure, for four food groups classified according to their extent and purpose of industrial processing in three retail concepts (SM, supermarket, LP, low-price store, CS, convenience store)
Minimally processed foods and ultra-processed products increased their share of purchases and expenditure in all three concepts between 2005 and 2013, while culinary ingredients and processed products decreased their share for both indicators.
The subgroups also sold at different patterns in the three retail concepts. In supermarkets, sales of fish and seafood (purchase and expenditure), meat and poultry (expenditure), vegetables (expenditure), cheese (purchase and expenditure) and sauces and dressings (purchases) were higher than in the two others. Increase in expenditure on fish between 2005 and 2013 took place in supermarkets only. The higher sales (purchase and expenditure) of ultra-processed products in convenience stores were mainly cakes, pastries and cookies, sweets, snacks and desserts, and soft drinks. The higher purchase of minimally processed foods in convenience stores in 2013 was due to fruits and berries, vegetables and water.
Comparison of six geographic regions
Region of sale had a weak, but significant effect on purchases of food groups in both 2005 (χ 2 (15)=182 790, P<0·001, Cramer’s V=0·015, P<0·001) and 2013 (χ 2 (15)=112 406, P<0·001, Cramer’s V=0·016, P<0·001). No particular patterns were detected, as no regions were consistently higher or lower in purchases of any food groups. However, for expenditure, all regions seemed to convert to similar levels, except in Oslo, where expenditure increased to be higher than in other regions for minimally processed foods and decreased to be lower than in other regions for ultra-processed products (Fig. 5).
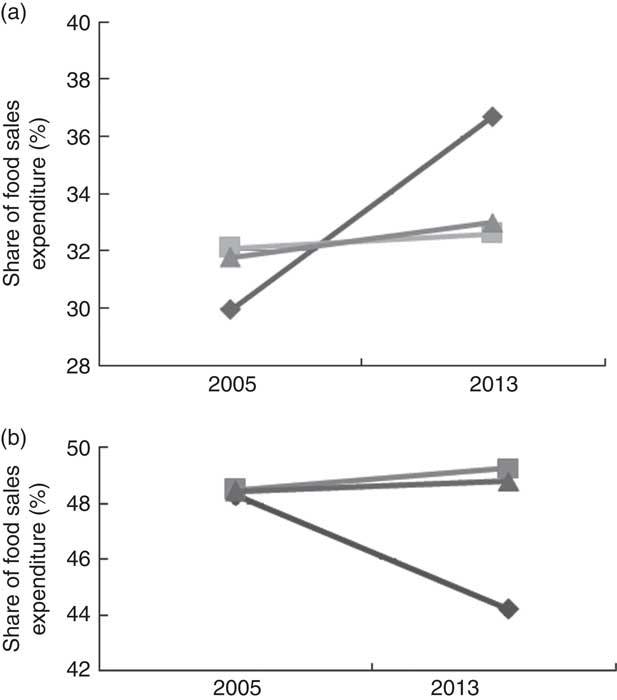
Fig. 5 Evolution of food expenditure in geographic regions of Norway (![]() , Oslo;
, Oslo; ![]() , Norway excluding Oslo;
, Norway excluding Oslo; ![]() , Norway overall) in September 2005 and September 2013 for two food groups classified according to their extent and purpose of industrial processing: (a) minimally processed foods; and (b) ultra-processed products
, Norway overall) in September 2005 and September 2013 for two food groups classified according to their extent and purpose of industrial processing: (a) minimally processed foods; and (b) ultra-processed products
Discussion
The present study found that in 2005 and 2013, ultra-processed products accounted for the largest part of food purchase and expenditure in Norway, indicating a high consumption of such items, and that these have replaced homemade meals made from minimally processed foods and culinary ingredients. Sweet ultra-processed products accounted for three out of ten purchased food items and more than a fifth of expenditure on food, but results indicated that sales of these decreased between 2005 and 2013. The study found increased sales for fruits and berries, vegetables, roots and tubers, ready-to-eat/heat meals, breads, and meat and poultry products, and that there was a large increase in share of expenditure on minimally processed foods in Oslo.
Limitations and strengths
While providing insights on food consumption and having been used elsewhere( Reference Baker and Friel 17 ), the use of food sales data as proxies for food consumption has several limitations.
First, there are elements of inaccuracy related to the indicators used. Frequency of purchase has two main weaknesses. Volume of food (grams and kilojoules) will differ between each purchase and foods might be purchased at different frequencies according to the possibility of storage and bulk purchasing. Food items that are purchased seldom but in larger volumes are therefore underestimated with this indicator. To minimize this limitation, the expenditure share for the food groups was included as a second indicator, which adds more weight to larger and more expensive purchases. The expenditure indicator also has limitations, as there is no standardization of volume of food per price. Changes between years might not represent actual changes in volumes purchased, but could represent price changes. The results should be interpreted with caution in the light of these limitations.
Second, food waste is not accounted for in retail data. Studies show that significant amounts of foods are wasted; for example, 30 % in the UK( Reference Ventour 34 ). Minimally processed foods are likely to be wasted more often, as these are more perishable. This bias may have led to overestimation of the consumption of minimally processed foods.
Finally, retail data do not include all sources of food consumption, such as foods eaten at restaurants. Pizza restaurants, gas stations and shopping mall cafeterias are those most frequently visited in Norway( Reference Bugge and Lavik 35 ), suggesting that consumption of ultra-processed products could be underestimated in our study.
Data were collected during September in 2005 and 2013, and uncertainty exists on whether retail in September is representative for whole-year retail. Measures have been taken to reduce this uncertainty; September was chosen as there are no official vacations or holidays during this month. Additionally, retail data are measured at population level and results cannot be extrapolated to individuals or households.
Several strengths can also be identified in the study. For example, these data are not prone to responder or information bias, as they are collected electronically and from all individuals purchasing food in the data collection period. Further, the foods and culinary ingredients purchased for home preparation of meals are identified and separated from the items purchased processed or ultra-processed products, which reduces risk of misclassification and thus measurement bias. Finally, the barcode scanner data are comprehensive, covering close to all food items available from food retailers, and are collected consistently over time. Using these data allows for a more representative sample than traditional food consumption studies.
Comparison
A positive correlation between gross domestic product per capita and consumption rates of ultra-processed products has been found( Reference Stuckler, McKee and Ebrahim 8 ). A comparison of results of the present study with those from other high-income countries is therefore most relevant. Euromonitor sales data on packaged foods, snacks and soft drinks (proxy for ultra-processed foods) have been analysed in seventy-nine high- and middle-income countries, showing that ultra-processed products dominate the food supplies of high-income countries( Reference Stuckler, McKee and Ebrahim 8 ). Studies from Canada show that shares of household food expenditure and dietary energy availability fell for minimally processed foods and culinary ingredients, and rose for ready-to-consume products, between 1938 and 2011( Reference Moubarac, Batal and Martins 2 , Reference Moubarac, Martins and Claro 10 ). The expenditure share for minimally processed foods, culinary ingredients and ready-to-consume products in 2011 was 40·8 %, 4·8 % and 54·4 %, respectively. Corresponding shares for energy intake were 25·6 %, 12·7 % and 61·7 %( Reference Moubarac, Batal and Martins 2 ). Similarly, in the UK, share of energy intake was 22·9 %, 13·7 % and 63·4 % for minimally processed foods, culinary ingredients and ready-to-consume products, respectively( Reference Moubarac, Claro and Baraldi 36 ). The ready-to-consume group consisted mainly of ultra-processed products in all the above-mentioned studies. Euromonitor sales data show that among Western European countries, Norway had the third highest annual per capita sales of ultra-processed products in 2012( 37 ). Although results are not directly comparable as different methods and indicators of food consumption have been applied, they indicate that food consumption in Norway in terms of the new classification is similar to other high-income countries and dominated by ultra-processed products.
The present study found that the share of purchases and expenditure on ultra-processed products increased minimally between 2005 and 2013. It has been suggested that a market saturation point is reached for ultra-processed products when these supply about 60 % of energy and that this point has been reached in high-income countries( Reference Monteiro and Cannon 7 , Reference Stuckler, McKee and Ebrahim 8 , Reference Moodie, Stuckler and Monteiro 38 , Reference Kleiman, Ng and Popkin 39 ). Euromonitor data from 1998 to 2012 show that in high-income countries, including Norway, sales of soft drinks increased in the first half of the period, and then decreased, while sales of snacks were static( Reference Monteiro, Moubarac and Cannon 9 ). The same study predicted growth of all ultra-processed products in countries with very high per capita income (gross national income ≥$US 50 000) to be close to zero. Another study on sales of packaged foods, snacks and soft drinks in seventy-nine high- and middle-income countries for the years 1997–2010 found that little or no growth in sales is expected in high-income countries by 2016( Reference Stuckler, McKee and Ebrahim 8 ). In Western Europe, total volume sales growth of ultra-processed food and drinks started declining in 2012( 37 ).
Our findings are in line with other studies of Norwegian dietary development, although comparisons of results is challenging as other studies do not separate foods groups in accordance with the new framework. A 2012 report from the Norwegian Directorate of Health indicated that expenditure share for sugary foods and beverages accounted for almost one-fifth of all expenses for food and non-alcoholic beverages( 40 ), which is similar to the share found in the present study (23 %). High intakes of free sugars, sweets and soft drinks is a well-known issue in Norway and is previously documented in several surveys( 40 , 41 ). The way sugar is consumed has changed, through decreasing use of table sugars, syrups, etc. for home use and increasing consumption of sugars through candy and soft drinks. Sweet ultra-processed products, especially candy, chocolate and sweetened beverages, are the largest contributors to intake of added sugars for children, adolescents and adults( 40 , Reference Andersen and Øverby 42 ). The findings in the current study highlight sweet ultra-processed products as the main vector for sugar intake.
The change in use of sugars illustrates another aspect of changing dietary patterns. Culinary ingredients are indicators of homemade meals and dishes, as they are not used alone, but rather as ingredients in the preparation of meals and dishes from minimally processed foods( Reference Monteiro, Levy and Claro 3 , Reference Moubarac, Martins and Claro 10 ). The low share of culinary ingredients sold in Norway indicates that ultra-processed products have replaced homemade meals and dishes. A previous study found that although homemade meals are highly valued in Norway, processed and ultra-processed products are often used in meal preparations on a daily basis( Reference Bugge 43 ).
Annual reports on dietary development show increasing consumption of vegetables and fruits between 1999 and 2011( 40 , 41 ). In the present study, an increase in sales of fruit, berries and vegetables was found between 2005 and 2013. Consumption of potato, a staple food in the Norwegian diet, has more than halved since the 1970s, while consumption of potato products has multiplied many times. Half of potato crops are now used for processed potato products( 41 ). The present study found similar issues: minimally processed potatoes accounted for less than 0·5 % of purchases and about 1·5 % of food expenditures, while potato chips accounted for 2 % of purchases and 1·5–2 % of food expenditures.
Meat consumption is reported to be increasing in Norway( 41 ). Monteiro et al.( Reference Monteiro, Levy and Claro 3 ) observed that it is often assumed that consumption of all meat is increasing, while in Brazil the only meat whose consumption is increasing is processed meat. The present study indicates the same might be true in Norway.
Implications for health
Our study did not address nutrient contents of food consumption nor health outcomes, and health implications of our findings are thus difficult to assess. However, results from Canada may provide preliminary indications for Norway. One study showed that only the quintile of the population with lowest consumption of ultra-processed products was anywhere near fulfilling nutrient recommendations from the WHO( Reference Moubarac, Martins and Claro 10 ). The other 80 % of the population consumed more than half of energy intake through ultra-processed products and would need to reduce the energy share of these in the diet to meet the WHO nutrient intake recommendations. If the nutrient profile of such diets in Norway is similar to that in Canada, a reduction of purchases and consumption of ultra-processed products is necessary for the prevention of obesity and NCD.
The high consumption of sweet ultra-processed products is an issue of special concern for health. Energy share from sugar exceeds the recommended 10 %, and children and adolescents consume an even higher energy share from sweets than adults( 40 , Reference Andersen and Øverby 42 ). There is evidence of the link between excessive intake of free sugars, especially through sugar-sweetened beverages, and overweight and NCD( Reference Ambrosini, Oddy and Rae Chi 44 – 46 ). Although the high sugar intake is well known and problematic, the current study indicates that even more effort is needed on reducing intake of the sweet ultra-processed products that are the main vehicles for sugar intake.
The present study found increasing purchase and expenditure shares for fruits, berries, vegetables, roots and tubers, and fish and seafood within the minimally processed food group and decreasing purchase and expenditure shares for sweet ultra-processed products. These are dietary shifts in line with Norwegian dietary recommendations( 47 ). In Oslo, there was a significant shift in food sales towards a less processed consumption pattern. Market saturation for ultra-processed foods has been explained by increasing awareness of health outcomes in the population( Reference Kleiman, Ng and Popkin 39 ). This development is predicted by nutrition transition theory and the present findings may therefore be indications of Norwegian dietary patterns going into the fifth stage of the nutrition transition, as postulated by Popkin( Reference Popkin 48 ).
Our findings might be related to the increasing health awareness and focus on healthy diets that have been observed in Norway over the past years( Reference Bugge 49 , Reference Bugge 50 ). According to Euromonitor, health and wellness is the most prominent trend in Norway affecting demand for food and drink consumption( 51 ). Consumers are to a higher degree sceptic of the food selection in fast-food outlets due to health concerns and prefer improved selection of fruits, vegetables and foods with less fat and more fibre( Reference Bugge, Lillebø and Lavik 52 ). There is also attention to the health benefits of traditional foods and diets through the New Nordic Diet( Reference Mithril, Dragsted and Meyer 53 ).
A main characteristic of the increasing health awareness in Norway is attention to eating homemade meals based on ‘natural’ ingredients( Reference Bugge 49 , Reference Bugge 50 ), which can be related to our results regarding minimally processed foods. A recent study from Norway( Reference Bugge 50 ) found that the most important criteria for judging a food as healthy are being non-processed and ‘made from scratch’. Further, foods associated with mass production and the globalized food system have low status among Norwegian consumers. Between 2005 and 2013, the share of Norwegians agreeing that processed foods can be as healthy as other foods decreased from 51 % to 39 %( Reference Bugge 50 ). The foods most Norwegians are trying to avoid are sugar-sweetened beverages (78 %) and ready-made products (74 %)( Reference Bugge 54 ).
However, the overall level of purchases of and expenditure on ultra-processed products did not decrease, and for some, especially ready-to-eat/heat meals and processed meat and poultry, both purchases and expenditure increased. Further, limitations of the proxies used urge caution in interpreting observed changes as actual changes in consumption.
Policy implications
The present study indicates that Norwegian diets are composed predominantly of ultra-processed products, which is likely to be contributing to the rising rates of overweight, obesity and diet-related NCD in the country. Along with other studies, it indicates an alarmingly high consumption of ultra-processed food products high in sugar, salt, and saturated and trans-fats.
Norwegian efforts to improve diets are outlined in a recent White Paper on public health( 20 ), which calls for multisectoral action for improved health and nutrition. Strategies under implementation include:
-
1. information campaigns and promotion of dietary guidelines, which encourage consumption of fruits and vegetables, fish and whole-grain products, and limit consumption of sugar, red and processed meats, and products high in saturated fats and salt;
-
2. collaboration with the food industry in product reformulation, especially for reducing contents of salt, trans-fatty acids and palm oil;
-
3. a voluntary labelling scheme, ‘The Keyhole’, which indicates healthier choices within a food group based on criteria for contents of added sugar, salt and saturated fats; and
-
4. a voluntary self-regulation scheme on the marketing of unhealthy food products to children.
While these efforts are important, the evidence base for the effect of informational campaigns and voluntary efforts by the food industry is weak( Reference Moodie, Stuckler and Monteiro 38 , Reference Stuckler and Nestle 55 ). Although product reformulation and labelling are important strategies to help consumers make healthier choices, they may not reduce overall consumption of ultra-processed products. Additionally, it has been indicated( Reference Moodie, Stuckler and Monteiro 38 , Reference Stuckler and Nestle 55 , Reference Gomes and Lobstein 56 ) that there is a conflict between public health interests (reducing intake of ultra-processed products) and corporate interests (increasing sales of ultra-processed products). Efficient measures to reduce the consumption of sugar (especially sweet ultra-processed products), salt and fats will need to address such issues. Dietary guidelines that make recommendations on choice of foods and meals based on the food groups in the NOVA classification (as in Brazil) could be more suitable in the current context of eating to promote health and well-being( Reference Monteiro, Cannon and Moubarac 19 ), although further research for Norway would be needed for their development.
Research gaps and potential for future research
To further assess and confirm the findings from Norway, studies on the energy contribution of food groups in the new classification to the Norwegian diet are needed, as well as studies linking the consumption of specific groups to health outcomes. Research from Brazil( Reference Monteiro, Levy and Claro 3 ) and Canada( Reference Moubarac, Martins and Claro 10 ) indicates that socio-economic differences in intake of ultra-processed foods are present in low- and middle- income countries, but not in high-income countries. However, studies from Norway show socio-economic differences in food consumption (using ‘conventional’ food classifications)( Reference Andersen and Øverby 42 ) and in health( 20 ). Studies investigating socio-economic differences in intake of ultra-processed foods would therefore be of particular interest.
Conclusion
The present study indicates that Norwegian diets are composed predominantly of ultra-processed products, which account for 60 % of purchases and 50 % of food expenditure. Sweet ultra-processed products alone account for every third food purchase and a fifth of food expenditure. Drawing on findings from other countries, such diets are likely to be contributing to the rising rates of overweight, obesity and related NCD. Based on evidence from the present and previous studies, it is recommended to decrease the consumption of ultra-processed products and increase the consumption of meals prepared from minimally processed foods and culinary ingredients. This should be promoted through concerted policy efforts involving all sectors.
Acknowledgements
Financial support: This study received financial support from the Oslo and Akershus University College of Applied Sciences for purchase of the database from Statistics Norway. The funder had no role in the design, analysis or writing of this article. Conflict of interest: None. Authorship: The empirical design was planned by S.L.S. and S.I.G. Data analysis was conducted by S.L.S. and supervised by S.I.G. The initial draft was written by S.L.S. with substantial inputs from S.I.G. S.L.S., S.I.G. and L.T. developed successive drafts. Each author has seen and approved the content of the submitted manuscript. Ethics of human subject participation: Not applicable.


