


Consumption of a ‘Mediterranean diet’ has been associated with increased longevity and a decreased risk of chronic diseases, including CVD, compared with other types of diet( Reference Barzi, Woodward and Marfisi 1 ). These effects are attributed, in part, to the olive oil (OO) component of the diet( Reference López-Miranda, Pérez-Jiménez and Ros 2 ). Indeed, research comparing refined v. extra virgin OO has highlighted the biological effects of the polyphenols contained within the water-soluble fraction( Reference Yang, Kong and Zhang 3 ), in addition to other biologically active compounds such as phytosterols and lipid-soluble vitamins. The presence of these compounds in OO may underpin a degree of its health-promoting properties, relative to similar MUFA-rich oils( Reference Aguilera, Mesa and Ramirez-Tortosa 4 ). Compared to OO, the leaves of the olive plant (Olea europaea) contain similar phenolics, although at significantly higher concentrations than that of the olive fruit and derived oil (1450 mg total phenolics/100 g fresh leaf( Reference Silva, Gomes and Leitao 5 ) v. 110 mg/100 g fruit( Reference Kountouri, Mylona and Kaliora 6 ) and 23 mg/100 ml extra virgin OO7). The most abundant phenolic compounds present in the leaves are verbascoside, apigenin-7-glucoside, luteolin-7-glucoside, hydroxytyrosol (HT), tyrosol and the secoiridoid, oleuropein (see Fig. 1), with secoiridoids being uniquely present in plants of the Olearaceae family( Reference Servili and Montedoro 8 ).
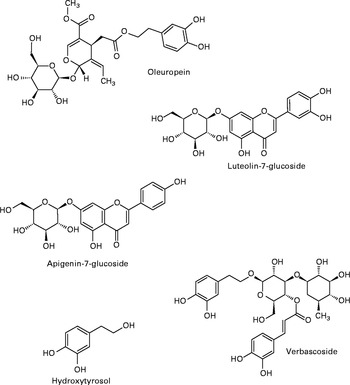
Fig. 1 Most abundant phenolics present in olive leaf.
Anecdotally, olive leaf has been reported useful in treating a range of medical conditions( Reference Leporatti, Posocco and Pavesi 9 ). Animal and in vitro data have suggested a wide array of bioactive properties for phenolic-rich olive leaf extract (OLE), including hypotensive( Reference Khayyal, Elghazaly and Abdallah 10 ), antioxidant( Reference Al-Azzawie and Alhamdani 11 ), anti-inflammatory( Reference Miles, Zoubouli and Calder 12 ), hypoglycaemic( Reference Al-Azzawie and Alhamdani 11 ), lipid-lowering( Reference Wang, Geng and Jiang 13 ) and vasoactive( Reference Petkov and Manolov 14 ) effects, many of which have been successfully replicated in human studies, leading to the conclusion that chronic OLE supplementation has the potential to modify CVD risk (for a review see Lockyer et al. ( Reference Lockyer, Yaqoob and Spencer 15 )). Phenolic-rich OO has been reported to improve vascular function relative to phenolic-poor OO, postprandially( Reference Ruano, Lopez-Miranda and Fuentes 16 , Reference Jiménez-Morales, Ruano and Delgado-Lista 17 ). However, data pertaining to the influence of OLE on vascular function are currently lacking. In the present study, we address this by determining the extent to which OLE intake influences two measures of CVD risk( Reference Vasan 18 ): arterial stiffness (assessed using digital volume pulse (DVP)) and inflammatory status in a postprandial setting. With respect to the latter, acute intake of OO, with a high phenolic content, has been shown to repress the expression of several pro-inflammatory genes in vivo, including the cytokines IL-6 and IL-1β( Reference Camargo, Ruano and Fernandez 19 ), though knowledge regarding the effects of OLE on inflammation is very limited.
Notably, if phenolic components are to mediate the actions of OO and OLE on vascular function and inflammatory processes in vivo, it is necessary that they are absorbed into the circulation. While absorption of phenolics following OO intake has been extensively explored( Reference Corona, Spencer and Dessì 20 ), only two studies( Reference Kendall, Batterham and Callahan 21 , Reference de Bock, Thorstensen and Derraik 22 ) using OLE have been conducted, and direct comparisons of specific absorption/metabolism profiles between OLE and OO cannot be made because of the presence of different phenolics, their relative concentrations and food matrix effects( Reference Visioli, Galli and Grande 23 ). As such, in the present study, we aim to assess the absorption and metabolism of polyphenols from OLE, in addition to the physiological outcomes, in order to build a greater understanding of the ‘cause-and-effect’ relationship between OLE intake and potential biological effects.
Experimental methods
Study population
Healthy male and female subjects were recruited from the University of Reading and the surrounding area via email and poster advertisements in May 2011. Smokers, those with alcohol consumption of more than 21 units/week, or those with any dietary restrictions, including vegetarians and those on weight-reduction diets, were excluded. Individuals who had suffered significant illness in the previous 12 months, or had gastrointestinal, blood-clotting or metabolic disorders, and females who were pregnant or breastfeeding were also excluded. Subjects had not taken antibiotics in the previous 3 months and were not taking any lipid-modifying or blood-clotting medication, vitamin, mineral and/or fish oil supplements at the time of completing the study. Potential subjects underwent a screening process and individuals with blood pressure >150/90 mmHg; Hb < 125 g/l for men and < 110 g/l for women; γ-glutamyl transferase>1·3 μkat/l or cholesterol >6·5 mmol/l were excluded from the study. Twenty suitable subjects were identified and recruited into the study. Two subjects completed one study visit and were lost to follow up; therefore, eighteen subjects completed the study. Based on a medium effect size with respect to stiffness index (a difference of 0·30 m/s) and population standard deviation (0·30 m/s), we retrospectively calculate that a sample size of fifteen participants would provide considerable power (0·97); therefore, we conclude that our sample size of eighteen provides ample statistical power for detecting a change in digital volume pulse-stiffness index (DVP-SI). Baseline characteristics of the subjects are detailed in online Supplementary Table S1.
Study design
The study was a double-blind, randomised, controlled, cross-over trial (Clinicaltrials.gov ID: NCT01479699) conducted according to the guidelines laid down in the Declaration of Helsinki. All procedures involving human subjects were approved by the University of Reading Research Ethics Committee (UREC 11/30). Written, informed consent was obtained from all subjects. Eighteen subjects (nine male, nine female) aged 19–40 years completed two clinical visits at the Hugh Sinclair Nutrition Unit, University of Reading, approximately 4 weeks apart between June and September 2011. Female subjects completed both visits during the same phase of their menstrual cycle in an attempt to control for any possible effects of hormones on vascular function( Reference Williams, Westerman and Kingwell 24 ). Subjects were asked to consume a low polyphenol diet (devoid of tea, coffee, fruit, vegetables, alcoholic beverages, cocoa, wholegrain and avoiding all olive-containing products in particular) for 24 h before the start of each study day and remained on this diet until after the last urine sample was collected. Compliance was confirmed by the HPLC analysis of baseline urine samples. Subjects arrived at the clinical unit in a 12-h fasted state. A cannula was inserted into the arm and a baseline blood sample collected. Subjects ingested either four capsules containing OLE or four control capsules as suggested by the product manufacturer. Blood samples were collected at baseline and 1, 3 and 6 h after capsule ingestion. Vascular function was measured by PCA2 Pulse Trace (Micromedical) to obtain DVP at baseline and 0·5, 1, 1·5, 2, 3, 4, 6 and 8 h after capsule ingestion. Urine was collected at baseline, 0–4, 4–8 and 8–24 h after capsule consumption. Samples were centrifuged at 1800 g , 4°C for 10 min and frozen at − 80°C until analysis. The total volume of urine produced during each time period was recorded. Subjects were provided with a standard low-fat lunch of low phenolic content (one ham sandwich and one low-fat cheese sandwich on white bread with very-low-fat margarine and a very-low-fat yoghurt) after the 4-h sample collection and a meal of low phenolic content (chicken, ham and mashed potato) after the 8-h samples. Low-nitrate mineral water (Buxton) was provided to subjects during the whole intervention period as required.
Test products
Four OLE capsules contained a total of 1600 mg OLE (400 mg per capsule in 672·5 mg safflower oil) delivering a total of 51·12 mg oleuropein and 9·67 mg HT, as verified by two independent laboratories at Southern Cross University, Australia, and The Cawthron Institute, New Zealand. The full phenolic profile can be found in Table 1. Control capsules each contained 900 mg safflower oil and were identical in size and appearance to OLE capsules. All capsules were provided by Comvita New Zealand Limited and product safety was assessed as previously detailed( Reference de Bock, Derraik and Brennan 25 ).
Table 1 Phenolic content of olive leaf extract capsules
* Calculated as caffeic acid.
Measurement of vascular function
Subjects were asked to rest supine during DVP measurements. The DVP was obtained by photoplethysmography of the index finger using the PulseTrace PCA2 system to calculate stiffness index (DVP-SI). The Pulse Trace is operator independent and very reproducible. Stiffness index has been found to be positively correlated with cardiovascular risk factors including age, blood pressure, waist:hip ratio and carotid thickness( Reference Wykretowicz, Gerstenberger and Guzik 26 ). Stiffness index values are sensitive to small changes in vascular tone induced by vasodilators( Reference Millasseau, Ritter and Chowienczyk 27 ) and are strongly correlated with central pulse-wave velocity, a recognised measure of arterial stiffness.
Urinary phenolic analysis
Bioavailability of phenolic compounds present in OLE was assessed by HPLC analysis of urine. Before analysis, the samples were subjected to β-glucuronidase treatment (an enzyme that also has sulfuronidase activity) in order to cleave glucuronide and sulphate moieties, yielding polyphenol aglycones for detection by HPLC. As such, peaks identified by HPLC represent the sum of excretion of pure compounds and all conjugates (e.g. the presence of HT aglycone and any HT glucuronides and sulphates would be indicated by the HT peak). After centrifugation (2 min at 13 000 g ), urine samples were mixed in a 1:1 ratio with 0·05 m-ammonium acetate buffer adjusted to pH 5 with acetic acid (final volume 0·8 ml). β-Glucuronidase (50 mg; Helix pomatia; Sigma Aldrich) in 500 μl sodium acetate buffer (0·1 m) was added to the samples, which were then vortexed before incubation at 37°C for 90 min. After incubation, 10 μl acetic acid was added to the samples on ice. The samples were centrifuged again at 13 000 g for 2 min and 0·6 ml distilled water was added before solid-phase extraction using a vacuum manifold with Strata C18-E (55 μm, 70A) cartridges (Phenomenex). The cartridges were conditioned with 1 ml methanol and equilibrated with 2 ml 0·05 m-ammonium acetate solution before sample loading and separation under gravity. To elute phenolics, the cartridges were washed with 1 ml 0·05 m-ammonium acetate buffer and dried under vacuum for 5 min. Collection tubes were changed and 2·5 ml ethyl acetate was added to each cartridge. The collection tubes were taken to complete dryness using a Speedvac system (Thermo Fisher Scientific, Inc.). Dried extracts were reconstituted in 125 μl mobile phase A (95 % water, 5 % methanol, 0·1 % 5 m-HCl) and vortexed for 5 min. The samples were centrifuged for 2 min at 13 000 g , and finally the supernatants were added to the HPLC vials.
HPLC analysis was performed to characterise and quantify the identifiable phenolic components. Precisely 50 μl of the extracted urine sample was injected into the HPLC system. Separation of phenolic constituents was achieved using reverse-phase HPLC using a Nova-Pak C18 column (4·6 × 250 mm) (Waters) with 4 μm particle size. A Waters 626 pump and 600-controller system with an auto-injector 717 and a photodiode array detector 996 linked to the Millennium Software system was utilised. The temperature of the column was maintained at 30°C. The mobile phase consisted of A: 95 % water, 5 % methanol, 0·1 % 5 m-HCl and B: 50 % acetonitrile, 50 % water and 0·1 % HCl and was pumped through the column at 0·7 ml/min. The following gradient system was used (min/% B): 0/5, 50/100, 60/100, 65/5, for detection of all compounds. The eluant was monitored by photodiode array detection at 280 nm and the spectra of products were obtained over the 220–600 nm range. The following pure standard compounds were purchased from Extrasynthese: oleuropein, HT, tyrosol, homovanillic alcohol (HValc). 3,4-Dihydroxyphenylethanol-elenolic acid (EA, oleuropein aglycone) and 3,4-dihydroxyphenylethanol-elenolic acid dialdehyde (EDA, oleuropein aglycone di-aldehyde) were obtained as previously described by our group( Reference Pinto, Paiva-Martins and Corona 28 ). Calibration curves were constructed using authentic standards (0–100 μm), and in each case were found to be linear with correlation coefficients of >0·99. Compounds identified in the samples were characterised by retention times (RT) and spectral similarity to standards. Compounds identified in urine were quantified after adjustment for volume of urine produced.
Whole blood culture
Blood was collected into heparin tubes (Greiner BioOne Limited) at baseline and 1, 3 and 6 h after capsule consumption. These time points were selected in an attempt to capture probable peak phenolic concentrations in plasma( Reference de Bock, Thorstensen and Derraik 22 ). Whole blood was immediately diluted 1/1 with Roswell Park Memorial Institute 1640 medium (Lonza Wokingham Limited), supplemented with 1 % antibiotics (Penicillin 10·000 UI/ml streptomycin 10·000 UI/ml Lonza Wokingham Limited). Precisely 1·8 ml diluted blood was added to one well in a twenty-four-well plate. Lipopolysaccharide was added to give a final concentration of 1 μg/ml. An additional well containing 1·8 ml diluted blood and 0·2 ml medium served as a control. The plates were incubated at 37°C in a 5 % CO2 atmosphere for 24 h. After incubation, the contents of the well were removed and centrifuged at 1000 g for 2 min. Supernatants were collected and stored at − 80°C until analysis.
Cytokine analysis
IL-1β, IL-6, IL-10, TNF-α and IL-8 concentrations were measured in whole blood culture supernatants using a Human base kit Panel A Fluorokine MAP (Multi-analyte Profiling) ELISA (R&D Systems Europe Limited) and a Luminex 200 Analyser (Invitrogen) following standard instructions provided by the manufacturer.
Statistical analysis
Prism (GraphPad Software) was used to analyse the data. Data were tested for normality using a K–S test. Differences in DVP-SI, IL-1β, IL-6, TNF-α, IL-8 and IL-10 in ex vivo whole blood cultures by treatment were identified using a two-way ANOVA with repeated measures. Post hoc analysis was subjected to Bonferroni correction. P values less than 0·05 were treated as significant.
Results
Vascular function
The stiffness index (DVP-SI) changed significantly from baseline over the course of the study day (significant time effect, F 1,7= 3·23; P= 0·0028, Fig. 2). In addition, there was a highly significant treatment effect on DVP-SI (F 1,7= 7·05; P= 0·0085), with means of 0·76 (sem 1·63) m/s for the control group and 3·36 (sem 1·79) m/s for the OLE group over the course of the trial, indicating that arterial stiffness was significantly lower over the study day after consumption of the OLE capsules compared with the control capsules. However, post hoc analysis indicated no interaction between DVP-SI and treatment at any individual time point. In addition, there was a trend for OLE to attenuate the post-meal increase in arterial stiffness (between 240 and 480 min) (P= 0·074) (Fig. 2).

Fig. 2 Effect of olive leaf extract (OLE) on digital volume pulse-stiffness index. Values are mean changes from baseline with their standard errors represented by vertical bars (n 18) after ingestion of 1600 mg OLE (![]() ) or a control (
) or a control (![]() ) on a single occasion. Two-way ANOVA with repeated measures revealed a significant treatment effect (P= 0·0085) and a time effect (P= 0·0028). A colour version of this figure can be found online at http://www.journals.cambridge.org/bjn
) on a single occasion. Two-way ANOVA with repeated measures revealed a significant treatment effect (P= 0·0085) and a time effect (P= 0·0028). A colour version of this figure can be found online at http://www.journals.cambridge.org/bjn
Ex vivo cytokine production
Ex vivo, lipopolysaccharide-stimulated IL-8 production in whole blood cultures (isolated from human participants on the study) was significantly lower (F 1,2= 4·7; P= 0·0326; Fig. 3) after OLE consumption (7368 (sem 856) pg/ml) compared to the control (15 200 (sem 1756) pg/ml). Post hoc analysis revealed no interaction between treatment and any individual time point. There was no significant effect of treatment on ex vivo production of IL-1β, IL-6, TNF-α or IL-10 (data not shown).

Fig. 3 Effect of olive leaf extract (OLE) on ex vivo lipopolysaccharide-stimulated IL-8 production in whole blood cultures. Values are mean changes from baseline with their standard errors represented by vertical bars (n 16) after ingestion of 1600 mg OLE (![]() ) or a control (
) or a control (![]() ) on a single occasion. Two-way ANOVA with repeated measures revealed a significant treatment effect (P= 0·0326). A colour version of this figure can be found online at http://www.journals.cambridge.org/bjn
) on a single occasion. Two-way ANOVA with repeated measures revealed a significant treatment effect (P= 0·0326). A colour version of this figure can be found online at http://www.journals.cambridge.org/bjn
Bioavailability
Analysis of urine samples by HPLC indicated the presence of HT (RT: 8·6 min), tyrosol (RT: 14·0 min), HValc (RT: 17·3 min), EDA (RT: 30·3 min), oleuropein (RT: 38·3 min) and EA (RT: 41·3 min) following the intake of OLE (for an example chromatogram see online Supplementary Fig. S1). In addition, a number of other secoiridoid peaks were observed, which were likely to have been derived from the metabolism of oleuropein. These compounds (four of which were observed at RT: 31·7, 34·1, 37·2 and 38·8 min (online Supplementary Fig. S1)), were characterised by RT and spectral similarity to either EDA or oleuropein, although their exact identity remains unconfirmed due to a lack of standards and/or mass spectral data. Compounds derived from oleuropein and eluting between 30 and 60 min, including EA and EDA, were grouped together and tentatively quantified as ‘oleuropein equivalents’. HT and its conjugates were identified in urine samples collected at 0–4, 4–8 and 8–24 h, with levels peaking at 4–8 h (Fig. 4). HValc and its conjugates were found to increase steadily in the urine of subjects between 0 and 8 h, peaking between 8 and 24 h (Fig. 5). Tyrosol was identified in the urine of one individual (see online Supplementary Fig. S1). Finally, oleuropein equivalents were excreted steadily over the course of the study period, peaking at 8–24 h following OLE consumption (Fig. 6). The grouped oleuropein metabolites represented the most abundant breakdown product of the OLE capsules. Baseline blood samples were devoid of any compounds of interest.

Fig. 4 (a) Time-dependent appearance of hydroxytyrosol (HT) and conjugates in urine and (b) corresponding cumulative excretion 24 h following ingestion of olive leaf extract (OLE) capsules. Values, derived from HPLC analysis, are means with their standard errors represented by vertical bars (n 18) after ingestion of 1600 mg OLE, containing 51·12 mg oleuropein and 9·67 mg HT, on a single occasion. ![]() , Baseline;
, Baseline; ![]() , 0–4 h;
, 0–4 h; ![]() , 4–8 h;
, 4–8 h; ![]() , 8–24 h.
, 8–24 h.
Fig. 5 (a) Time-dependent appearance of homovanillic alcohol (HVA), a breakdown product of hydroxytyrosol, and conjugates in urine and (b) corresponding cumulative excretion 24 h after ingestion of olive leaf extract (OLE) capsules. Values, derived from HPLC analysis, are means with their standard errors represented by vertical bars (n 18) after ingestion of 1600 mg OLE, containing 51·12 mg oleuropein and 9·67 mg HT, on a single occasion. ![]() , Baseline;
, Baseline; ![]() , 0–4 h;
, 0–4 h; ![]() , 4–8 h;
, 4–8 h; ![]() , 8–24 h.
, 8–24 h.

Fig. 6 (a) Time-dependent appearance of oleuropein metabolites in urine and (b) corresponding cumulative excretion, 24 h following ingestion of olive leaf extract (OLE) capsules. Values, derived from HPLC analysis, are means with their standard errors represented by vertical bars (n 18) after ingestion of 1600 mg OLE, containing 51·12 mg oleuropein and 9·67 mg HT, on a single occasion. ![]() , Baseline;
, Baseline; ![]() , 0–4 h;
, 0–4 h; ![]() , 4–8 h;
, 4–8 h; ![]() , 8–24 h.
, 8–24 h.
Discussion
In the present investigation, we provide evidence that acute consumption of OLE, an alternative source of olive phenolics, improves vascular function and reduces the production of an inflammatory cytokine. These observations are supported by quantitative data regarding the absorption of OLE phenolics, indicating the bioavailability of HT, tyrosol, HValc, oleuropein, and for the first time in relation to OLE, EDA and EA and their metabolites in urine. Specifically, OLE led to reduced arterial stiffness, a risk factor and independent predictor for CVD( Reference Malik, Kondragunta and Kullo 29 ). Our finding is in agreement with existing data, indicating that OO phenolics are capable of improving vascular function( Reference Ruano, Lopez-Miranda and Fuentes 16 , Reference Jiménez-Morales, Ruano and Delgado-Lista 17 ), although the latter study has been called into question because of the criticisms of the methodology( Reference Gori 30 ) and the level of OO intake (40 ml) used representing a high intake for a single meal( Reference Giugliano and Esposito 31 ). The present study intervened with a phenolic-rich OLE supplement, thus avoiding the concurrent delivery of high amounts of fat and energy.
Previous studies have begun to uncover the potential mechanism by which olive and related products may induce vascular improvements. For example, two studies( Reference Ruano, Lopez-Miranda and Fuentes 16 , Reference Jiménez-Morales, Ruano and Delgado-Lista 17 ) observed an increase in plasma nitrates and nitrites, indicating increased levels of NO, a known vasodilator. Although we did not measure NO metabolites in the present study, absorbed phenolic metabolites are thought to influence NO bioavailability via their potential to inhibit NAPDH-oxidase and the production of superoxide( Reference Steffen, Gruber and Schewe 32 ). In support of this concept, a recent study has reported that acute blueberry intake leads to improved blood flow, which was paralleled by inhibition of neutrophil NADPH oxidase and the appearance of plasma phenolic metabolites( Reference Rodriguez-Mateos, Rendeiro and Bergillos-Meca 33 ). Indeed, HT, tyrosol and their metabolites have significant structural homology to the pharmacological NADPH-oxidase inhibitor apocynin( Reference Stolk, Hiltermann and Dijkman 34 ), and have been proposed as potent NAPDH-oxidase inhibitors in the endothelial cells( Reference Steffen, Gruber and Schewe 32 ). In the present study, we detected various oleuropein-like metabolites in urine along with HValc and HT in lesser amounts. In addition to supporting the phenolic acid-driven mechanism of vascular effects through NADPH oxidase inhibition, our data suggest that oleuropein may be absorbed, something debated in the previous literature (see online Supplementary Fig. S2)( Reference Lockyer, Yaqoob and Spencer 15 ). Notably, one study has reported five different glucuronides of oleuropein aglycone in urine (with no HT)( Reference Kendall, Batterham and Callahan 21 ) and another reporting predominantly glucuronidated HT and negligible oleuropein( Reference de Bock, Thorstensen and Derraik 22 ).
The level of oleuropein metabolites identified in urine in the present study is in agreement with a previous ileostomy patient study that reported substantial absorption of OO phenolics (55–66 %( Reference Vissers, Zock and Roodenburg 35 )). In addition, the excretion profile of HT suggests both small (0–4 h; absorption of free HT present in the OLE) and large (4 h onwards; liberated HT from bacterially metabolised oleuropein)( Reference Corona, Tzounis and Assunta DessÌ 36 ). Furthermore, the appearance of HValc is likely to result from the O-methylation of HT by catechol-O-methyltransferase in the large intestinal gut wall and/or the liver. It is possible that two of the unidentified oleuropein-derived compounds peaks are 3,4-DHPEA-EAH2 and 3,4-DHPEA-EDAH2, which have previously been suggested as potential metabolites of EA and EDA, respectively( Reference Pinto, Paiva-Martins and Corona 37 ). Only one previous study( Reference de Bock, Thorstensen and Derraik 22 ) reports quantitative data regarding OLE metabolites in plasma, suggesting peak plasma concentrations of 0·52 ng/ml oleuropein and 61 ng/ml HT after OLE consumption.
Evidence suggests that lipaemia induced after consumption of high and moderate fat-containing meals causes acute vascular dysfunction( Reference Marchesi, Lupattelli and Schillaci 38 ). In the present study, our intervention meal (containing 7·6 g fat and 48·5 g carbohydrate) caused an increased DVP-SI, peaking at 480 min. However, there was a trend in our data suggesting that intake of OLE may attenuate the postprandial vascular impairment. Our data reflect previous observations that phenolic-rich vegetables are capable of attenuating high-fat-meal-induced increases in blood pressure in the presence of l-arginine, thus restoring vascular homeostasis( Reference Esposito, Nappo and Giugliano 39 ). Postprandial lipaemia has also been associated with an increase in circulating inflammatory cytokines( Reference Nappo, Esposito and Cioffi 40 ). In the present study, increases in cytokines were not observed, probably due to the relatively low fat content of the meal. However, postprandial activation and recruitment of neutrophils appears to be associated with a concomitant increase in IL-8, hydroperoxide and endothelial dysfunction( Reference van Oostrom, Sijmonsma and Verseyden 41 ). As such, the reduction in ex vivo production of IL-8 by an acute dose of OLE may at least partly explain the post-ingestion reduction in DVP-SI.
The anti-inflammatory effects of olive phenolics have been previously indicated( Reference Miles, Zoubouli and Calder 12 , Reference Wang, Geng and Jiang 13 , Reference Petroni, Blasevich and Salami 42 ), indeed, OLE is used as an ingredient in a patented haemorrhoid treatment( Reference Rizza, Munafo and Serraino 43 ). In the present study, OLE specifically modulated ex vivo production of IL-8, a low-molecular-weight cytokine produced by a variety of cell types, including monocytes and endothelial cells( Reference Peveri, Walz and Dewald 44 ). We suggest that the present ex vivo work, which used samples derived from the postprandial intervention, is reliable as the OLE metabolites generated in vivo were present in the blood used and therefore this is arguably representative of the physiological scenario. It has been postulated that IL-8 plays a key role in the development of atherosclerosis along with other pro-inflammatory cytokines( Reference Frostegård, Ulfgren and Nyberg 45 ). IL-8 may also destabilise existing atherosclerotic plaques by down-regulation of tissue inhibitors of metalloproteinases( Reference Shin, Szuba and Rockson 46 ). Although cytokines are not held in the same regard as other biomarkers such as blood pressure and plasma lipids( Reference D'Agostino, Pencina and Massaro 47 ), circulating levels of IL-8 have been positively associated with future CVD risk( Reference Boekholdt, Peters and Hack 48 ). It has been hypothesised that endogenously produced reactive oxygen species directly induce the transcription and translation of IL-8( Reference DeForge, Fantone and Kenney 49 ). OLE phenolics may selectively inhibit IL-8 production via their redox activity( Reference Al-Azzawie and Alhamdani 11 ), in particular oleuropein and HT, which contain redox-active catechol groups. Green tea catechins and curcumin have also been shown to specifically interfere with IL-8 gene expression through inhibition of NF-κB activation( Reference Rahman, Biswas and Kirkham 50 ). Similarly, in vitro work has suggested that oleuropein aglycone and HT repress vascular cell adhesion molecule 1 gene transcription by blocking activator protein-1 and NF-κB activation( Reference Carluccio, Siculella and Ancora 51 ).
The present study provides novel data regarding the positive effects of acute consumption of olive (poly)phenols on the human vasculature. Our data support the concept that OLE positively modulates vascular function and IL-8 production in vivo via the actions of absorbed phenolic metabolites and add to growing evidence that olive phenolics could be beneficial for vascular health. Our data also provide further information relating to the absorption and metabolism of OLE phenolics per se, suggesting that oleuropein metabolites do enter the circulation. One caveat is that the product used has not been completely characterised; in other words, that other bioactives previously identified in OLE, such as minerals, triterpenoids and squalene( Reference Preedy and Watson 52 ), could have been responsible for the observed response. Nevertheless, the findings presented here add weight to the concept that OLE could represent an important dietary tool in lowering CVD risk.
Supplementary material
To view supplementary material for this article, please visit http://dx.doi.org/10.1017/S0007114515001269
Acknowledgements
S. L. would like to thank the following people for their contributions: Kim Jackson and Rada Mihaylova for cannulation of subjects, Rhoyu Zhang and Edna Nyangale for help with implementation of this human study. Angelika Kristek, Doriane Gérard and Amélie Abelard for help with subsequent analytical work.
This work was funded by Comvita Limited and Callaghan Innovation, who supported 50 % of the funding as a Technology for Business Growth grant.
Comvita had no part in the design or running of the study or analysis; therefore, the authors declare no conflict of interest.
The authors' contributions are as follows: S. L., J. P. E. S., P. Y. and I. R. designed the research. S. L. conducted the research. G. C. aided with laboratory and subsequent analytical work. S. L. analysed the data. S. L. wrote the paper with contributions from all authors. J. P. E. S. had primary responsibility for final content.


