


Introduction
The goal of radiotherapy is achieving maximal tumour control with optimal dose distributions while avoiding excess radiation exposure of surrounding critical organs to avoid treatment-related toxicities. To achieve this goal, medical linear accelerators with the capability of various photon energy options and multileaf collimators (MLC) are used in generation of optimal treatment plans. Dose calculation algorithms used in treatment planning systems (TPS) directly affect dose delivery accuracy which will lead to better tumour control as well as better critical organ sparing.Reference Dorje 1 To meet the International Commission on Radiation Units criteria, dose calculation accuracy must be within 2–3%. 2
Contemporary TPS have been introduced for achieving optimal treatment plans in the modern era of advanced technology. Collapsed cone convolution (CCC) and pencil beam (PB) algorithms are commonly used in radiotherapy treatment planning process. For homogeneous media such as water, there is not much difference in accuracy for these calculation algorithms. For heterogeneous media, radiological path length is used in place of the actual length to account for the difference in electron density from water, and convolution evolves to convolution-superposition.Reference Lanchun 3 However, problems such as field transitions, that is lung tissue, skin entrance, irregular fields and difficulties in achieving lateral equilibrium may occur.
PB algorithm dose calculation depends on dose distributions in narrow PB. Dose calculations are acquired by dose kernels, which are homogeneous in water. Inhomogeneity correction in PB algorithm takes into account only the central axis along the beam path. This may result in unpredicted errors in dose calculation for lung or chest wall containing high or low-density heterogeneity. Original body of the patient contains different densities that warrant the use of correction factors for each PB accounting for beam degradation.
CCC refers to a volume-oriented algorithm that involves a convolution technique among dose deposition kernels and the total energy released per unit mass. It is also capable of accounting for the lateral energy transport and may deal with effects of tissue heterogeneities in areas of perturbed electronic equilibrium such as tissue–air interfaces and tissue–bone interfaces.Reference Buzdar, Afzal and Todd-Pokropek 4
Materials and Methods
In this study, Alderson Rando phantom and Thermoluminescent Dosimeter-100 (TLD-100) were used in dosimetric verification of TPS. The TLD-100 devices used in calculations were heated at 400°C for 1 hour and were then irradiated to 50 cGy at 100 cm source skin distance (SSD) and 5 cm phantom depth at 10×10 cm2 field size for calibration and labelling. WinRems programme and HARSHAW TLD™ Model 3500 (Thermo Fisher Scientific MA USA) were used in acquisition of dose values. The dosimetric verification and comparative analysis were carried out for two different TPS using CCC and PB algorithms for treatment sites of head and neck, chest wall–supraclavicular region, lung and prostate.Reference Butts and Foster 5
A photon irradiation of 6 MV was performed on both PB and CCC algorithms. For PB algorithm Elekta-Synergy® Linear Accelerator (Elekta AB Stockholm Sweden) including 80 leaves MLC of 1 cm diameter at 100 cm SSD with Elekta Precise Plan Release 2·16 (Elekta AB Stockholm Sweden) TPS and for CCC algorithm Siemens® ARTISTE™ Linear Accelerator (Siemens Medical Solutions USA) Linear Accelerator including 160 leaves MLC of 0·5 cm diameter at 100 cm SSD with Prowess Panther 120 v5·10 (Prowess Inc. CA USA) TPS were used. After acquisition of computed tomographic images of Rando phantom at GE Light Speed RT (General Electric Healtcare USA) device, delineation was performed at Advance SimMD contouring Workstation. All treatment sites were irradiated with aforementioned linear accelerators at 2 Gy/fraction.
For treatment planning of the head and neck region, target volumes of clinical target volume (CTV), planning target volume (PTV) and critical organs including eyes, lenses, optic nerves, chiasm, oral cavity, brain, brainstem, spinal cord, parotids and lungs were contoured. TLDs were localised along the central beam axis as well as its right and left appropriate locations within 3, 4 and 5 cm depths from skin and lungs in the supraclavicular treatment region.
CTV and supraclavicular region target volumes as well as critical organs including lungs, spinal cord, heart and oesophagus were delineated for the chest wall–supraclavicular region treatment planning. Dosimetric calculation was performed by TLDs which were placed along the central axis within 1, 3, 5·5 and 13 cm depth from skin, field edge and in the lungs.
In the lung treatment planning, gross tumour volume (GTV), CTV, PTV along with critical organs such as lungs, spinal cord, heart and oesophagus were contoured. TLDs were placed along the central axis within 0·7, 1·5, 5, 7 and 9 cm depth from skin, field edge, in the lungs and heart for dosimetric calculation.
Unlike other treatment plannings, the prostate had only one target volume which was PTV72. Critical organs including femoral heads, rectum, bladder, bowel and target volume were contoured. In order to perform dosimetric calculations, TLDs were placed along the central beam axis as well as its right and left appropriate locations within 1·1, 2·1, 3·3, 6 and 8 cm depth from skin.
Results and Discussion
Head and neck treatment planning
Head and neck treatment fields include two head and neck lateral fields as well as one anterior-posterior (AP) supraclavicular field shown in Figure 1. The first phase of treatment was planned, 46 Gy for head and neck and 50 Gy for supraclavicular region. Supraclavicular region and head and neck region were irradiated in the same fractions. Comparative analysis of point doses with PB and CCC algorithms were shown in Table 1. Location number, Rando phantom slice number and TLD number for head and neck treatment fields are shown in Figures 2a–2f.
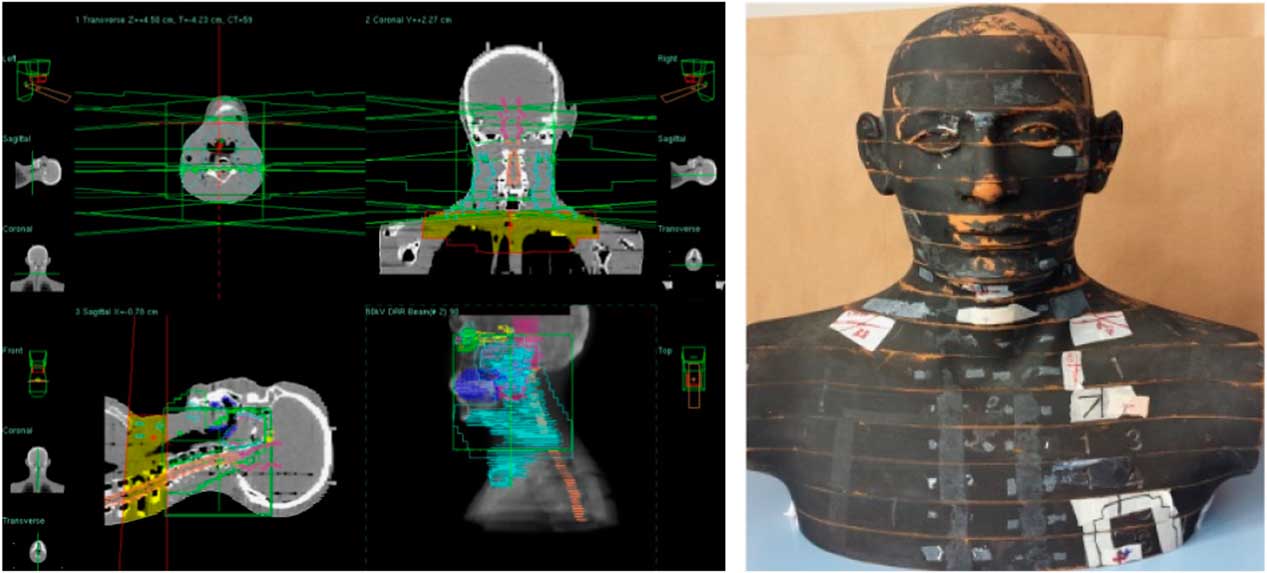
Figure 1 Head and neck treatment fields.
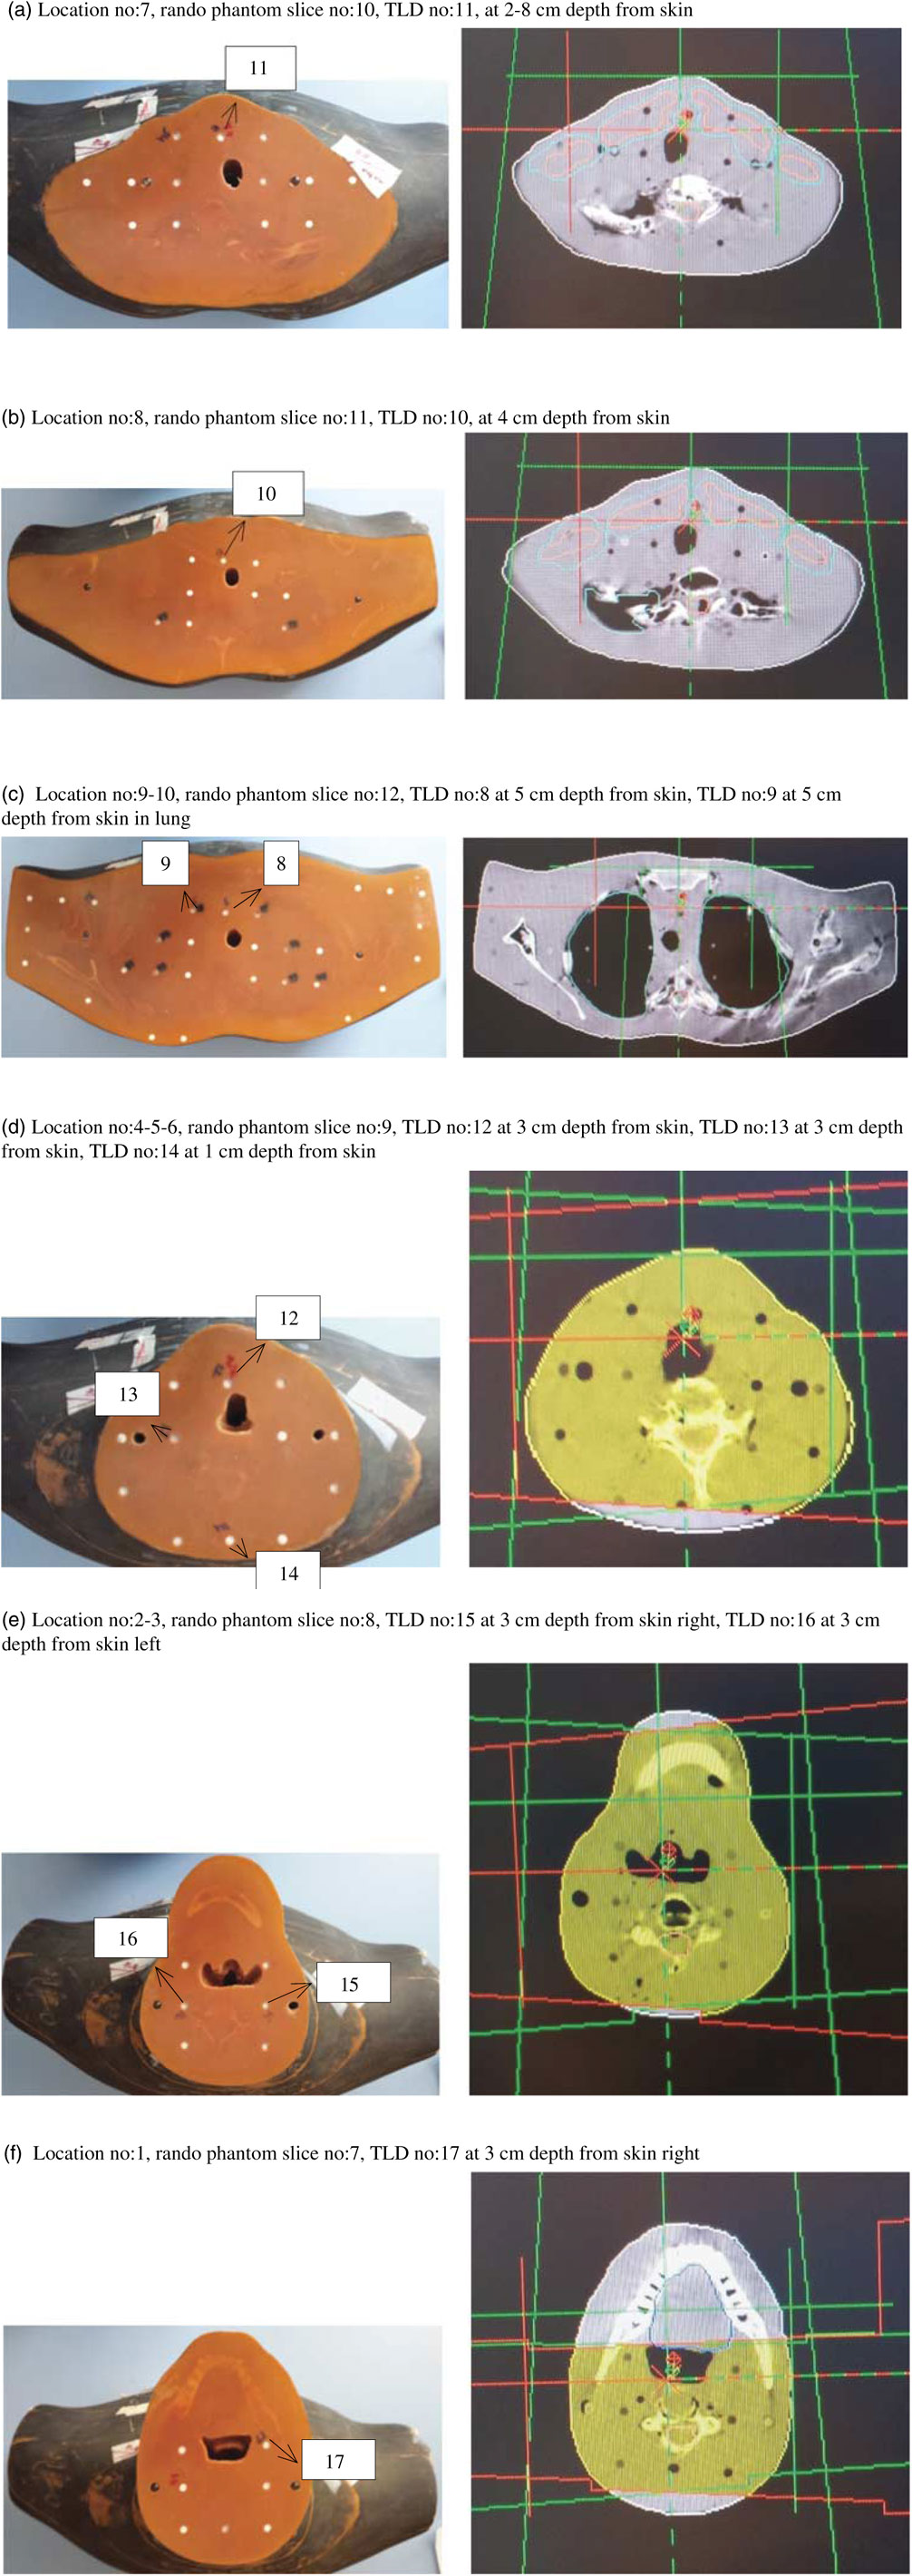
Figure 2 Location number, Rando phantom slice number, Thermoluminescent Dosimeter (TLD) number and TLD location for head and neck treatment fields.
Table 1 Demonstrating comparative analysis of point doses and Thermoluminescent Dosimeter (TLD) measured doses acquired from treatment planning systems with pencil beam (PB) and collapsed cone convolution (CCC) algorithms for head and neck treatment plannings

For head and neck treatment plannings, the most prominent difference between PB and CCC algorithms were found at the supraclavicular region including the lung point dose in treatment field. Point dose measurement values were higher with the PB algorithm compared with CCC algorithm. Figure 3 shows comparative analysis of point doses with PB and CCC algorithms for head and neck treatment plannings.
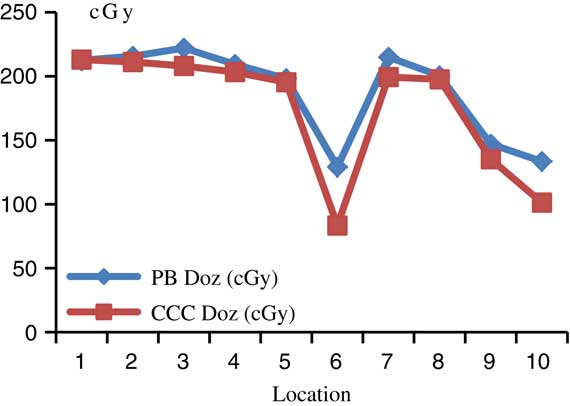
Figure 3 Comparative analysis of point doses with pencil beam (PB) and collapsed cone convolution (CCC) algorithms for head and neck treatment plannings.
Chest wall–supraclavicular region treatment planning
Chest wall–supraclavicular treatment fields include two chest wall oblique lateral fields and one AP supraclavicular field shown in Figure 4. Chest wall–supraclavicular treatment fields were irradiated in the same fraction and total of 50 Gy were delivered. Comparative analysis of point doses with PB and CCC algorithms were shown in Table 2. Location number, Rando phantom slice number and TLD number for chest wall–supraclavicular region treatment fields are shown in Figures 5a–5f.
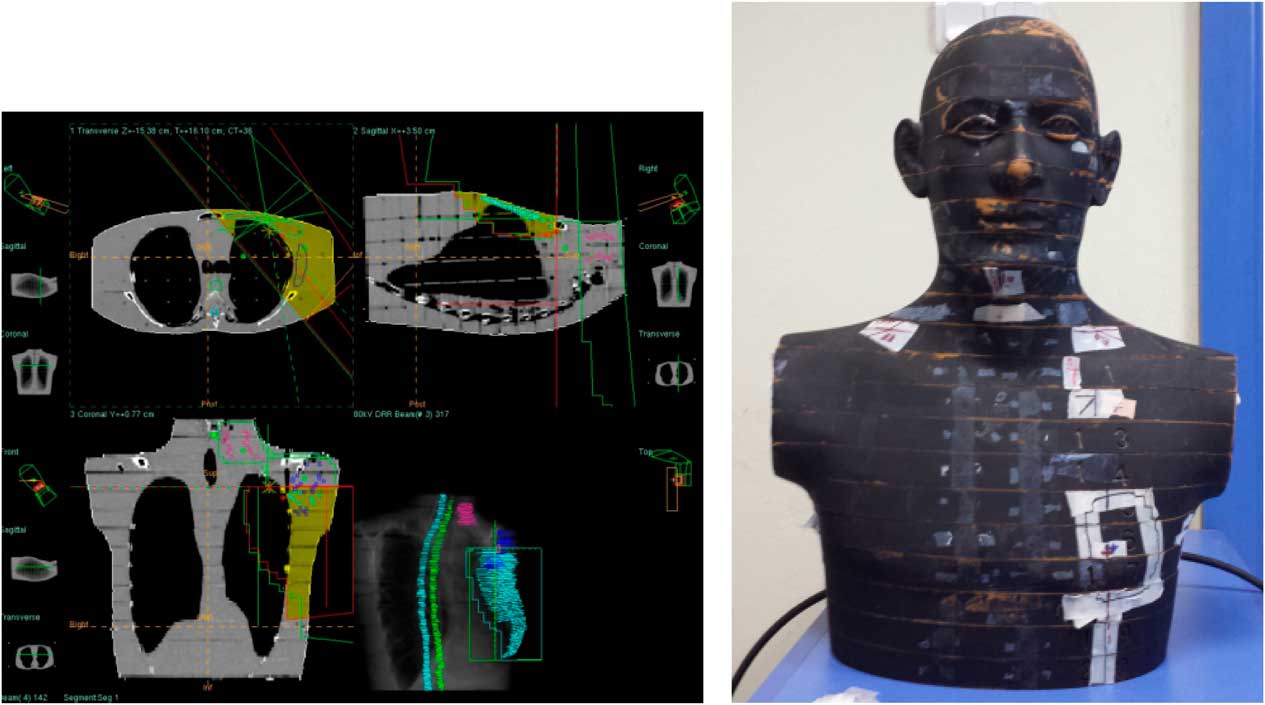
Figure 4 Chest wall–supraclavicular region treatment fields.
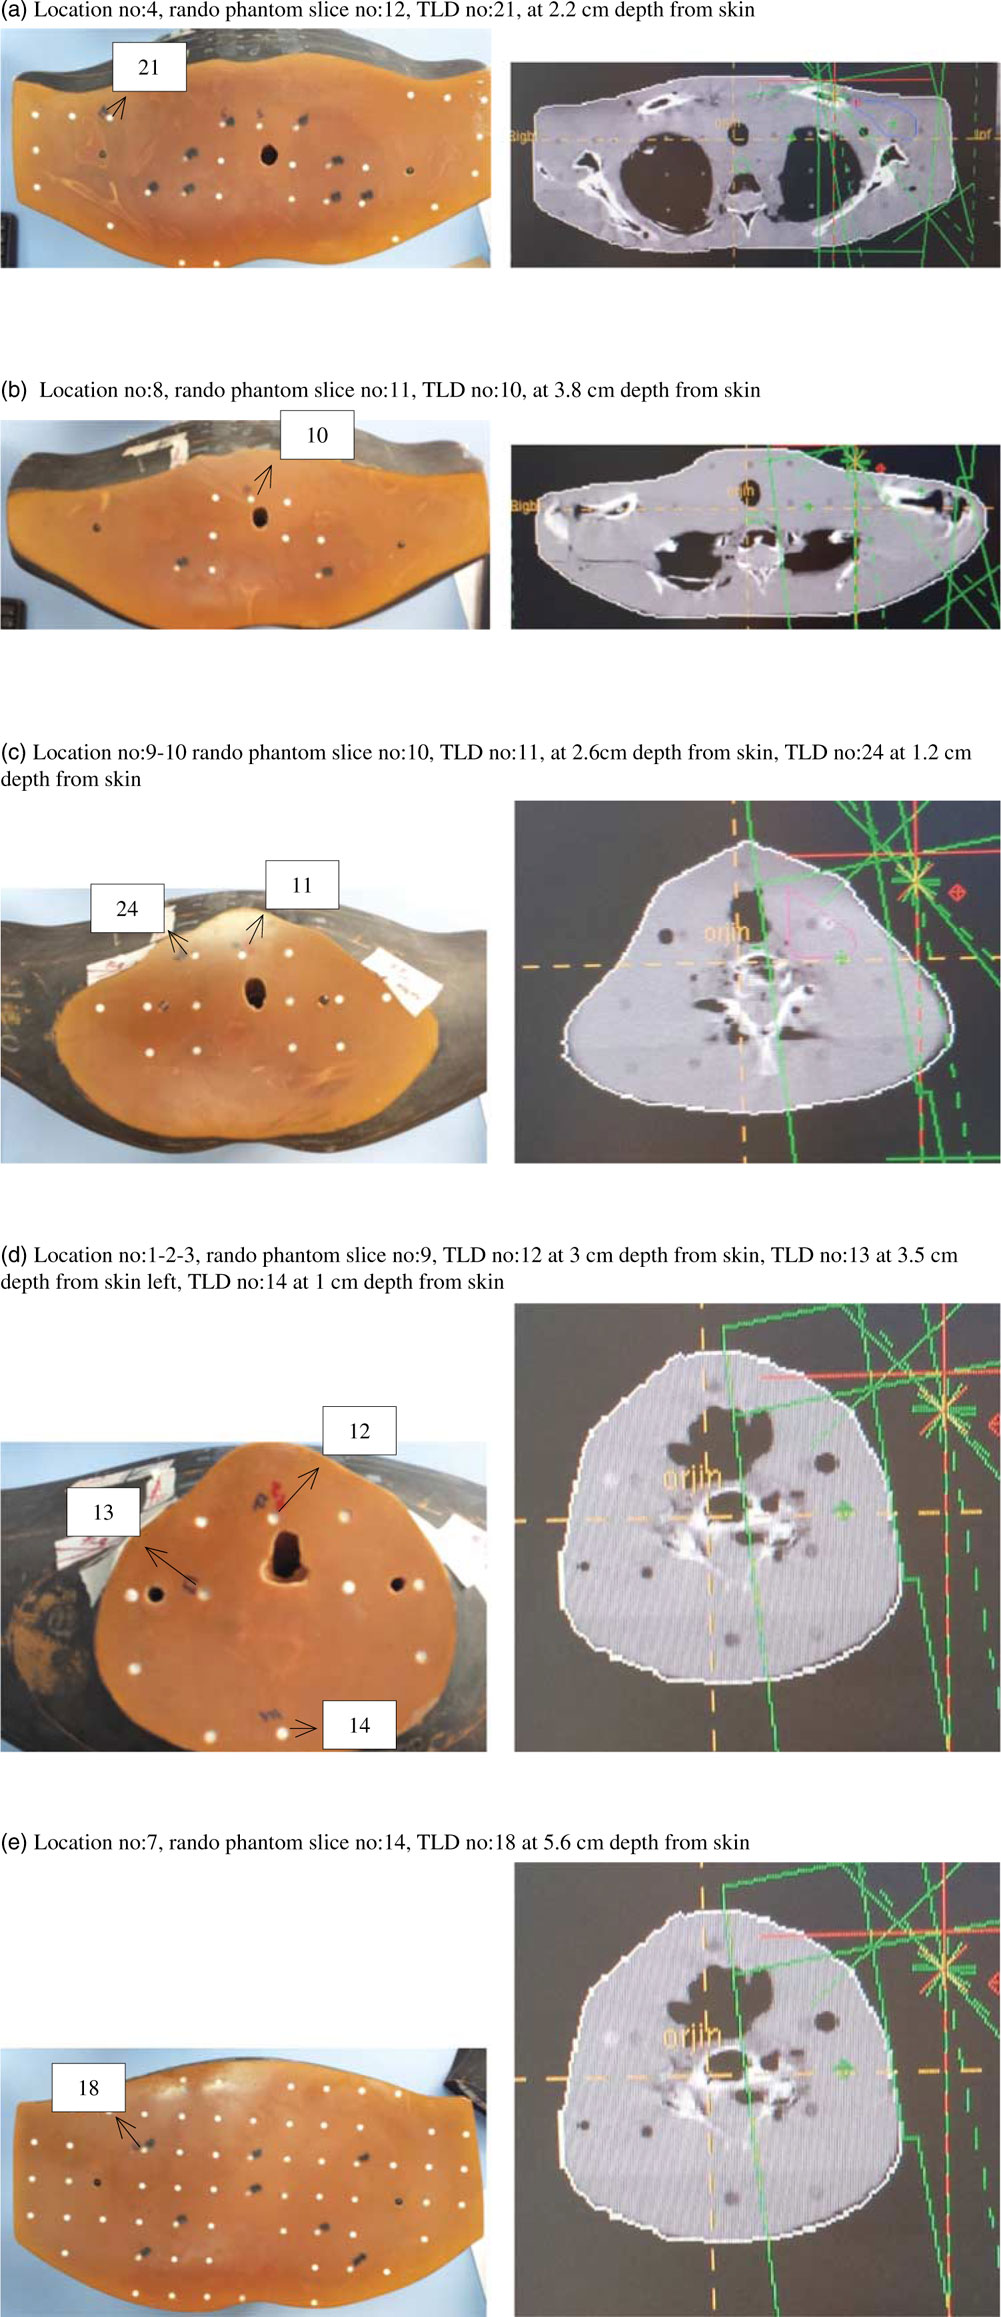
Figure 5 Location number, Rando phantom slice number, Thermoluminescent Dosimeter (TLD) number, TLD location for chest wall–supraclavicular region treatment fields.
Table 2 Demonstrating comparative analysis of point doses and Thermoluminescent Dosimeter (TLD) measured doses acquired from treatment planning systems with pencil beam (PB) and collapsed cone convolution (CCC) algorithms for chest wall–supraclavicular region treatment plannings

For chest wall–supraclavicular treatment plannings, the most prominent difference between PB and CCC algorithms were found at 7 and 12 mm depth from skin. Point dose measurement values were higher with the PB algorithm compared with CCC algorithm. Figure 6 shows comparative analysis of point doses with PB and CCC algorithms for chest wall–supraclavicular region treatment plannings.
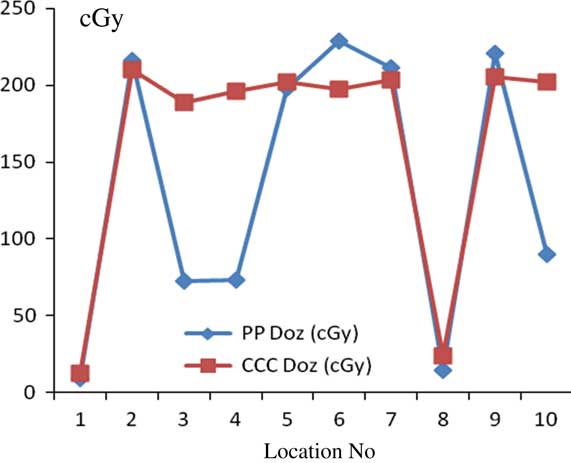
Figure 6 Comparative analysis of point doses with pencil beam (PB) and collapsed cone convolution (CCC) algorithms for chest wall–supraclavicular region treatment plannings.
Lung treatment planning
Lung treatment was planned with two oblique fields shown in Figure 7 and total dose of 60 Gy was delivered. Comparative analysis of point doses with PB and CCC algorithms were shown in Table 3. Location number, Rando phantom slice number and TLD number for lung treatment fields are shown in Figures 8a–8d.

Figure 7 Lung treatment fields.
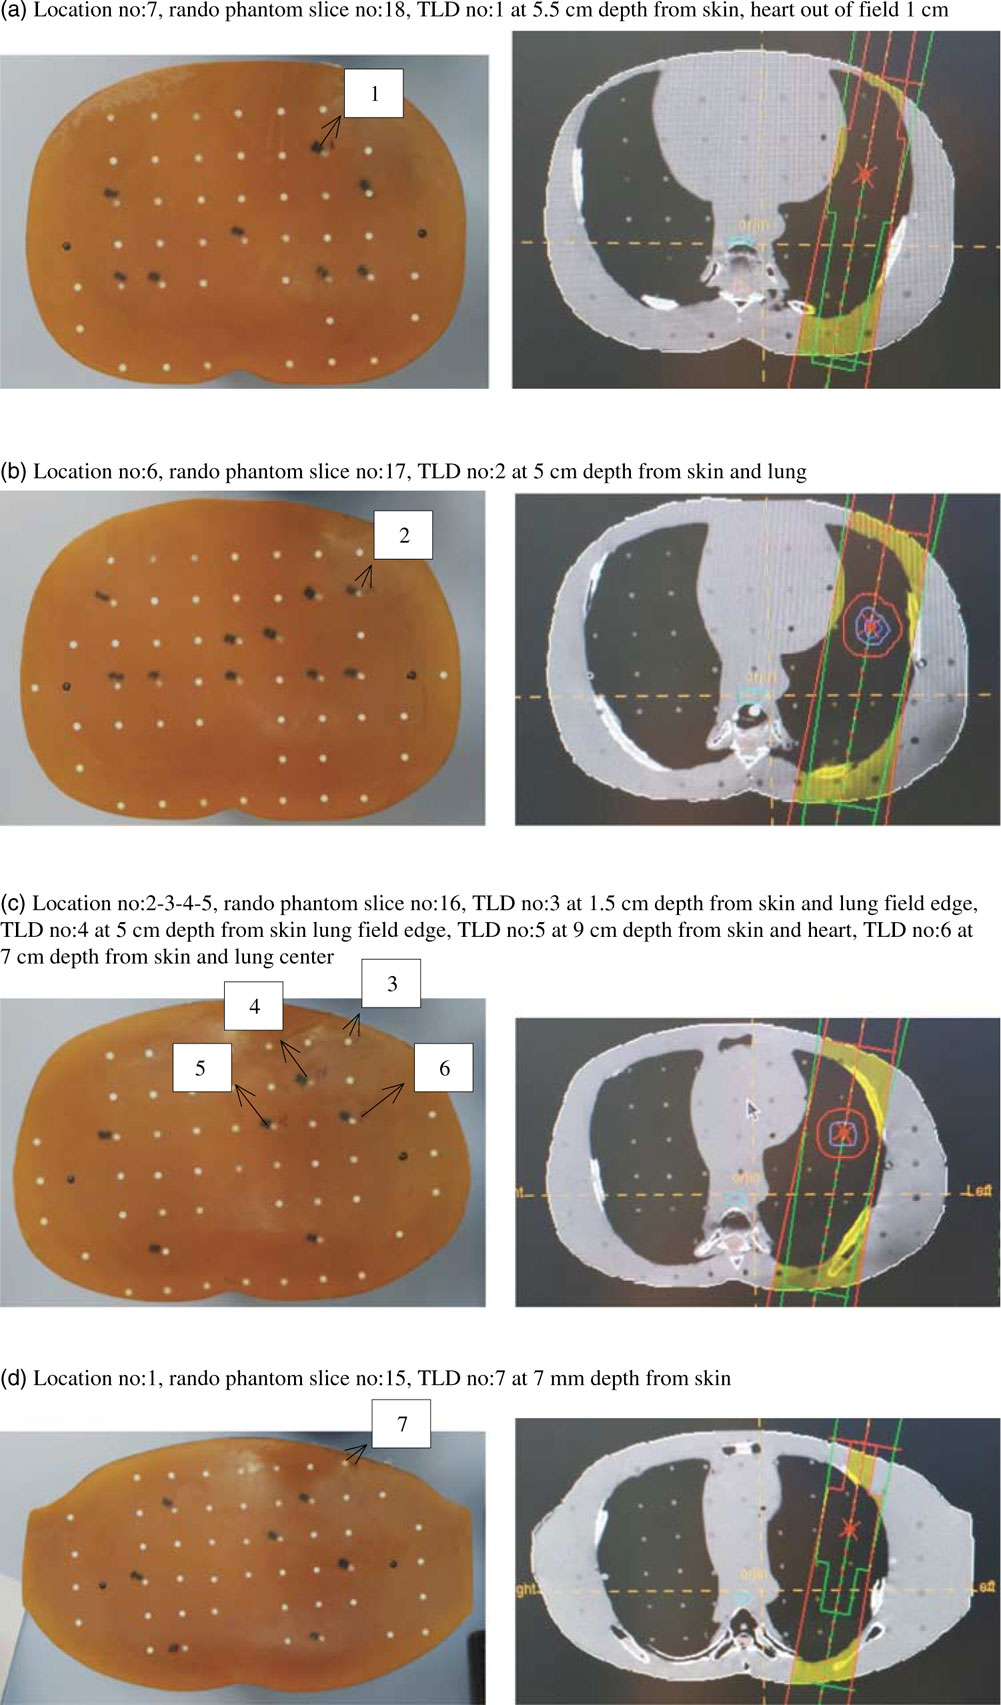
Figure 8 Location number, Rando phantom slice number, Thermoluminescent Dosimeter (TLD) number, TLD location for lung treatment fields.
Table 3 Demonstrating comparative analysis of point doses and Thermoluminescent Dosimeter (TLD) measured doses acquired from treatment planning systems with pencil beam (PB) and collapsed cone convolution (CCC) algorithms for lung treatment plannings

For lung treatment plannings, the most prominent difference between PB and CCC algorithms were found at 7 mm depth from skin. Point dose measurement values with the PB algorithm were consistent with the CCC algorithm. Figure 9 shows comparative analysis of point doses with PB and CCC algorithms for lung treatment plannings.
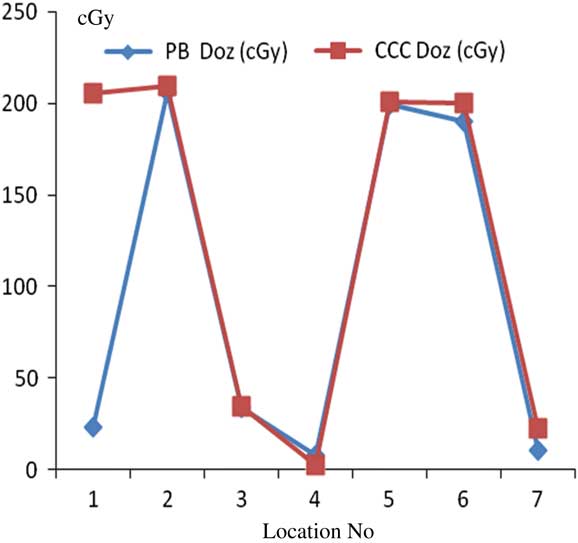
Figure 9 Comparative analysis of point doses with pencil beam (PB) and collapsed cone convolution (CCC) algorithms for lung treatment plannings.
Prostate treatment planning
Planned dose of 72 Gy of prostate treatment plan includes six oblique and one AP fields resulting in total of seven fields shown in Figure 10. Comparative analysis of point doses with PB and CCC algorithms were shown in Table 4. Location number, Rando phantom slice number and TLD number for prostate treatment fields are shown in Figures 11a–11c.
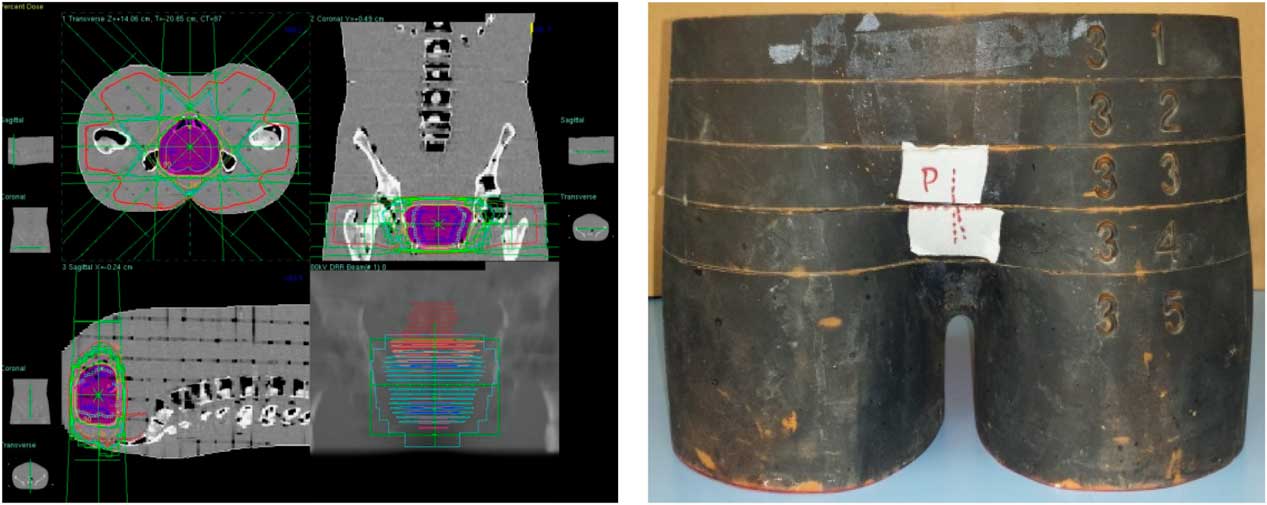
Figure 10 Prostate treatment fields.
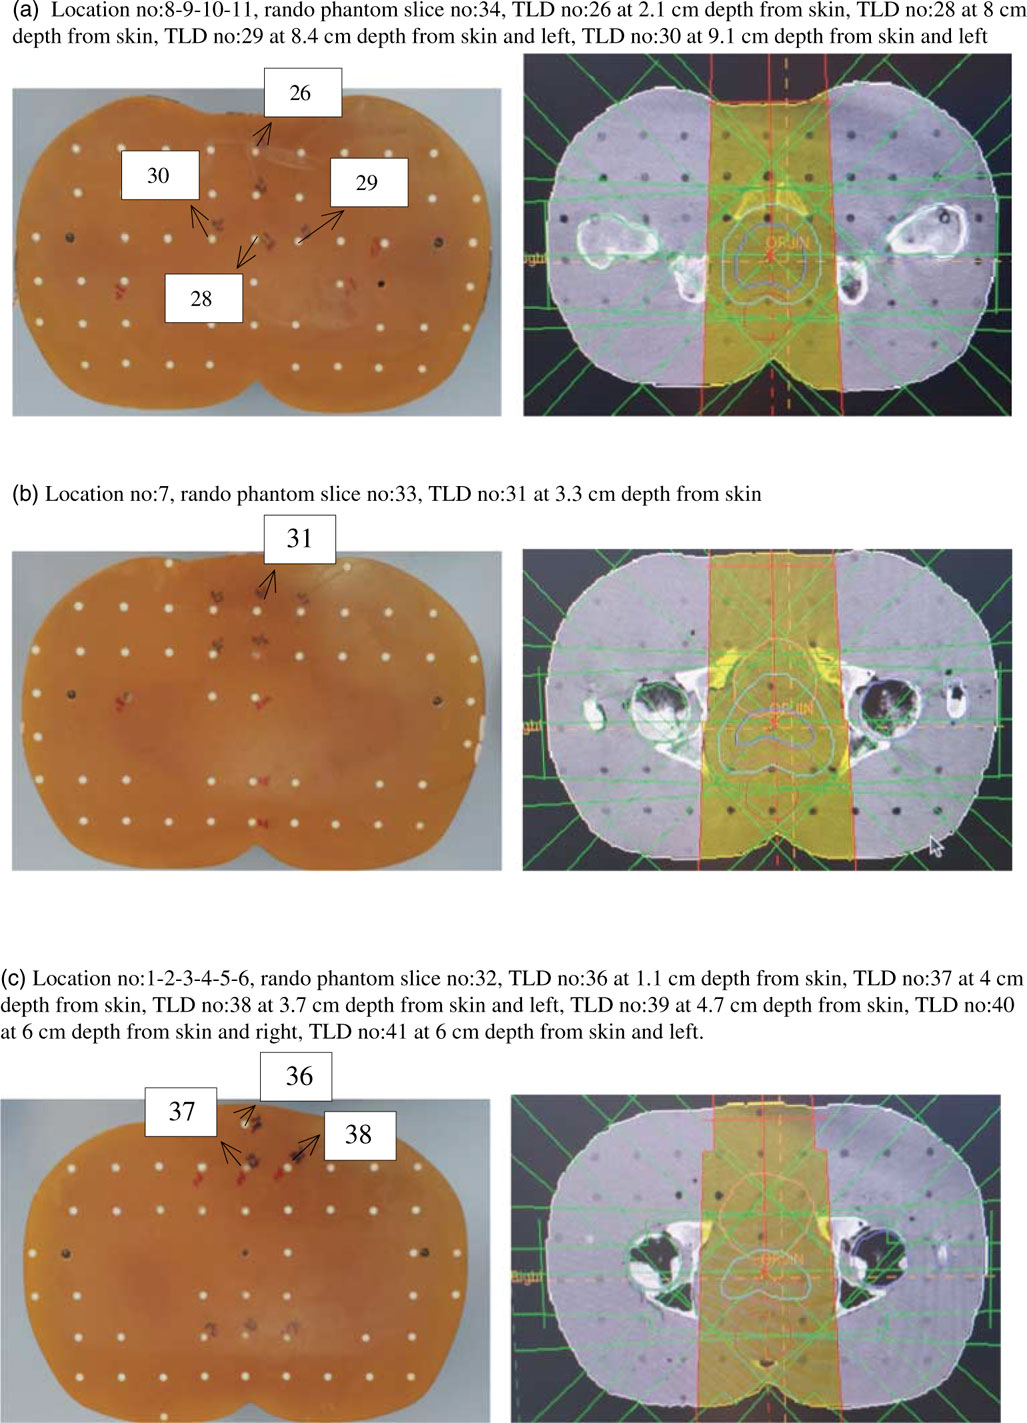
Figure 11 Location number, Rando phantom slice number, Thermoluminescent Dosimeter (TLD) number, TLD location for prostate treatment plannings.
Table 4 Demonstrating comparative analysis of point doses and Thermoluminescent Dosimeter (TLD) measured doses acquired from treatment planning systems with pencil beam (PB) and collapsed cone convolution (CCC) algorithms for prostate treatment plannings
For prostate treatment plannings, the most prominent difference between PB and CCC algorithms were found at 6 cm depth from skin posteriorly. Point dose measurement values with PB algorithm were consistent with the CCC algorithm. Figure 12 shows comparative analysis of point doses with PB and CCC algorithms for prostate treatment plannings.
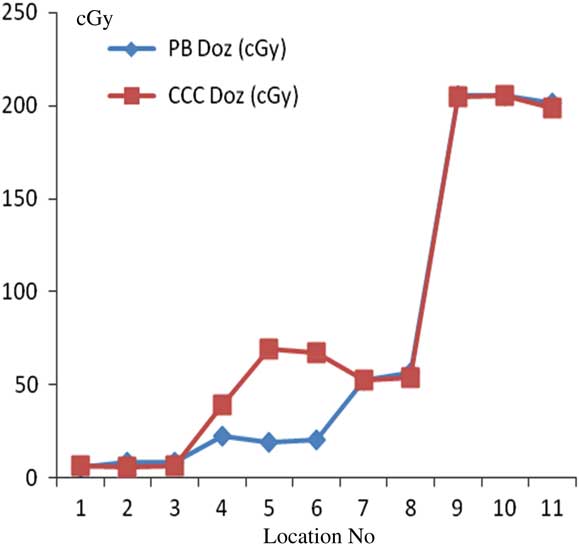
Figure 12 Comparative analysis of point doses with pencil beam (PB) and collapsed cone convolution (CCC) algorithms for prostate treatment plannings.
Conclusion
Accurate determination of both lateral and longitudinal electronic equilibrium is vital for precise calculation of total absorbed dose by TPSs used in radiation therapy. Especially longitudinal electronic equilibrium has importance in breast and head and neck treatment plannings. In these treatment sites, there are lots of heterogeneities close to skin and TPS algorithms may not effectively calculate longitudinal electronic equilibrium, which may ultimately result in calculated dose differences in skin.Reference Cilla, Digesu and Maccihia 6 Our dosimetric comparison study was performed using both PB and CCC algorithm TPSs. PB algorithm seems to calculate the absorbed dose faster partly because of not effectively taking into account the lateral electronic equilibrium and scattered electrons, and due to its partial source modelling. Although longitudinal electronic equilibrium is fully determined, dose calculation accuracy is limited especially in heterogen mediums. In contrast, CCC algorithm can calculate both lateral and longitudinal electronic equilibrium while taking into account the scattered electrons comprehensively. Detailed source modelling and both primary and secondary interaction heterogeneity correction allows highly accurate absorbed dose calculation in heterogen mediums.
Our study reveals that calculations of both PB and CCC algorithms were comparable with measured TLD doses within homogeneous mediums; however, the difference between TLD doses and calculations of both the algorithms increased within interfaces. For head and neck treatment fields, PB algorithm absorbed doses were higher than CCC algorithm absorbed doses at 1 cm depth from skin. For the head and neck region, where there are different inhomogeneities, opposed parallel irradiation resulted in comparable results for both algorithms due to compensation of heterogeneity effects. For chest wall–supraclavicular region treatment fields, dose difference was 36% outside the supra field, and CCC algorithm revealed higher results at field edges at 2·2 and 2·6 cm depths. This was due to different MLC thickness. For lung treatment plannings, the most significant difference between PB and CCC algorithms was found at 7 mm depth from skin (112% difference). Point dose measurement values with the PB algorithm were consistent with the CCC algorithm. CCC algorithm revealed higher results at 5·5 cm depth from the skin at heart–field edge interface, and there is no other significant difference within homogeneous medium. For prostate treatment plannings, difference was 8% at 1·1 cm depth from skin, and there were differences at 4·7 and 6 cm depths from the skin which was caused by MLC thickness.
An optimal dose calculation algorithm should typically be capable of accurate dose calculation at the prescription point, tumour volume and at organs at risk.Reference Lu, Goma and Wang 7 In conclusion, radiation therapy is focussed on real patient bodies including many heterogeneities, thus, precise calculation of absorbed dose within the patient is crucial which requires choosing the most accurate TPS algorithm.
Acknowledgement
None.


