


Diet is a significant contributor to the development of non-communicable diseases together with decreased physical activity and sedentary behaviour( Reference Flores and Lin 1 , Reference Gubbels, van Assema and Kremers 2 ). Dietary habits are often formed during early life stages and may be conditioned into later life( Reference Mikkilä, Räsänen and Raitakari 3 ), an example being childhood obesity, which is increasing at an alarming pace( 4 ). Obese children are more prone to develop non-communicable diseases including diabetes and CVD at a younger age, and early childhood obesity associates with adulthood obesity( Reference Singh, Mulder and Twisk 5 ). Thus, identification of those children with poor diet quality would be crucial to be able to affect the development of dietary habits at early life stages and consequently influence their health over the long term. As an example, early-onset dietary counselling with the aim to reduce SFA intake and increase fibre intake has successfully improved cardiovascular health during early adulthood( Reference Pahkala, Hietalampi and Laitinen 6 ).
Scheduled regular health clinic visits for children grant a convenient setting for monitoring child growth and development and also provide an opportunity for dietary monitoring. For intensifying the dietary screening, a simple but reliable tool for evaluation of diet quality is needed. The current validated methods for dietary evaluation are typically laborious and require calculation of nutrient intakes from food diaries or FFQ. Indeed, although nurses in welfare clinics commonly inquire about their client’s diet, this is most commonly done with informal discussion. Only about a third of nurses use food diaries, FFQ or diet recall( Reference Ilmonen, Isolauri and Laitinen 7 ). A downside of the typically used informal discussions is that considerable skills are required to gain the desired information about diet. In a previous study, about half of nurses felt incapable to evaluate diet composition in relation to the recommended diet( Reference Ilmonen, Isolauri and Laitinen 7 ). Thus, a simple, stand-alone, low-burden tool would ease dietary counselling in health-care settings.
The objective of the present study was to develop and evaluate a stand-alone, independent index, called the Children’s Index of Diet Quality (CIDQ). This is used for the assessment of diet quality in small children aged from 2 to 6 years. We refer to diet quality as food choices that comply with the nutrient intake recommendations( Reference Becker, Alexander and Andersen 8 ). Universal dietary patterns that are health-promoting include in particular high intakes of fruit, vegetables and fish. Also, high intakes of dietary fibre and unsaturated fats and low intakes of saturated fats and refined sugars are recommended( Reference Becker, Alexander and Andersen 8 ). Adequate vitamins and minerals, essential for growth and metabolism, are provided in the recommended diet( Reference Das, Salam and Kumar 9 ). On the contrary, diets high in energy-dense foods and sweetened beverages are not in line with the recommendations and increase the risk for dietary-based diseases, such as obesity in children( Reference Gubbels, van Assema and Kremers 2 , Reference Johnson, Mander and Jones 10 ). The developed index is self-standing, user-friendly and provides a means for identifying those children and families who are at the highest need for diet and lifestyle counselling with an aim to improve their diet as a whole and subsequently to decrease their risk for non-communicable diseases later in life. The index is applicable in the clinical setting and also in the execution of epidemiological and intervention studies for the discovery of exposure–disease relationships, as diet may be an independent predictor or a confounding factor. The assessment of diet quality overcomes the limitations of correlating intakes of single nutrients to health outcomes and takes into consideration the intakes of whole foods and beverages( Reference Marshall, Watson and Burrows 11 ).
Experimental methods
Study design and participants
The present study recruited 400 participants, aged 2–6 years, from the city of Turku and the neighbouring areas in south-west Finland. A random sample of this age group in the area was drawn from the Finnish Population Information System and invitations to participate were sent home. Children with chronic diseases, such as coeliac disease, were excluded.
Before the study appointment, the parents or caregivers kept food records of the children’s diets. Children with their parent(s) attended the research facilities at Turku University Hospital (Turku, Finland) between March 2009 and March 2010. During the study visit, the food records were revised by a nutritionist, one of the parents completed a food intake questionnaire and background information was collected. A fasting blood sample (fasted for 11 h) was drawn and the children’s weight (in kilograms) and height (in centimetres) were measured. BMI and overweight status were determined according to Saari et al.( Reference Saari, Sankilampi and Hannila 12 ). In these formulations, the defined limits for obesity and overweight are the same as for adults as the formulations have been corrected for age.
The study was conducted according to the guidelines laid down in the Declaration of Helsinki and all procedures involving human subjects were approved by the Ethics Committee of the Hospital District of South-West Finland. Written informed consent was obtained from all participants.
Dietary intake
Children’s dietary intake was assessed from seven-consecutive-day food records and food intake questionnaires. Written and oral instructions were given to participant’s parent(s) on how to record all foods and drinks consumed at home and at the day-care centre, with household measures, in the food records. The food records were revised for completeness and accuracy during the study visit. Daily intakes of foods and nutrients were calculated using the Micro-Nutrica computer program version 2·5 (Research Centre of the Social Insurance Institution, Turku, Finland), which is continuously updated with data on commercial foods.
The original food intake questionnaire was constructed to include twenty-five multiple-item questions on eating and food intake. The questions inquired the frequency of food consumption, portion size and description of the food type eaten, such as the amount and type of milk products consumed, over the previous week. The questions were based on the criteria set by the Finnish nutrition recommendations, which are based on the Nordic nutrition recommendations( Reference Becker, Alexander and Andersen 8 ). The criteria of the health-promoting diet, according to the recommendations (Table 1), focused on the intakes of foods that are representatives of a healthy diet or related to an increased risk of diseases. Some of the questions in the food intake questionnaire provided information to several criteria; for example, questions regarding the use of milk products contributed to evaluation of both fat and Ca intakes.
Table 1 Criteria for health-promoting intake of foods and nutrients adapted from nutrition recommendations( Reference Becker, Alexander and Andersen 8 ) and the questions of the food consumption questionnaire. Adherence to criteria was assessed using the 7 d food records

E%, percentage of energy.
* In the original food consumption questionnaire, some questions contribute to several criteria.
Before its use in the study, the food intake questionnaire was pilot-tested in twelve children. Consequently, some questions were clarified or combined and some new questions were added to the final questionnaire. The final questionnaire was found to be feasible to fill in by the families.
Blood sample analyses
A fasting blood sample was drawn from the antecubital vein and Hb, blood lipid and folate concentrations were analysed in the laboratory of Turku University Hospital as described previously( Reference Hoppu, Isolauri and Koskinen 13 ). Plasma total cholesterol, HDL cholesterol and TAG were measured with an automated enzymatic method (Modular P 800; Roche Diagnostics GmbH, Mannheim, Germany). The Friedewald formula was used for calculating the estimated concentration of LDL cholesterol. Folate was analysed by a competitive protein-binding assay (AutoDelfia R; PerkinElmer, Turku, Finland) and Hb with a spectrophotometric method. For vitamin C measurement (United Medix Laboratories Ltd, Helsinki, Finland), the plasma sample was collected in a tube with 5 % (w/v) metaphosphoric acid and analysed with HPLC (Supelco, Bellefonte, PA, USA)( Reference Vähämiko, Isolauri and Poussa 14 ).
Statistics for construction of the Children’s Index of Diet Quality (CIDQ)
The original questionnaire including twenty-five multiple-item questions on eating and food intake and the 7 d food records were used as tools and the nutrition recommendations (Table 1) were used as gold standard to develop the CIDQ. Daily intake of fibre (g), total intake of vegetables, fruits and berries (g), intake of SFA (percentage of energy; E%), intake of MUFA (E%), intake of PUFA (E%), intake of saccharose (E%) and intake of Ca (mg) were calculated for each child from the 7 d food records in order to measure adherence to local nutrition recommendations. Then, each intake variable was dichotomized (according to whether the nutrition recommendations were fulfilled or not). Of these seven criteria, MUFA was excluded and the remaining six were considered to indicate a healthy diet. They were assessed to be equally important and were equally weighted in the diet quality, which was determined to be low, moderate or good if zero to two, three or four, or five or six criteria were fulfilled, respectively.
The CIDQ questionnaire was developed in the following phases:
-
1. Correlation analyses and χ 2 tests were used as screening analyses to study the associations among the variables from the original questionnaire v. adherence to the healthy food criteria and the overall diet quality. The questionnaire variables were categorized in many ways in order to find the best cut-off points for final scorings. Significant associations were taken as an indication of the questionnaire’s ability to measure whether the healthy food criteria were fulfilled or not.
-
2. With the help of stepwise logistic regression analysis, a group of best questionnaire variables was identified for each healthy food criterion. The chosen variables were scored, each question giving 0, 0·5, 1, 2 or 3 points. In total scores, the possible range was 0–21 with the highest values reflecting the best (i.e. healthiest) diet quality.
-
3. Receiver-operating characteristic (ROC) curves and area under the curve estimates were used to compare different scoring methods and to choose the best cut-off points of CIDQ scores for at least moderate and good diet quality. Sensitivity and specificity were assessed to be equally important.
The Kruskal–Wallis test was used to compare the CIDQ categories with respect to energy, dietary fibre, vitamin and mineral intakes, and biochemical markers. The non-parametric approach was chosen due to skewed distributions. The Pearson correlation was used to study the association between BMI and CIDQ score, and the χ2 test was used to study the associations between categorical variables. Analysis was performed using the statistical software package IBM SPSS Statistics for Windows version 21·0.
Results
Participant characteristics
Of the 400 participants attending the study visit, 399 returned the 7 d record and 374 filled in the food questionnaire; thus the data were collected from 374 children of whom 52 % were girls. All completed documents were used for analysis. The children were aged 2–6 years (Table 2). BMI ranged from 14·6 to over 35·0 kg/m2 in the study population. Two per cent of the children were underweight (BMI<17·0 kg/m2), 77 % were normal weight (BMI=17·0−24·9 kg/m2), 16 % were overweight (BMI=25·0–29·9 kg/m2) and 5 % were obese (≥30·0 kg/m2). Of the mothers, 49 % had a university level education, 42 % had occupational education from a vocational school or institution and 2 % of the mothers had no occupational education. One per cent had some other education and no data were obtained from 6 % of the mothers.
Table 2 Characteristics of the participating children, according to age group and overall, South-West Finland, March 2009–March 2010

Results are given as mean and standard deviation for height, weight and BMI; or number and percentage for sex.
* Includes two children aged 1·9 years.
† Includes five children aged 7·0–7·2 years.
CIDQ scores and diet quality categories
Based on the 7 d food records, the adherence to the recommended diet criteria varied between 17·4 % and 91·2 % (Table 1) and according to the number of fulfilled criteria, the overall diet quality was low (zero to two fulfilled criteria) in 22·2 %, moderate (three or four fulfilled criteria) in 58·0 % and good (five or six fulfilled criteria) in 19·8 % of the children. Fifteen questions from the original questionnaire were identified to be the best questions that described the adherence to the criteria. These fifteen questions were then used to compile the CIDQ (Table 3). The possible range for total CIDQ score was 0–21 points. Using ROC curve analyses and the above-mentioned number of fulfilled criteria as gold standard, the cut-off points, 10 and 14 points, were the best ones to identify the children with at least moderate and good diet quality, respectively. Using the selected cut-off points, the sensitivity was 0·77 (95 % CI 0·72, 0·82) and the specificity was 0·69 (95 % CI 0·59, 0·80) to find the children having at least moderate diet quality and the sensitivity was 0·59 (95 % CI 0·48, 0·71) and the specificity was 0·82 (95 % CI 0·77, 0·86) to find the children having good diet quality (Fig. 1). For the total CIDQ scores, the area under the (ROC) curve was 0·79 (95 % CI 0·74, 0·85) and 0·75 (95 % CI 0·69, 0·81) for at least moderate and good diet quality, respectively. The diet quality was defined to be poor (CIDQ score <10 points) in 29·8 %, moderate (10·0–13·9 points) in 43·7 % and good (≥14 points) in 26·5 % of the children.
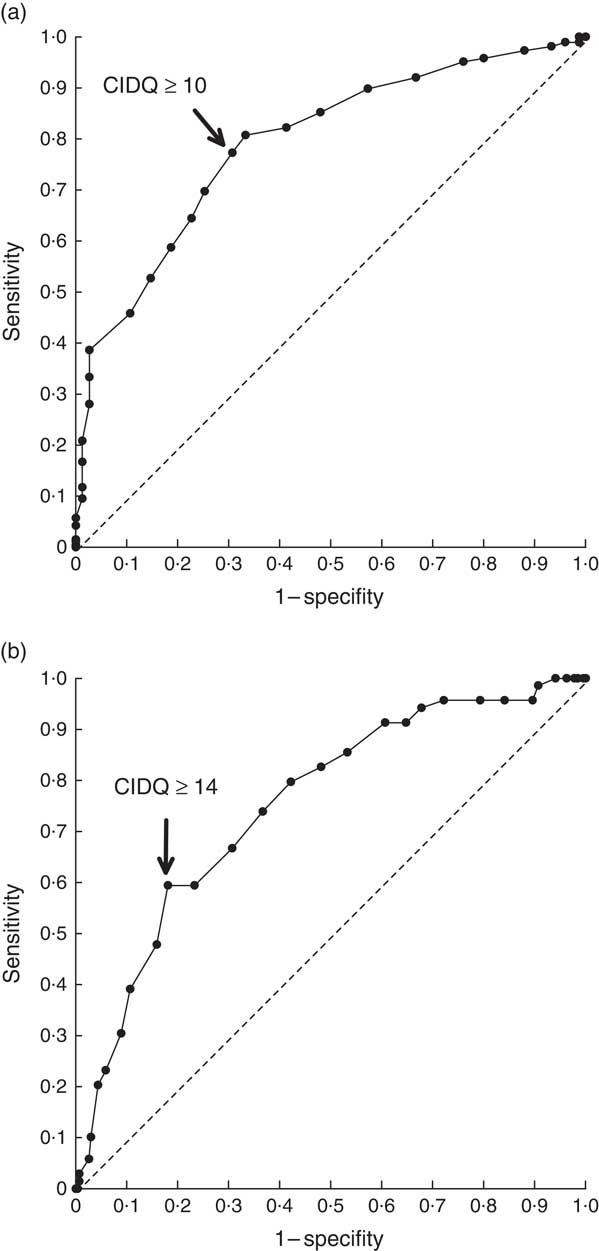
Fig. 1 Receiver-operating characteristic curves showing the ability of the Children’s Index of Diet Quality (CIDQ) to assess (a) at least moderate and (b) good diet quality among 2–6-year-old children (n 374), South-West Finland, March 2009–March 2010. The chosen cut-offs are ≥10 points for at least moderate and ≥14 points for good diet quality, which maximize the sum of sensitivity and specificity (– – –, line of no discrimination)
Table 3 Questions on food consumption in the final Children’s Index of Diet Quality (CIDQ) and the scoring of questions

E%, percentage of energy.
* In the final index questionnaire, some questions contribute to several criteria.
Nutrient intakes, biochemical markers and BMI in CIDQ diet quality categories
The three-class index was further tested against the nutrient intakes calculated from 7 d food records as well as biochemical markers assessed from blood samples. The index category reflected the quality of the diet, as significant associations in the reasonable direction were shown among the three classes of CIDQ and nutrient intakes calculated from the food records (Table 4). Higher CIDQ scores were related to higher proportions of energy from protein and carbohydrates and lower proportions of energy from fat, SFA and saccharose. Higher intake of fibre and decreased intake of cholesterol were also associated with greater index scores and thus a good-quality diet. Of the several calculated intakes of different vitamins and minerals, higher intakes of Fe, vitamin C, vitamin E and folate were related with higher CIDQ points. Intakes of Ca and vitamins C and E increased from the lowest index group to the moderate and further to the highest group, which reflected healthier diet quality. Also, the intake of SFA (E%) decreased when moving from the lowest group to the moderate and highest groups. Intake of MUFA did not change according to the three diet quality categories.
Table 4 Daily energy, energy-yielding nutrients, and dietary fibre, vitamin and mineral intakes, as calculated from 7 d food records, according to different categories of the Children’s Index of Diet Quality (CIDQ) among 2–6-year-old children, South-West Finland, March 2009–March 2010

IQR, interquartile range; E%, percentage of energy.
* Kruskal–Wallis test.
Analysis of the biochemical markers demonstrated that higher CIDQ scores were associated with clinical biomarkers that are connected with health, such as cholesterol and vitamin C concentrations (Table 5). The children in the highest CIDQ group, which described good diet quality, had the lowest serum total cholesterol and LDL cholesterol concentrations and these concentrations increased significantly when moving down to moderate and low diet quality index scores. However, the same was detected also for HDL cholesterol concentrations. Vitamin C concentration increased significantly from the lowest to the highest diet quality category.
Table 5 Biochemical markers in 2–6-year-old children according to different categories of the Children’s Index of Diet Quality (CIDQ), South-West Finland, March 2009–March 2010

IQR, interquartile range.
* Kruskal–Wallis test.
Children’s BMI was not associated with the CIDQ score (r=0·03, P=0·65). The proportion of children with overweight (BMI≥25·0 kg/m2) was 22·8 %, 20·3 % and 20·0 % in the CIDQ score categories of poor (<10 points), moderate (10·0–13·9 points) and good (≥14 points) diet quality, respectively (P=0·86). No association was observed between the number of fulfilled criteria of healthy diet and overweight. The proportions of children with overweight was 24·1 %, 20·4 % and 18·9 % when zero to two, three or four, or five or six criteria were fulfilled, respectively (P=0·70).
Discussion
In the present paper we describe the development and evaluation of a novel, stand-alone index of children’s diet quality, the CIDQ, which is a tool for the assessment of diet quality by evaluating the adherence to a health-promoting diet, as determined in the nutrition recommendations in the Nordic countries and Finland. This CIDQ is a stand-alone tool applicable to the evaluation of diet in healthy children aged between 2 and 6 years and may be used both in clinical work and for research purposes.
Dietary surveys have traditionally been conducted with FFQ and food recalls, which require considerable efforts from the persons filling in the questionnaire as well calculating the results. In some contexts, such as in epidemiological studies or clinical settings, it may be more important to know the quality of the overall diet rather than the intake of single nutrients( Reference Fransen and Ocke 15 ). Studies on diet and chronic diseases have focused on the relationship between consumption of single nutrients and disease risk, and have identified several individual dietary components, such as total fat( Reference Aeberli, Molinari and Spinas 16 ), SFA( Reference Zimmermann and Aeberli 17 ), PUFA( Reference Damsgaard, Schack-Nielsen and Michaelsen 18 , Reference Pedersen, Molgaard and Hellgren 19 ), refined carbohydrates and fibre( Reference Saavedra, Deming and Dattilo 20 – Reference Kranz, Brauchla and Slavin 22 ), and fruits, vegetables and berries( Reference Zask, Adams and Brooks 23 ), to either protect against or lead to chronic diseases also in childhood. However, even though single nutrients have beneficial properties, it is the diet as a whole that has the most impact on health. Indeed, diets are composed of different kinds of foods that are consumed in combination rather than separately( Reference Gubbels, Kremers and Stafleu 24 , Reference Feskanich, Rockett and Colditz 25 ).
Several indices for this purpose exist, with the most widely used perhaps being the Healthy Eating Index (HEI) based on North American nutrient recommendations( Reference Guenther, Casavale and Reedy 26 ). Specific indices for evaluating adherence to the Mediterranean diet have also been developed( Reference Mila-Villarroel, Bach-Faig and Puig 27 ), as have indices for different subpopulations such as the Baltic Sea region diet, pregnant women and patients with specific diseases( Reference Fransen and Ocke 15 , Reference Kanerva, Kaartinen and Schwab 28 ). The HEI has been modified and used to evaluate the diet of small children and adolescents( Reference Feskanich, Rockett and Colditz 25 , Reference Angelopoulos, Kourlaba and Kondaki 29 , Reference Rauber, Hoffman and Vitolo 30 ), and also other indices exist for assessing the quality of diet in small children specifically( Reference Marshall, Burrows and Collins 31 ). For example, the FCHEI (Finnish Children Healthy Eating Index) is developed and evaluated for children aged 1 to 6 years( Reference Kyttalä, Erkkola and Lehtinen-Jacks 32 ), and the revised Children’s Diet Quality Index (RC-DQI), based on US diet recommendations, takes into account also sedentary behaviour in addition to main dietary components and total daily energy intake( Reference Kranz, Hartman and Siega-Riz 33 ). Other indices have also been developed to assess the compliance with the local children’s dietary guidelines in Belgium( Reference Huybrechts, Vereecken and De Bacquer 34 ) and Australia( Reference Golley, Hendrie and McNaughton 35 ). All of these other indices differ from the index presented herein because the CIDQ is a stand-alone, low-burden index without the need for another method to analyse food intake and calculate index scores. Other indices require calculation of daily intakes of energy and nutrients from FFQ, food records or recall surveys only after which categorization to different dietary quality classes may be executed. Thus, these are not stand-alone indices but a second step is needed to categorize the diet quality, obviously increasing the time and effort needed and hindering the clinical use. A recent review called to the need for brief, easy-to-use and valid index tools for evaluating the quality of children’s diet, as only a limited number of reliable tools exist to date( Reference Bell, Golley and Magarey 36 ). The CIDQ presented here does not require information from other methods for analysing dietary intake nor calculation of nutrient intakes to be completed, and thus expands the concept of the previously published adult’s index of diet quality (IDQ)( Reference Leppalä, Lagstrom and Kaljonen 37 ) also to children. Two similar low-burden indices were identified from the literature: the Mediterranean Diet Quality Index for children and adolescents (KIDMED)( Reference Serra-Majem, Ribas and Ngo 38 ) and the Australian Child and Adolescent Recommended Food Score (ACARFS)( Reference Marshall, Watson and Burrows 11 ), both of which can be used together with FFQ but also independently as a brief tool for the assessment of diet quality based on the local recommendations.
Fifteen multiple-item questions comprised the CIDQ and were selected based on statistical ROC and correlation analyses. The statistical ROC analysis gave values ranging from 0·59 to 0·82 that are comparative with previously published studies. For example, Leppälä et al.( Reference Leppalä, Lagstrom and Kaljonen 37 ) reported sensitivity of 0·67 and specificity of 0·71 in ROC analysis for the IDQ depicting diet quality in adults. Further Westergren et al.( Reference Westergren, Norberg and Hagell 39 ) reported cut-off values of 0·67 and 0·75 (sensitivity) and 0·85 and 0·58 (specificity) for the Minimal Eating Observation and Nutrition Form, which enables identification of well-nourished, at risk of undernourishment and undernourished patients in hospitals. According to a previously conducted analysis, sensitivity and specificity values of this magnitude are considered to be a good sign of validity( Reference Metz 40 ).
Questions that were selected to the CIDQ were the best ones in their own category to describe the adherence to nutrition recommendations. For example, the questions best describing the intakes of different dietary fatty acids in the children’s diet were ones concerning the consumption and type of used milk and cheese products and the spreads and fats used for cooking. Although the intake of fish and seafood is considered to reflect a healthy eating pattern( Reference Steingrimsdottir, Ovesen and Moreiras 41 ) and contributes to fatty acid intake, fish consumption did not differentiate between children in the present study. This may be due to the fact that small children, in general, consume only small amounts of fish and prefer battered fish dishes with low fish content and added fat, typically saturated fat. The difference among groups in the intakes of carbohydrates and whole-grain products and fibre was best described with questions regarding the frequency of use of porridge or gruel as well as the use of fruits, vegetables and berries. A high intake of fibre indicates healthiness of the whole diet, better total diet quality and improvement of several risk markers of cardiovascular and metabolic diseases( Reference Niinikoski and Ruottinen 21 ), whereas high sugar intake (more than 10 E%) compromises the adequate intakes of recommended foods and key nutrients in children’s diet( Reference Erkkola, Kronberg-Kippilä and Kyttälä 42 , Reference Ruottinen, Niinikoski and Lagström 43 ) and promotes the development of obesity( Reference Gubbels, van Assema and Kremers 2 ). In the CIDQ, the use of sugar-containing yoghurts and juices was the only question that showed significant differences between index categories in the use of saccharose: the more sugared yoghurts and juices children ate, the lower was the overall quality of their diet. The intake of candies or cakes and cookies did not differ between the index categories and consumption of these was similar in all children regardless of the healthiness of other foods consumed in their diet.
The CIDQ, presented in the current paper, was effective in dividing the children into three categories based on their dietary quality: those that were consuming poor-, moderate- or good-quality diets. The index reflected the adherence to local nutrient recommendations as assessed with 7 d food records. The criteria of a healthy diet were well fulfilled regarding the intakes of fibre, vegetables, fruit and berries, Ca and saccharose among the children. On the contrary, the recommended intakes of SFA and PUFA were fulfilled only in a small proportion of the study population. This may be due to the fact that many different food items contain fatty acids of both saturated and unsaturated origin. Thus, it was challenging to comprehensively define the quality of dietary fat. For example, milk products have traditionally been consumed in Finland in high amounts, thus contributing to adequate Ca intake but also to SFA intake if high-fat products are used. Nevertheless, intakes of SFA and cholesterol, as assessed from food diaries, decreased from poor to moderate and good index categories. Similarly, the index categories were significantly associated with the intakes of several vitamins and minerals; for example, intakes of folic acid, vitamin D, Fe and iodine increased as the index class changed from low to moderate and further to the good/healthy category, which have been suggested as nutrient biomarkers of a healthy diet( Reference Steingrimsdottir, Ovesen and Moreiras 41 ). Further, fibre and protein intakes were highest in the good dietary quality category. These results demonstrated that the index sufficiently reflects the adherence to the nutrition recommendations, although challenges exist particularly regarding estimating fat intake.
The quality of children’s diet assessed with this index was reflected also in some of the clinical biomarkers: children with better diet quality had lower serum total and LDL cholesterol levels, which are well-established biomarkers with regard to lifestyle-related diseases such as CVD. Nevertheless, also HDL cholesterol levels were lower in the highest index category, which may reflect overall lower cholesterol levels. Serum vitamin C levels, reflecting better intakes of fruits, berries and vegetables( Reference Woodside, Young and McKinley 44 ), were highest in children in the highest index group, but surprisingly no significant differences were measured in serum folate levels between index categories. Folate is an indicator of increased intakes of vegetables, fruits and berries( Reference Esfahani, Wong and Truan 45 ), but in this data set no differences were measured in serum, although the intake of these differentiated among the categories.
Limitations to the CIDQ presented herein are that it does not give exact, quantitative information on nutrient intakes, although that was not the goal. Other methods should be used for these purposes. One other limitation of the index could be the evaluation of dietary fatty acid quality. For example, the questions regarding MUFA intake were not included into the index as it did not differentiate between poor, moderate and good diet quality categories. Also, not all of the biochemical markers reflected the changes in dietary quality, which could be regarded as a limitation of the index as well, and the index should be optimally validated in another study to confirm the results. New Nordic nutrition recommendations have been published since the study was conducted in 2013; the fibre recommendation was raised from 2 g/MJ to 2–3 g/MJ for children and the upper recommended intake of MUFA was increased from 15 to 20 E%. The data were checked with these new criteria, but the changes had no significant impact on the results; thus the CIDQ is applicable also considering diet quality as defined by new nutrient recommendations.
Conclusions
The CIDQ proved to be an effective tool for evaluating the quality of small children’s diet and reflected dietary intakes of foods and nutrients that are associated with healthy diet as a whole. The CIDQ could be an easily applicable and self-standing tool in nutritional studies where the healthiness of the diet in its entirety is of interest instead of single nutrients. If a detailed analysis of fat quality is needed, it may be necessary to use another tool, as the present index did not optimally discriminate the fatty acid composition of different diets. The CIDQ is fast in execution and free from complicated calculations or laborious food records. This makes it particularly effective and an easily applicable tool for clinical practice in the dietary guidance of children; the index provides a tool that discriminates children into three categories based on their diet quality and adherence to the Nordic nutrition recommendations. It could provide a tool for health-care professionals to identify those children who could benefit from dietary counselling in order to improve their diet quality and perhaps consequently decrease their risk of non-communicable diseases later in adolescence and adulthood.
Acknowledgements
Acknowledgements: The study nurses are thanked for organizing the study appointments. Robert M. Badeau, PhD, of Aura Professional English Consulting, Ltd. (www.auraenglish.com) is thanked for the English language content editing of this manuscript. Financial support: Funding was received from Turku University Foundation, Academy of Finland, the Social Insurance Institution of Finland and Turku University Hospital EVO funding (personal to J.J.). The funders had no role in the design, analysis and writing of this article. Conflict of interest: None. Authorship: K.L. formulated the research question. K.L., U.H. and J.J. were responsible for the design of the study, data analyses and interpretation. J.J. contributed to the study execution. T.P. conducted statistical analyses. T.P. and H.R. contributed to data interpretation. H.R. wrote the first draft of the article and all other authors contributed to writing up the article. All authors read and approved the final version of the article. Ethics of human subject participation: The study protocol was approved by the Ethics Committee of the Hospital District of South-West Finland.


