The nutrition transition occurring in the developing world, of which increased consumption of carbonated drinks is a part, results in the rapid adoption of energy-dense diets at low cost replacing energy-efficient diets at high costs(Reference Popkin1–Reference Burns, Sacks and Gold3). Further evidence, although limited to developed countries, suggests that poorer areas provide fewer healthy food options and more energy-dense foods than do more affluent areas(Reference Cummings and McIntyre4). Evidence on consumption rates of soft drinks and processed foods by the Indian population is sparse(Reference Blouin, Chapra and Van Der Hoeven5). Obesity and type 2 diabetes are already becoming major health problems in India(Reference Wild, Roglic and Green6), and the health implications of further unchecked growth in the consumption of sugar-sweetened soft drinks may aggravate the situation further.
Systematic review evidence suggests that greater consumption of sugar-sweetened soft drinks is associated with weight gain in adults and children and increase in the risk of type 2 diabetes in young-to-middle-aged women(Reference Harrington7–Reference Vartanian, Schwartz and Brownell9). No such associations have been found with the consumption of diet drinks(Reference Schulze, Manson and Ludwig10). The age-adjusted relative risk for type 2 diabetes among women consuming one or more sugar-sweetened drinks per day compared with those consuming less than one sugar-sweetened drink per month is 1·98 (95 % CI 1·6, 2·4)(Reference Schulze, Manson and Ludwig10).
Sugar-sweetened soft drink consumption has become a controversial public health issue in France and England resulting in regulations banning their sale in schools(Reference Vartanian, Schwartz and Brownell9). This is in reaction to growing evidence of associations found between sugar-sweetened soft drink intake in children and increased energy consumption, lower milk consumption, higher intake of carbohydrates and lower intake of fruit and dietary fibre(Reference Vartanian, Schwartz and Brownell9).
Accurate and up-to-date statistics on soft drink consumption are not readily available. As soft drink consumption has levelled off in the USA and parts of Europe, less developed countries such as India now represent the largest growth markets for soft drink producers(11–Reference Nelson13). While Coca Cola alone had increased its sales in India by 10·4 % from 1998 to 2003(Reference Kaye14), Euromonitor estimated that the average annual growth rate of all soft drink sales in India was 12·6 % and that for carbonated drinks 4·8 % annually between 1997 and 2007(Reference Regmi15).
As wider marketing of low-energy ‘diet’ versions of carbonated drinks may be a reasonable means of harm reduction in India, given the prevalence of high obesity and diabetes, we sought to determine the availability, price and quantity sold of two of the globally most popular soft drink products – ‘Pepsi’ and ‘Coca Cola’ – in their regular and ‘diet’ forms. We surveyed the food and drink outlets in Delhi, India and London, UK for comparative purposes. Our hypotheses were that diet Pepsi and Coca Cola were equally available and at the same price and sold in the same quantity as regular Pepsi and Coca Cola both in Delhi and London.
Methods
We devised and piloted a questionnaire about the availability, price and quantity sold per day of both regular and diet Pepsi and Coca Cola in Delhi (see Appendix). We included a section of open-ended questions for store vendors, café, pub and/or restaurant staff regarding the stocking and sales of regular and diet Pepsi and Coca Cola. Prices were ascertained by checking the price labels and/or menus. For comparison on availability and price, we conducted the same survey in London to represent a city in the developed world. We made a list of stations of the Delhi Metro and the London Underground systems. From these lists, we randomly selected a 10 % sample of stations of the Delhi Metro and a 3 % sample (reflecting the larger network) from the London Underground system. Within a 100 m radius of the selected Metro/Underground station, all food and drink outlets that were open, including those within the stations, were visited. We excluded non-permanent stalls that were selling only freshly squeezed juice or tea and convenience items that did not include drinks. The questionnaire was administered on the premises by interview of the store vendors or staff in drinking and/or eating establishments. Data collection was undertaken over two 1-week periods in March 2009.
To ascertain an area profile for the selected areas in Delhi, we obtained data from the Census of India 2001(16) on the total population, the proportion of people who were illiterate, the proportion of marginal (temporarily) unemployed and economically active people. For London, data from the Census 2001 provided online by the Office of National Statistics were used(17). We collected data on the total population and the proportions of the following indicators of socio-economic status: living in social housing (KS18), economically active long-term unemployed (KS09A), no qualifications (KS13) and classified as being in professional groups A + B (UV50 – higher and intermediate managerial/administrative/professional persons).
Data were entered on an EXCEL spreadsheet and analysed using the Statistical Package for Social Sciences statistical software package version 10·0 (SPSS Inc., Chicago, IL, USA)(18). Since the range of prices was not normally distributed across establishments where regular and/or diet Pepsi or Coca Cola was available, we used median prices. We used Z-tests to compare differences between low and high socio-economic areas and χ 2 test to assess whether the observed differences in availability, cost and sales of regular and diet Pepsi and Coca Cola in Delhi and in London were compatible with chance alone.
We contacted the sales executive of PepsiCo and Coca Cola in India and in the UK for the manufacturing prices of regular and diet Pepsi and Coca Cola, the prices at which these were sold directly to the retailer and the recommended maximum retail price (MRP). Prices were analysed in Indian rupees (INR; 72 INR to £1·00 sterling as quoted on 20 March 2009)(19).
Results
The pilot
Since the Metro system was not in operation in South Delhi, Green Park, a location close to the base of the research team in South Delhi was chosen for piloting the methods. No alterations after the pilot were made to the study, and therefore we included the data derived from the pilot in the study results.
For Delhi, but not for the UK, we were able to ascertain the price manufacturers charged retailers as well as the MRP for all the products investigated other than the 330 ml can of diet Coca Cola.
Area profiles, food and drink outlets
The ward-level population in Delhi ranged between 18 709 and 100 716 and was much higher than the London range of 7185– 9224. In total, 185 outlets were visited: 124 in seven areas in East, West, South, North and Central Delhi and sixty-one outlets in three areas in East, Central and South London. The area profile statistics showed that Tilak Nagar and Green Park (Delhi) and St Paul’s (London) were the most affluent areas and that Mansorovar Park, Uttam Nagar (Delhi) and Pimlico (London) were the least affluent areas.
Availability
In Delhi, the availability of regular and diet Pepsi was greater than that of regular or diet Coca Cola. The reverse was the case for London. No outlets sold only the diet versions of Pepsi or Coca Cola. Pepsi or Coca Cola was available in a variety of different outlets and there was little difference in the availability of these products between Delhi (92/124, 74 %) and London (49/61, 80 %) outlets (Table 1).
Table 1 Store availability of regular v. diet Pepsi and Coca Cola: Delhi and London
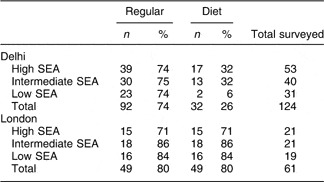
SEA, socio-economic area.
Delhi: high SEA areas – Green Park and Tilak Nagar; intermediate – Netaji Subhash, Chawri Bazaar and Kirti Nagar; low – Mansorovar Park and Uttam Nagar.
London: high SEA area – St. Paul; intermediate – Warren Street; low – Pimlico.
Of the outlets stocking regular Pepsi and Coca Cola in Delhi, only thirty-two of ninety-two (34 %) sold diet Pepsi or Coca Cola and these outlets were mostly in the affluent areas: seventeen of fifty-three (32 %, 95 % CI 21, 46) compared to much more limited availability in the poorer areas, two of thirty-one (6 %, 95 % CI −2, 21; Z = 3·67, P < 0·001). In contrast, all the outlets in London stocking regular Pepsi or Coca Cola also stocked their diet counterparts (Table 1). In London, diet Pepsi and Coca Cola were as much available in the least affluent areas where sixteen of nineteen (84 %, 95 % CI 62, 95) outlets stocked them compared to the most affluent areas, fifteen of twenty-one (71 %, 95 % CI 50, 86; Z = 1·01, P = 0·18).
In Delhi, fifty-three of 124 shop vendors or staff in drinking and/or eating establishments answered our open-ended questions on stocking and sales of regular and diet Pepsi and Coca Cola. Of these, twenty-eight (52 %) said that there was little or no demand for diet Pepsi or Coca Cola, ten (36 %) that their customers preferred regular to diet products and one argued that diet products were only for sick people. Another reason for not stocking diet Pepsi or Coca Cola was lack of availability from the wholesaler. In London, of the twenty-four out of sixty-one (39 %) shop vendors or staff in drinking and/or eating establishments who responded to this section of the questionnaire, three (12·5 %) stated that their customers preferred regular to diet products; however, store vendors noted that sales of flavoured water were fast outstripping carbonated drink sales.
Price
Different-sized containers of regular and diet Pepsi and Coca Cola were available in Delhi and London. For a fair comparison of prices between diet and regular versions, we compared same-sized containers, i.e. 330 ml cans, 500 and 600 ml bottles in Delhi; 330 ml cans and 500 ml bottles in London.
Pepsi
For Delhi, the price that the manufacturers charged retailers, the MRP and the median price derived from our data are shown in Table 2. There were no price differentials between diet and regular Pepsi in all quantities sold other than a 1 INR higher price for 330 ml cans, which was explained by two restaurants that charged more for diet than regular. All store vendors charged the same price for diet and regular Pepsi. There were no other differences between the MRP and the median price derived from our data. Retailers would make 10 % profit selling a can of regular Pepsi compared to an 8 % profit selling diet Pepsi and in all other quantities the profit margin was the same (Table 2). In London, the price for diet 333 ml cans was almost double that of regular Pepsi.
Table 2 Regular and diet Pepsi and Coca Cola: prices that the manufacturers charged retailers, MRP and median price in INR (72 INR = £1) in Delhi and London

MRP, maximum retail price; INR, Indian rupees.
Coca Cola
In Delhi, the price that the manufacturers charged retailers was less for 330 ml cans of regular than for diet Coca Cola. With a manufacturing price of 20 INR for a 330 ml can of regular Coca Cola, retailers were making a profit of 7 INR (28 %), while for the diet version, the profit made was only 2·5 INR (10 %). Similarly, the retail profit made by selling 600 ml bottles of regular Coca Cola was 3·5 INR (16 %) compared with 0·5 INR (0·2 %) from selling the diet version. In London, there was no difference in the price of regular and diet Coca Cola (Table 2).
In general, Coca Cola products were more expensive than their Pepsi counterparts in Delhi, whereas in London the reverse was observed (Table 2).
Sales
To ascertain the average daily sales of regular and diet products, we asked the store vendors or staff in drinking and/or eating establishments to provide us with the previous day’s sales figures. Of the outlets that sold these products, fifty-two of 141 (36 %) were unable to provide us with accurate sales figures and only two were able to give us this information from their computerized stock database (one supermarket in Delhi and one in London). The remaining outlets estimated their sales figures.
In Delhi, the sale of regular Pepsi per day amounted to 22 60 l, while that of diet Pepsi was 90 l – only 4 % of all Pepsi sold (Table 3). Similarly, the daily sales of regular Coca Cola was 14 20 l, while that for diet Coca Cola was only 80 l – 6 % of all Coca Cola sold (Table 4). Sales of regular products were substantially greater than those of diet products (P < 0·0001). In London, for Pepsi, 200 l of regular product were sold and 90 l of diet Pepsi – 45 % of all Pepsi sold (P < 0·0001; Table 3). For Coca Cola, the difference was less marked with 730 l sold of regular and 690 l of diet Coca Cola, 94 % of all Coca Cola sold (Table 4).
Table 3 Average daily sales of the different quantities of regular and diet PepsiFootnote * in ninety-two Delhi and forty-nine London outlets
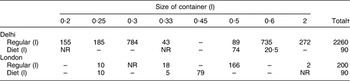
* Total quantity in terms of total numbers of bottles and/or cans sold; NR indicates where no sales figures were provided.
† Total figures have been rounded off to the nearest 10.
Table 4 Average daily sales of the different quantities of regular and diet Coca ColaFootnote * in ninety-two Delhi and forty-nine London outlets
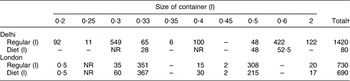
* Total quantity in terms of total number of bottles and/or cans sold; NR indicates where no sales figures were provided.
† Total figures have been rounded off to the nearest 10.
Discussion
Our hypothesis that diet Pepsi and Coca Cola were equally available in both Delhi and London was not supported by our findings. Diet Pepsi and Coca Cola were much less available in Delhi than London, but regular versions were equally available. Furthermore, availability of diet Pepsi and Coca Cola was greatest in the more affluent areas in Delhi, which was also found to be the case in London. Our hypothesis that there were no price differences between diet and regular Pepsi and Coca Cola was partly supported as we found little price difference between the most popularly sold colas in Delhi (Pepsi) and those sold in London (Coca Cola). However, retailers in Delhi were able to make more profit from selling regular than diet Coca Cola and diet Pepsi. Our hypothesis that sales of diet and regular Pepsi and Coca Cola would be similar was not supported in Delhi where we found that the sales of diet compared to regular Pepsi and Coca Cola were lower.
We found that Pepsi was much more widely available than Coca Cola in India, which may be explained by the following: PepsiCo, unlike Coca Cola, started marketing its products as a subsidiary of Punjab Agro Industrial Corporation in the mid-1980s, and it thus gained a 10-year lead over Coca Cola(Reference Kaye14). When trade and economic policies were relaxed in the Indian economy, Coca Cola approached the market selling an American way of life, which failed to resonate among the Indian population. By 2001, Coca Cola focused its attention on competitive pricing compared with traditional Indian soft drinks (e.g. green coconut water, freshly squeezed fruit and vegetable juices, lassi) and introduced a smaller bottle of 200 ml (priced 50 % of the standard container) at a price of 5 INR. It also doubled its distribution to retail outlets from 13 % in 2001 to 25 % in 2003(Reference Kaye14).
There are limitations to the present study. We covered central areas of two large cities in India and the UK. The data collected may not be representative of other cities and cannot give useful information on rural areas where 70 % of the Indian population lives(16). Sales figures relied on the estimated quantities sold and as such may not be accurate, although the differences reported between the sales of diet and regular products in India were very large and unlikely to be explained by measurement error. In addition, we were unable to ascertain the price at which regular and diet Pepsi and Coca Cola were sold by manufacturers to the wholesalers (distributers). Although the manufacturers’ list suggests retail prices for their products, they are not mandatory and it is unclear whether the prices are influenced by the wholesalers in India. We also did not collect data on the sale of healthier alternative and substitute drinks such as water and freshly squeezed fruit juices. Bottled water is widely available in retail outlets in Delhi; the MRP cost of a litre of which is 13 INR, much below the prices for regular and diet Pepsi and Coca Cola. Freshly squeezed fruit juices (the prices vary according to the type of fruit and quantity) are available at specific stores which we did not visit since they did not stock carbonated drinks. Future studies might look at alternatives, comparative prices and consumer preferences.
Despite these limitations, it is clear that the availability of diet products is limited and there may be less profit in selling them, both of which act as barriers to customer choice and tend to increase unnecessary intake of ‘hidden’ energy. If all the shops selling regular Pepsi and Coca Cola were to sell the dietary versions as well, and if the financial disincentives for both vendors and customers for diet products were reduced, it is likely that demand for the lower-energy option would rise to the levels seen in those outlets selling both types of the product – about a threefold higher consumption. Marketing strategies in India do not appear to favour the promotion of diet drinks. Expenditure on marketing amounts to 10 % of Coca Cola’s and 6 % of PepsiCo’s total profits(Reference Lang, Rayner and Kaeling20) and heavily targets young people, adopting stealth strategies (promote ‘safer’ so-called healthier versions of products to increase its sales) and using product placement in films and television and celebrities such as Britney Spears and Shah Rukh Khan to endorse products(Reference Nelson13, 21–Reference Seshan23).
The implications of the promotion of Pepsi and Coca Cola are significant for India, which is already experiencing an obesity epidemic(Reference Reddy, Shah and Varghese24). One can of regular Pepsi contains 573 kJ (137 kcal). Consumption of one can per day above the required daily need of 7845 kJ (1875 kcal) for an average woman for a year equates to a weight gain of 6·5 kg/year. To mitigate the intake of 573 kJ (137 kcal), a person weighing 60 kg would need to jog for 20 min/d or walk for 45 min/d(25–Reference Ainsworth, Haskell and White27). Moreover, sugar-sweetened soft drinks increase hunger, decrease satiety and calibrate taste preference to a high level of sweetness that generalizes to other high-energy foods(Reference Harrington7, Reference Ainsworth, Haskell and White27–Reference Ebbeling, Feldman and Osganian29).
In India, as in most developing countries, growing affluence has spurred the demand for clean and safe drinking water and the increased demand for bottled water has further boosted total soft drink sales(Reference Regmi15). In 2006, the Indian Migration Study determined that the rate of consumption of at least one aerated drink per week (Fanta/Pepsi/Coca Cola) was 19 % among those under 30 years of age compared to 8 % among those more than 51 years(Reference Lyngdoh, Kinra and Ben Shlomo30). A study on the knowledge of nutrition of adolescent girls in Hyderabad in 2007 found that 50 % consumed an aerated drink 1–2 times/week irrespective of socio-economic status(Reference Rao, Vijayapushpam and Subba Rao31, Reference Vijayanpushpam, Menon and Rao32). Soft drinks were once considered products only for the affluent, but by 2003, the sales of carbonated drinks were equally distributed across socio-economic groups in India(Reference Kaye14), which concurs with our finding that a majority of outlets in the poorest areas of Delhi sold regular Pepsi or Coca Cola.
Trends in consumption of carbonated beverages in USA and Europe are on the decline, prompting the Chief Executive Officer of PepsiCo to emphasize the importance of emerging markets in developing countries(Reference Geller33). The declining trend in the developed world has occurred in countries with differing nutritional policies and health promotion programmes(Reference Park34, Reference Nakamura35). It seems likely that the trend has been driven by growing consumer concern about multinational corporate activities(36), consumer demand for drinks that are perceived to be healthy(37) and the massive growth in the bottled water market(Reference Regmi15). Against this background of stronger promotion of carbonated drinks in developing countries, it is essential that policy makers are aware of the potential nutritional consequences of uncontrolled advertising of carbonated beverages on children, the use of product placement in mass media and the penetration of carbonated beverage-vending machines in schools(Reference Johnson-Taylor and Everhart38–Reference Matson-Koffman, Brownstein and Neiner39).
The costs of both Pepsi and Coca Cola in India are high relative to average incomes in India and the UK, but this does not seem to act as a substantial barrier for purchase and consumption. There is limited research on the influence of taxes and subsidies on nutritional quality of food purchases. Evidence suggests stronger support for taxes than for subsidies as a means of reducing consumption of less healthy foods(Reference Epstein, Dearing and Roba40). It has been estimated that a 10 % increase in soft drink prices would reduce consumption by 8–10 %(Reference Scott-Thomas43). However, the implementation of such a policy would require political will. Recent attempts by the US Senate panel, which proposed a tax on sugar-sweetened drinks to fund a ‘Health Care overhaul’, were quashed following heavy lobbying by the US beverage industry(Reference Wayne42, Reference Scott-Thomas43). This is despite current evidence suggesting that taxing carbonated drinks is associated with a reduction in consumption among overweight and obese children who come from low-income families and ethnic minority groups(Reference Sturm, Powell and Chriqui44).
Public health initiatives such as nutritional education programmes may be another way of tackling the rising rates of consumption of carbonated high-energy drinks in India. However, both the communication of food risk and changing individual behaviour are complex, difficult and often unsuccessful in the long term(Reference McGloin, Delaney and Hudson45). For example, major gaps exist in health and nutrition-related knowledge and health behaviour of urban children, parents and teachers in northern India(Reference Shah, Misra and Gupta46). Supporting these findings, a recent study in northern India showed that, in the short term, an urban school-based multi-component nutrition and lifestyle intervention reduced the consumption of carbonated drinks and other energy-dense foods and, most importantly, had a beneficial effect on the obesity and metabolic risk profile(Reference Singhal, Misra and Shah47).
Conclusion
If current consumption patterns of regular Pepsi and Coca Cola continue unchecked, they may make a substantial contribution to the growing obesity and diabetes epidemics in India. Low availability of diet versions of Pepsi and Coca Cola in less affluent areas of Delhi is likely to exacerbate obesity and diabetes trends. Price differentials to promote diet versions and other healthier or traditional low-energy drinks may be beneficial.
Acknowledgements
The present study was funded by the South Asia Network for Chronic Disease. The authors have no conflict of interest to declare. F.C.T. and S.E. contributed to the original concept and prepared the manuscript; F.C.T., A.S., S.K. and G.S. collected the data; A.S. and F.C.T. conducted the data analysis. All authors approved the manuscript.
Appendix