


Fe deficiency remains the most common nutritional deficiency in both developed and developing countries, particularly among adolescent and premenopausal women. In developed countries, for example, the prevalence of Fe deficiency, including depleted Fe stores and Fe deficiency anaemia, among young and middle-aged women is 11 % in the USA(Reference Looker, Dallman, Carroll, Gunter and Johnson1) and 18 % in the UK(Reference Heath and Fairweather-Tait2). Moreover, in Japan, Uchida et al. reported in 1992 a prevalence of depleted Fe stores of 41·4 % and of Fe deficiency anaemia of 8·5 % among women aged 11–90 years(Reference Uchida, Kawachi, Sakamoto, Igaki, Ogasawara, Kariyone, Matsuda, Tanaka, Kimura and Kokubun3). Fe deficiency has been related with impaired neuropsychological function(Reference Sanstead4), reduced worker productivity(Reference Scholz, Gross, Schultink and Sastroamidjojo5), lowered immunity and decreased metabolic rate(Reference Scrimshaw6). Further, Fe deficiency anaemia in pregnancy often contributes to higher child and maternal mortality(Reference Brabin, Hakimi and Pelletier7) as well as increased risk of preterm delivery(Reference Scholl and Reilly8). Given that supplementation is considered the most effective treatment, the most common response has been Fe fortification of white flour and other foods, mainly in Western countries.
Several studies in Western countries have reported the important effect of dietary habits on body Fe status(Reference Galan, Yoon and Preziosi9–Reference Cade, Moreton, O’Hara, Greenwood, Moor, Burley, Kukalizch, Bishop and Worwood11). These studies have shown that increasing total or haem Fe intake correlates with better body Fe status; in other words, higher intake of Fe is associated with a lower prevalence of Fe deficiency. In apparent contradiction, however, Pynaert et al. recently reported the lack of any significant differences in Fe status parameters between women with high and low Fe intake(Reference Pynaert, Delanghe, Temmerman and De Henauw12), and called for reconfirmation of the efficacy of increasing Fe intake to improve Fe status.
In addition to Fe itself, several other dietary factors are also known to be associated with Fe levels in man. Absorption is improved by vitamin C and animal tissues such as meat, poultry and fish, but inhibited by phytate, polyphenols, vegetable proteins and Ca(Reference Heath and Fairweather-Tait2). Several lifestyle factors also have considerable effects on body Fe status. Intensive sports and excessive menstrual blood loss are important risk factors for Fe deficiency(Reference Suedekum and Dimeff13, Reference Harvey, Armah, Dainty, Foxall, Lewis, Langford and Fairweather-Tait14). In particular, menstrual blood loss is thought to be a major cause of deficiency in women(Reference Galan, Yoon and Preziosi9, Reference Harvey, Armah, Dainty, Foxall, Lewis, Langford and Fairweather-Tait14–Reference Barr, Brabin, Agbaje, Buseri, Ikimalo and Brigg16).
To our knowledge, however, no study has examined the correlation between Fe status and dietary intake measured quantitatively with respect to lifestyle factors and health condition in Asia. Foo et al. examined Fe status and dietary Fe intake among Malaysian adolescents aged 12–19 years(Reference Foo, Khor, Tee and Dhanaraj17), but did not describe the association between Fe status and Fe intake; while Thankachan et al. showed that inadequate intake of Fe and micronutrients is responsible for the high prevalence of Fe deficiency in India(Reference Thankachan, Muthayya, Walczyk, Kurpad and Hurrell18), but did not refer to lifestyle factors. Thus, the association of dietary habits with Fe deficiency in consideration of lifestyle factors is not clearly known in Asia, including Japan.
Because it combines Asian dietary habits with a level of development comparable to that of Western countries, Japan may be considered unique among Asian countries. Major distinctions of Japanese dietary habits related to Fe intake include lower meat consumption, which results in lower total Fe intake, particularly lower haem Fe intake, vis-à-vis the intake of higher amounts and a wider range of inhibitors of Fe absorption, such as soyabeans and green tea, which are traditional Japanese foods(Reference Park, Paik, Skinner, Spindler and Park19–Reference Tsubono, Nishio, Komatsu, Hsieh, Kanemura, Tsuji, Nakatsuka, Fukao, Satoh and Hisamichi25). In the present study, we examined the association of Fe deficiency and quantitative dietary intake with regard to lifestyle and health-related factors in Japan.
Methods
Subjects
The present study was based on a multi-centre nutritional survey conducted from February to March 2006 and from January to March 2007 among female dietetic students from fifteen institutions in Japan. All measurements at each institution were conducted according to the survey protocol. Briefly, staff at each institution explained an outline of the survey to potential subjects. Subjects who responded positively were then provided detailed written and oral explanations of the general purpose and procedure of the survey. A total of 1176 women (474 women in 2006 and 702 women in 2007) took part in the survey. The study protocol was approved by the Ethics Committee of the National Institute of Health and Nutrition, and written informed consent was obtained from each subject and also from a parent for subjects aged less than 20 years.
Dietary assessment
Dietary habits during the preceding month were assessed using a previously validated, comprehensive, self-administered diet history questionnaire (DHQ)(Reference Sasaki, Ushio, Amano, Morihara, Todoroki, Uehara and Toyooka26–Reference Murakami, Sasaki, Takahashi, Okubo, Hirota, Notsu, Fukui and Date29). All answered DHQ, as well as a lifestyle questionnaire, were checked at least twice for completeness and when necessary reviewed with the subject to ensure the clarity of answers.
The DHQ is a 16-page structured questionnaire that consists of the following seven sections: (i) general dietary behaviour; (ii) major cooking methods; (iii) consumption frequency and amount of six alcoholic beverages; (iv) consumption frequency and semi-quantitative portion size of 122 selected food and non-alcoholic beverage items; (v) dietary supplements; (vi) consumption frequency and semi-quantitative portion size of nineteen cereals usually consumed as staple foods (rice, bread and noodles) and miso (fermented soyabean paste) soup; and (vii) open-ended items for foods consumed regularly (at least once per week) but not appearing in the DHQ. Items and portion sizes were derived primarily from data in the National Nutrition Survey of Japan and several recipe books for Japanese dishes(Reference Sasaki, Yanagibori and Amano27). Information on dietary supplements, including Fe supplements, and data from open-ended questionnaire items were not used in the dietary intake calculation. Estimates of dietary intake for a total of 150 food items, energy and selected nutrients were calculated using an ad hoc computer algorithm for the DHQ, based on the Standard Tables of Food Composition in Japan (30). Nutrient and food intakes were energy-adjusted using the density method, i.e. percentage of energy for energy-providing nutrients and amounts per 4184 kJ (1000 kcal) of energy for other nutrients and foods.
A detailed description of the validity of the DHQ with respect to commonly studied nutritional factors and the methods used to calculate dietary intake have been published elsewhere(Reference Sasaki, Ushio, Amano, Morihara, Todoroki, Uehara and Toyooka26–Reference Murakami, Sasaki, Takahashi, Okubo, Hirota, Notsu, Fukui and Date29). For example, Pearson’s correlation coefficients between the DHQ and 3 d estimated dietary records were 0·48 for energy, 0·48 for protein, 0·55 for fat, 0·48 for carbohydrate and 0·40 for Fe in forty-seven women(Reference Sasaki, Yanagibori and Amano27). Further, Pearson’s correlation coefficients between the DHQ and 16 d weighed dietary records among ninety-two women were 0·32 for energy, 0·47 for protein, 0·56 for fat, 0·60 for carbohydrate and 0·63 for Fe (S Sasaki, unpublished results). These correlation coefficients are acceptable, because they are similar to those of other self-administered dietary assessment methods developed and widely used in other countries.
Intakes of haem Fe, non-haem Fe, phytate and bioavailable Fe were estimated using DHQ data. Haem Fe was assumed to constitute 40 % of total Fe(Reference Monsen, Hallberg, Layrisee, Hegsted, Cook, Mertz and Finch31), including that in meat and fish. The remaining total Fe intake was assumed to be non-haem Fe. Because we had insufficient information on the phytate content in Japanese food, we used dietary composition data from other countries(Reference Harland and Oberleas32–Reference Khokhar, Pushpanjali and Fenwick35). Bioavailable Fe is the amount of Fe actually absorbed and utilized in the body, and is determined by several factors, including intake of phytate, Ca, vitamin C, meat, fish, tea and coffee and the individual’s Fe status. Of several algorithms developed to estimate bioavailable Fe(Reference Monsen, Hallberg, Layrisee, Hegsted, Cook, Mertz and Finch31, Reference Monsen and Balintfy36–Reference Hallberg and Hulthen40), we estimated its intake based on that by Bhargava et al.(Reference Bhargava, Bouis and Scrimshaw37) (Table 1). Briefly, total bioavailable Fe was obtained by summing bioavailable haem Fe and bioavailable non-haem Fe, with bioavailable haem Fe calculated by multiplying haem Fe intake by a constant determined in accordance with the individual’s Fe status. Three possible scenarios of body Fe reserve were considered: (i) 500 mg (adequate reserve); (ii) 250 mg (median reserve), at which functional alterations due to Fe deficiency had likely not occurred; and (iii) 0 mg, at which functional alterations might already have become apparent. Bioavailability of non-haem Fe was calculated for each body Fe reserve by multiplying bioavailability derived from adjustment for an enhancement factor and bioavailability derived from adjustment for phytate. The enhancement factor was obtained by summing the intake of meat (g), fish (g) and vitamin C (mg)(Reference Monsen and Balintfy36). Bioavailable non-haem Fe was derived from the product of non-haem Fe intake and bioavailability of non-haem Fe. In addition, we adjusted for the effect of black tea and coffee, as well as for that of Ca, using the algorithm of Zijp et al.(Reference Zijp, Korver and Tijburg41). Bioavailability of non-haem Fe was multiplied by 0·8 if intake of black tea and coffee was 450 ml/d or more, and total bioavailable Fe was multiplied by 0·5 if Ca intake was more than 300 mg/d.
Table 1 Algorithm for the estimation of bioavailable iron intakeFootnote *
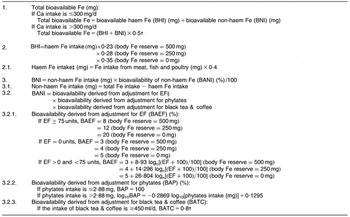
* Mainly derived from the algorithm reported by Bhargava et al.Reference Bhargava, Bouis and Scrimshaw(37).
†From Zijp et al.Reference Zijp, Korver and Tijburg(41).
‡Eggs and dairy products are included in non-haem Fe.
§EF = vitamin C (mg) + meat (g); ‘meat’ includes meat, fish and poultry.
Diagnostic criteria of depleted Fe stores and Fe deficiency anaemia
Body Fe status was assessed using blood analysis for serum Fe, ferritin and Hb concentrations. In accordance with the survey protocol, blood samples were transported at −20°C by car or aeroplane to ensure delivery to a laboratory in Tokyo, Japan (SRL Inc. in 2006 and Mitsubishi Kagaku Bio-Clinical Laboratories Inc. in 2007) and assayed within 1–2 d of collection to avoid significant degradation. The colorimetric method (Nitroso-PSAP method) was used to measure serum Fe, and chemiluminescent enzyme immunoassay (CLEIA method) to measure serum ferritin.
Depleted Fe stores was diagnosed when serum ferritin levels were <12 ng/ml and Hb concentrations were ≥12 g/dl; and Fe deficiency anaemia when serum ferritin levels were <12 ng/ml and Hb concentrations were <12 g/dl(Reference Cook and Finch42, Reference Cook and Skikne43). ‘Fe deficiency’ included both depleted Fe stores and Fe deficiency anaemia.
Other variables
Residential areas were grouped into three categories: (i) north (Hokkaido, Tohoku and Kanto); (ii) central (Tokai, Hokuriku, and Kinki); and (iii) south (Kyushu and Chugoku), based on the regional blocks used in the National Nutrition Survey in Japan (hereafter referred to as ‘residential block’). They were also grouped into three categories according to population size: (i) city with population ≥1 million; (ii) city with population <1 million; and (iii) town or village (hereafter referred to as ‘size of residential area’). Current smoking status was self-reported in the lifestyle questionnaire, while current dietary supplement use and alcohol intake were assessed in the DHQ. Alcohol drinking status was divided into three categories: (i) non-drinker; (ii) drinker 1 (>0 % to <1 % of total energy intake); and (iii) drinker 2 (≥1 % of total energy intake). BMI was calculated as body weight (kilograms) divided by the square of body height (metres). Menstrual cycle and the amount of menstrual flow during the preceding 12 months were also self-reported in the lifestyle questionnaire. With regard to menstrual cycle, the ‘regular’ category included the number of subjects who replied ‘always regular’ and ‘almost always regular’; ‘irregular’ included those replying ‘half-regular and half-irregular’; and ‘infrequently or none’ included ‘mostly irregular’, ‘almost none’ and ‘none’. For amount of menstrual flow, the ‘light’ category included ‘light flow’; ‘average’ included ‘average flow’ and ‘bleeding with mucus’; and ‘heavy’ included ‘heavy flow’ and ‘bleeding with clots’. Physical activity was computed as average MET-h/d (where MET = metabolic equivalent)(Reference Ainsworth, Haskell, Leon, Jacobs, Montoye, Sallis and Paffenbarger44) on the basis of the frequency and duration of five different activities (sleeping, high- and moderate-intensity activities, walking and sedentary activities) over the preceding month, as reported in the lifestyle questionnaire(Reference Murakami, Sasaki, Takahashi and Uenishi45).
Statistical analysis
Subjects for analysis were identified as described below. In total, 466 women aged 18–25 years enrolling in 2006 and 677 enrolling in 2007 underwent peripheral blood examination. Subjects were excluded from the study if they had missing covariate information (n 29); extremely low or high daily energy intake (≤4184 or ≥14 644 kJ (≤1000 or ≥3500 kcal); n 31); were using Fe supplements (n 50; two subjects using Fe preparations as therapy for anaemia were included as patients with Fe deficiency anaemia); had asthma (allergic), thyroid disease, diabetes mellitus, renal disease or gastrointestinal disease (n 34); or showed both decreased values for Hb and normal or increased values for ferritin (n 11). Of these last eleven subjects, we assumed normal body Fe status in eight, mild Fe deficiency anaemia in one, Fe deficiency anaemia under Fe supplementation in one, and a haematological disorder other than Fe deficiency anaemia in one. As some subjects were in more than one exclusion category, the final analysis sample comprised 1019 women.
The associations between Fe deficiency and a number of dietary variables, lifestyle variables and health condition were examined. These included twenty-nine dietary variables, i.e. intakes of energy (kJ/d), sixteen nutrients (protein, carbohydrate, fat, total dietary fibre, Ca, total Fe, haem Fe, non-haem Fe, bioavailable Fe (three values for each body Fe reserve), phytate, vitamin A, vitamin C, vitamin D, α-tocopherol, vitamin B12 and folic acid), ten food groups (meat, fish, cereals, dairy products, green vegetables, other vegetables, pulses, potatoes, fruits and eggs), black tea and coffee; three lifestyle variables (current smoking status (yes; no), alcohol drinking status (non-drinker; drinker 1; drinker 2) and physical activity (divided into tertiles)); and BMI (<18·5 kg/m2; ≥18·5 and <25 kg/m2; ≥25 kg/m2), menstrual cycle (regular; irregular; infrequent or none) and amount of menstrual flow (light; average; heavy). Dietary variables were classified by quintile and analysed. In addition, survey year (2006 or 2007), residential block and size of residential area were included as potential confounding factors in the model.
We calculated both crude and multivariate-adjusted odds ratios and 95 % confidence intervals for Fe deficiency for each category of included variables using three logistic regression models. In model 1, OR were adjusted for survey year, residential block, size of residential area, current smoking status, alcohol drinking status, physical activity, energy intake, BMI, menstrual cycle and Fe intake. In model 2, they were adjusted for the same factors as in model 1, including amount of menstrual flow instead of menstrual cycle. In model 3, they were adjusted for the same factors as in model 1 and also amount of menstrual flow. Physical activity, energy intake and BMI were used as continuous variables when they were added as covariates in the models. As results for the crude and multivariate analyses were similar for all variables analysed, we present here only those derived from the multivariate models. Trends of association were examined using a logistic regression model which assigned scores to the level of the independent variable.
All statistical analysis was performed using the SAS statistical software package version 9·1 (SAS Institute Inc., Cary, NC, USA). A two-sided P value of <0·05 was considered statistically significant.
Results
Subject characteristics are shown in Table 2. Mean age, total energy and total Fe intake were 19·6 years, 7364 kJ/d (1760 kcal/d) and 3·7 mg/4184 kJ, respectively. Mean estimated bioavailable Fe for each body Fe reserve was 0·067 mg/4184 kJ (supposed body Fe reserve = 500 mg), 0·092 mg/4184 kJ (250 mg) and 0·140 mg/4184 kJ (0 mg). A total of 179 (17·6 %) of 1019 women were classified as having depleted Fe stores and seventy-one (7·0 %) as having Fe deficiency anaemia, giving 250 (24·5 %) women categorized with Fe deficiency.
Table 2 Characteristics of the subjects: female Japanese dietetic students (n 1019) aged 18–25 years

MET, metabolic equivalent.
Table 3 shows the multivariate-adjusted odds ratios and 95 % confidence intervals for Fe deficiency by quintiles of dietary factors. Intakes of total Fe, haem Fe, non-haem Fe and bioavailable Fe were not significantly associated with Fe deficiency, nor was any association observed for any other dietary factor. Since results for the three multivariate models described in the statistical analysis section were similar for all variables analysed, we present only those derived from model 3 (full model), including both menstrual cycle and amount of menstrual flow, in Table 3.
Table 3 Multivariate-adjusted odds ratios and 95 % confidence intervals for iron deficiency by quintile of intake of energy, nutrients and food groups among 1019 Japanese women aged 18–25 years

Q, quintile. BIR, body Fe reserve.
*Adjusted OR: adjusted for survey year (2006 or 2007), residential block (north, Hokkaido, Kanto and Tohoku; central, Tokai, Hokuriku and Kinki; south, Kyushu and Chugoku), size of residential area (city with population ⩾1 million; city with population <1 million; town or village), current smoking status, alcohol drinking status, physical activity (total MET-h/d, continuous; where MET = metabolic equivalent), energy intake (kJ/d, continuous), BMI (kg/m2, continuous), menstrual cycle, amount of menstrual flow and Fe intake (mg/4184 kJ, quintiles). Nutrients and food groups other than total Fe were substituted singly.
Nutrients and food groups that were analysed but found not to be related with Fe deficiency were total Fe, haem Fe, non-haem Fe, bioavailable Fe, phytate, vitamin C, Ca, protein, carbohydrate, fat, total dietary fibre, vitamin A, vitamin D, α-tocopherol, vitamin B12, folic acid, meat, fish, cereals, dairy products, green vegetables, other vegetables, pulses, potatoes, nuts, fruits, eggs, black tea and coffee.
Table 4 shows the multivariate-adjusted odds ratios and 95 % confidence intervals for Fe deficiency in each category of selected lifestyle factors and health condition. Infrequent menstrual cycles was associated with a decreasing prevalence of Fe deficiency. In comparison with women categorized as having regular menstrual cycles, the multivariate-adjusted OR (95 % CI) for women categorized with infrequent or no menstrual cycles was 0·58 (0·34, 1·00) using model 1. On the other hand, heavy menstrual flow was associated with an increasing prevalence of Fe deficiency. In comparison with women categorized with average flow, the multivariate-adjusted OR (95 % CI) for women in the heavy menstrual flow category was 1·83 (1·35, 2·48) using model 2 and 1·85 (1·36, 2·51) using model 3. Correspondingly, women with a lighter flow showed a significantly lower prevalence of Fe deficiency in comparison with those with an average flow. No other lifestyle factors or health conditions were associated with the prevalence of Fe deficiency. These results were not altered if any value for bioavailable Fe intake was included in the model in place of total Fe intake.
Table 4 Multivariate-adjusted odds ratios and 95 % confidence intervals for iron deficiency in relation to selected lifestyle factors and health conditions among 1019 Japanese women aged 18–25 years
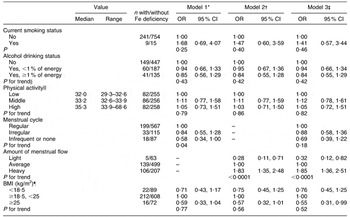
*Model 1: adjusted for survey year (2006 or 2007), residential block (north, Hokkaido, Kanto and Tohoku; central, Tokai, Hokuriku and Kinki; south, (Kyushu and Chugoku), size of residential area (city with population ≥1 million; city with population <1 million; town or village), current smoking status, alcohol drinking status, physical activity (total MET-h/d, continuous; where MET = metabolic equivalent), energy intake (kJ/d, continuous), BMI (kg/m2, continuous), menstrual cycle and total Fe intake (mg/4184 kJ, quintiles).
†Model 2: adjusted for the same factors as model 1, including amount of menstrual flow instead of menstrual cycle.
‡Model 3: adjusted for the same factors as model 1 and amount of menstrual flow.
§Trend of association was examined by a logistic regression model assigning scores to the levels of the independent variable.
||Physical activity was divided into three groups by tertiles, and odds ratios were calculated by using groups of physical activity as a categorical variable in the models.
¶BMI was divided into three groups at values of 18·5 and 25 kg/m2, and odds ratios were calculated by using groups by BMI as a categorical variable in the models.
Discussion
In the present study, we found no association between Fe deficiency and a wide range of dietary variables. In contrast, Fe deficiency was associated with menstrual condition, with infrequent menstrual cycles associated with a decreasing prevalence of Fe deficiency while heavy menstrual flow was associated with an increasing prevalence.
Overall prevalence of Fe deficiency in the study was 24·5 % (depleted Fe stores, 17·6 %; Fe deficiency anaemia, 7·0 %). Given the prevalence ratios in a previous study in Japanese women aged 11–90 years of 41·4 % for depleted Fe stores and 8·5 % for Fe deficiency anaemia(Reference Uchida, Kawachi, Sakamoto, Igaki, Ogasawara, Kariyone, Matsuda, Tanaka, Kimura and Kokubun3), our present ratios are relatively low. However, these results should be interpreted carefully, as all subjects were volunteer dietetic students who may have led a relatively healthy lifestyle. On the other hand, mean Fe intake among our subjects was a relatively low, 3·70 mg/4184 kJ with energy adjustment or 6·55 mg/d without. The lower mean Fe intake in Japan than in other developed countries(Reference Park, Paik, Skinner, Spindler and Park19–Reference Matsuda-Inoguchi, Shimbo, Nakatsuka, Watanabe, Higashioka and Ikeda22) is likely attributed to the different dietary habits of most Japanese, with greater consumption of rice and fish and lower consumption of meat(Reference Tsugane, Sasaki, Kobayashi, Tsubono and Sobue23). This difference in Japanese dietary habits also likely influenced bioavailable Fe levels in our study.
Dietary factors known to enhance Fe absorption are ascorbic acid (vitamin C), animal tissues (such as meat, fish and poultry), organic acids (such as citric acid and lactic acid), fermented soya products, cysteine-containing peptides(Reference Heath and Fairweather-Tait2) and vitamin A(Reference Layrisse, Garcia-Casal, Solano, Baron, Arguello, Llovera, Ramirez, Leets and Tropper46). When present in sufficient quantity, ascorbic acid has been reported to enhance non-haem Fe absorption in a dose-dependent manner, owing to its ability to overcome the inhibitory effect of phytate(Reference Davidsson, Galan, Kastenmayer, Cherouyrier, Juillerat, Serge and Hurrell47). Animal tissues, especially red meat such as beef, pork and lamb, not only enhance Fe absorption, but are also excellent sources of highly bioavailable haem Fe(Reference Fleming, Tucker, Jacques, Dallal, Wilson and Wood48). In contrast, phytate, polyphenols, Ca, dairy products, soya proteins and dietary fibres are known to inhibit non-haem Fe absorption(Reference Heath and Fairweather-Tait2, Reference Galan, Yoon and Preziosi9). We estimated phytate intake values in the present study and found them to be compatible with those previously reported(Reference Bhargava, Bouis and Scrimshaw37, Reference Rodriguez, Hotz and Rivera39). Nevertheless, a food composition table describing phytate content in Japanese food is not available, and further studies are needed to confirm phytate intake in the Japanese population. Phytate intake is also essential to the estimation of bioavailable Fe intake, and measurement of phytate content in Japanese food is therefore also necessary to clarify bioavailable Fe intake in Japan.
To estimate bioavailable Fe intake, we used the algorithms developed by Bhargava et al.(Reference Bhargava, Bouis and Scrimshaw37) because these algorithms were established for Bangladeshi subjects who mainly consume rice and do not eat so much animal products. Also, the algorithms were thought to be suitable for our available data because we did not have enough information about polyphenols and tea except black tea, which is needed to use the Hallberg or Tseng algorithms.
We examined all of the dietary factors known to affect Fe metabolism except organic acids, fermented soya products and cysteine-containing peptides. However, results showed no significant association between body Fe status and any dietary factor including total Fe, haem Fe, non-haem Fe and bioavailable Fe. Although our sample size was relatively small and subject characteristics were relatively uniform, the range of Fe intake of 2·50 to 20·01 mg/d suggested a sufficient dispersion of Fe intake.
With regard to the influence of menstruation, results suggested the presence of a dose–response relationship between the amount of menstrual flow and the prevalence of Fe deficiency, albeit that assessment of menstruation was based strictly on unguided self-reporting. These results are consistent with those of previous studies(Reference Harvey, Armah, Dainty, Foxall, Lewis, Langford and Fairweather-Tait14, Reference Milman49) and clearly are plausible. Menstrual loss of Fe is the main source of variation in the Fe requirements of non-pregnant, menstruating women and higher menstrual blood loss is associated with a higher prevalence of Fe deficiency(Reference Harvey, Armah, Dainty, Foxall, Lewis, Langford and Fairweather-Tait14, Reference Heath, Skeaff, Williams and Gibson15). Furthermore, several studies have reported a significant inverse correlation between Fe stores and the duration of menstruation(Reference Milman49–Reference Rangan, Aitken, Blight and Binns51). In addition, a number of studies in European women have shown a skewed distribution in menstrual blood losses(Reference Milman49, Reference Hallberg, Hogdahl, Nilsson and Rybo52–Reference Milman, Kirchhoff and Jogersen54): while median menstrual loss was about 30 ml, equivalent to a daily Fe loss of 0·45 mg, 25 % had a loss exceeding 0·85 mg/d and 5 % had a loss exceeding 1·75 mg/d. It is suggested that a fraction of women have Fe requirements substantially above mean values.
It might be interesting to explore the relationship between hormonal contraceptive use and Fe deficiency, because usage of hormonal contraceptives clearly affects menstruation. However, it was reported that only 1·1 % of Japanese women of reproductive age (15–49 years) are using them(55). Therefore we did not include the contraceptive method in our model.
Other lifestyle factors, including current smoking status, alcohol drinking status and physical activity level, as well as BMI, were not associated with the prevalence of Fe deficiency. However, several important factors not considered in the study are likely relevant. For example, body Fe status may be affected by several genetic variations. Although no genetic syndrome in man causing isolated Fe deficiency has been described, differences in response to Fe-deficient diets in genetically distinct mice have been observed(Reference Morse, Beard and Jones56). Several case reports have described familial Fe deficiency anaemia that is unresponsive to oral Fe therapy and incompletely responsive to parenteral Fe therapy(Reference Buchanan and Sheehan57–Reference Pearson and Lukens59). Further, mutation of the hereditary haemochromatosis (HEF) gene is well-known as the most common cause of hereditary haemochromatosis(Reference Beutler, Felitti, Koziol, Ho and Gelbart60, Reference McCune, Al-Jader, May, Hayes, Jackson and Worwood61).
Several limitations of the present study warrant mention. First, although Fe deficiency has been widely studied, definitions of Fe deficiency, depleted Fe stores and Fe deficiency anaemia have not been properly established. We based our diagnosis of Fe deficiency on previously reported values for Hb concentration and serum ferritin level(Reference Cook and Finch42, Reference Cook and Skikne43). Nevertheless, concerns about the use of serum ferritin level as an index of body Fe status have been expressed; among them, serum ferritin escalation can coincide with minor infection that is not related to levels of Fe stores(Reference Hulthen, Lindstedt, Lundberg and Hallberg62) and day-to-day variability may be subject to measurement imprecision(Reference Borel, Smith, Derr and Beard63, Reference Cooper and Zlotkin64).
Given these concerns, several studies have used transferrin saturation (the value of serum Fe/total Fe binding capacity × 100 (%)) in combination with Hb concentration and serum ferritin level as an index of Fe deficiency(Reference Cook and Finch42, Reference Cook and Skikne43, Reference Cook, Skikne, Lynch and Reusser65). Generally, Fe deficiency is diagnosed when transferrin saturation is below 16 %. However, transferrin saturation similarly decreases with mild or transient infection and shows wide diurnal variation in normal individuals(Reference Cook and Finch42). Given that our present subjects were young and assumed to be generally healthy, we considered that the presence of infection would be less likely. To simplify diagnostic criteria, we therefore restricted the indices to serum ferritin level and Hb concentration.
Second, although the DHQ used has been validated with respect to commonly studied nutritional factors, including Fe, as described above, the validity of several factors used in the present study, including bioavailable Fe and phytate, is unknown. The results should thus be interpreted with caution. Additionally, it is true that misreporting is one of the major limitations of any self-reported dietary assessment method. However, the reporting accuracy of the subjects was thought to be acceptable according to a previous study(Reference Murakami, Sasaki and Takahashi66) which included the same subjects as the present study. In the present study, reporting accuracy was calculated as the ratio of reported dietary intake obtained from the DHQ to estimated dietary intake obtained from respective biological markers, and most of the calculated values were in the range of 0·9–1·2. For the analysis of our study, nutrient and food intakes were energy-adjusted to avoid the effect of misreporting.
Finally, the present study was a cross-sectional study and thus susceptible to the possibility of reverse causality. Namely, subjects who were conscious of their own Fe deficiency might have increased their consumption of Fe-rich foods. We therefore excluded from analysis those subjects taking Fe supplements, but included two subjects using Fe preparations as therapy for anaemia as patients with Fe deficiency anaemia without regard to Hb or serum ferritin values.
In conclusion, we found no association between any dietary habit, including Fe intake, and Fe deficiency. In contrast, the only variables showing a statistically significant association with the prevalence of Fe deficiency were related with menstrual condition, i.e. menstrual cycle regularity and amount of menstrual flow.
Acknowledgements
Source of funding: This work was supported by grants from the Japanese Ministry of Health, Labour and Welfare.
Conflict of interest declaration: None of the authors has any conflict of interest to declare.
Authorship responsibilities: K.A. was involved in designing the study, conducted the statistical analysis and wrote the manuscript. S.S. was responsible for designing the study, data collection and data management, the overall management, and assisted in manuscript preparation. K.M. coordinated the field work, was involved in designing the study, data collection and data management, and assisted in manuscript preparation. Y.T. and K.U. were involved in study design, data collection and data management. M.Y. was involved in study design and assisted in statistical analysis. Y.N., Y.K. and T.T were involved in study design and assisted in manuscript preparation. All of the authors provided suggestions during the preparation of the manuscript and approved the final version submitted for publication.


