


School feeding programmes have, in theory, the potential to contribute to at least three Millennium Development Goals1: to reduce the proportion who suffer from hunger (Goal 1) and are underweight; to help achieve universal primary education (Goal 2); and to promote gender equality (Goal 3) through effects on school enrolment, attendance, retention, concentration and attainment. School feeding may perhaps also help to improve maternal health (Goal 5) by retaining adolescent girls in school and improving their nutrition. The evidence for an impact of school feeding on enrolment and attendance and on reducing the gender gap is considered to be strongReference Bennett2. There is some evidence from research studies of an effect of breakfast on school performance, particularly in malnourished children, but there have been no long-term evaluations of programmes in the poorest countries of the world in terms of educational or cognitive outcomesReference Grantham-McGregor3. Nevertheless, improving enrolment, attendance and learning are now the main objectives of school feeding programmes operated by the World Food Programme4.
According to several recent reviews, the evidence for the impact of school feeding programmes on growth and nutritional status is weak, mainly because there have been few published evaluations of large-scale school feeding programmesReference Bennett2, Reference del Rosso5, Reference Kristjansson, Robinson, MacDonald, Krasevec, Petticrew and Janzen6. There are three main reasons for this.
First, it is impossible to provide a placebo control for energy and protein in food, although controls can be provided for micronutrient supplementsReference van Stuijvenberg, Kvalsvig, Faber, Kruger, Kenoyer and Benade7. Second, if controls are provided by simply not giving food to one group of subjects, this can raise ethical issues as food cannot be withheld if there is a humanitarian need. The agencies that administer school feeding programmes cannot randomise undernourished individual children to be fed or not, while schools are typically selected for such programmes based on evidence of short-term hunger, acute undernutrition or local food insecurity8. A consequence is that, if evaluations can be done, they tend to be done in places where the need is not so great, so the potential impact may be underestimated. Finally, the effect of school feeding alone is often difficult to measure because other interventions are typically delivered at the same time, such as deworming, water, sanitation and health education4, so a programme has to be assessed as a package rather than as components.
Because of these problems, governments and development agencies often simply measure the prevalence of underweight or the dropout rate, and ascribe any fall to the impact of the feeding programmeReference Chen9, Reference Swaminathan, Jeyaranjan, Sreenivasan and Jayshree10. But without adequate controls it is not possible to assess whether any improvement is really due to a school feeding programme or would have occurred anyway, perhaps as a result of other development programmes or because of secular changes. Alternatively, if there is no apparent change in an indicator, it may be mistakenly concluded that the programme has had no effect when in fact it has prevented a decline that was not detected because of the lack of controls. This has been seen in studies of giving iron supplements to schoolchildrenReference Agauyo11, Reference Hall, Roschnik, Ouattara, Toure, Maiga and Sacko12. Having controls gives validity to the findings of an evaluation.
If these design issues are not enough to contend with, large-scale nutrition programmes can also suffer from practical problems that affect the delivery and implementation of interventions – another reason why they are quite different from a tightly controlled scientific study and are more about effectiveness than efficacy.
The present paper describes the evaluation of the effectiveness of a school nutrition programme in southern Vietnam and its impact on gains in weight and height.
Methods
The International Development section of Land O'Lakes (LOL), a farmers' cooperative based in Minnesota in the USA, has implemented a large-scale school nutrition programme in Vietnam supported by the sale of commodities donated by the US Department of Agriculture (USDA). At the peak of the programme in 2002, LOL was providing free milk and biscuits each school day to 330 000 children in 2075 schools in six provinces of Vietnam. The provinces were chosen by the government because they were considered to have a high prevalence of undernutrition. A preliminary survey in November 2002 found the highest prevalence of undernutrition in Dong Thap Province, where 38% of schoolchildren were underweight, 40% were stunted and 5% were wasted (LOL, unpublished data). Dong Thap lies in southern Vietnam, on the border with Cambodia, and has a population of some 1.6 million people living in 11 districts13.
Within Dong Thap Province two adjacent districts were chosen by the government for the programme, Hong Ngu and Tan Hong. A third contiguous district in which the programme was not being implemented, Tam Nong, was chosen by LOL for comparison purposes. Within the programme districts of Hong Ngu and Tan Hong, 23 schools were selected for the evaluation because they lay as close as possible to the border with the comparison district of Tam Nong. Similarly in Tam Nong District, 20 schools were selected for the evaluation, all lying as close as possible to the border with the two programme districts. The distance between schools was estimated using a map with a scale of 1:450 000. By minimising the distance between the two groups of schools across an administrative border, the intention was to lessen the impact of environmental factors that affect food supply and disease transmission, two major influences on children's nutritional status and growth. As children in Vietnam attend the school in the commune in which they live, they could not enrol in a school in another district where food was being provided, so contamination was minimised.
Baseline survey
A sample size calculation using data from the survey in six provinces indicated that, to detect a difference in weight of an arbitrary 0.5 kg between groups or about a 3% difference, a sample of 568 children was required. As children were clustered in schools a design effect of 1.5 was applied and the sample size was increased by an arbitrary 15% to allow for losses to follow-up. The final sample size of 980 children was rounded up to 1000 per group.
All primary schools in the study districts operate two shifts, one in the morning and one in the afternoon. Children in grade 1, who are supposed to enrol at 6 years of age, were selected for study. This grade was chosen because data showed that a sample size of 1000 could roughly be met by studying all children in both groups of schools, and because grade 1 children had not yet been fed or dewormed, as had other children in the programme schools.
The baseline survey was done at the start of the school year, from 3 to 11 November 2003. Each child in grade 1 was weighed to a precision of 0.1 kg using a digital scale (Tanita) that was checked daily with known weights. Height was measured to a precision of 0.1 cm using a Microtoise stadiometer. All measurements were made by trained staff of the Nutrition Center, Ho Chi Minh City who were monitored and checked by one of the investigators (T.T.M.H.).
The sex of each child was recorded and the date of birth was copied from the school register, information that had been taken from the child's birth certificate on enrolment in school.
Interventions
From November 2003 all children in programme schools were given each school day a 30-g packet of baked biscuits made from wheat flour fortified with 18 vitamins and minerals that provided 150 kcal of energy. In addition they were given 200 ml of ultra heat-treated cow's milk fortified with vitamins A and D in a waxed paper packet, which also provided 150 kcal of energy. The milk and biscuits provided each day 1400 IU retinol, while the biscuits contained 60 μg iodine, 5 mg iron and 6 mg zinc. Both the milk and biscuits were given to children during a formal school break on five days a week: at 09.10 hours for the morning shift, 130 min after the start of school; and at 14.40 hours for the afternoon shift, again 130 min after the start of school. This was done to try and minimise substitution, the tendency of parents not to give their children breakfast or lunch because they were getting food at school. Teachers were asked to ensure that the food was consumed on the spot.
After a week of feeding, bacterial contamination of the milk halted its production for safety reasons. Feeding resumed on 12 January 2004, after an interval of 45 potential feeding days, and continued until the end of the school year on 22 May 2004.
Feeding resumed at the start of the new school year on 6 September 2004 but, because of a lack of funds, it was stopped in Tan Hong District. This meant that 16 programme schools were lost to follow-up, leaving seven remaining programme schools, all in Hong Ngu District.
The cut in funding also meant that children in Hong Ngu District could only be given milk on three days a week and biscuits on two days a week. From 17 January 2005 the children were given a new milk formula fortified with 16 vitamins and minerals called ‘Supermilk’.
As a result of these breaks and changes in the programme, by the time of the final survey in April 2005, the children in the seven remaining programme evaluation schools had received a maximum of 142 days of milk, 31 days of ‘Supermilk’ and 143 days of biscuits, which had provided about 46 500 kcal of energy over a maximum of 529 days, the period between the date of the first day of the baseline survey and the last day of the final survey.
In addition to the food, the children in the programme schools were dewormed twice, once in February 2004 and again in September 2004, using 400 mg albendazole, a treatment for soil-transmitted helminths recommended by the World Health Organization14.
As well as the milk, biscuits and deworming provided in the programme schools, pupils also received information about nutrition and hygiene from a variety of sources including printed posters, plaques, calendars and height scales in schools, and on leaflets and fliers for pupils to take home. A total of nine different rotating messages concerning health, hygiene and nutrition were printed on milk cartons.
In order to provide some benefit to children in the comparison schools who participated in the baseline survey, all children were given a single dose of albendazole in November 2003.
Final survey
A final survey was done between 11 and 15 April 2005 in the seven remaining programme schools (initially 23) and in the 14 closest comparison schools (initially 20), thereby retaining two comparison schools for each programme school. The children who had been studied in the baseline survey were identified and measured again using the same methods.
In order to assess whether substitution had occurred, a short questionnaire was administered to a sample of 200 children in grade 3 in the programme schools and 200 children in the comparison schools. A sample size calculation indicated that this number would enable a difference in proportions of 0.1 to be detected between groups.
Children in grade 3 were interviewed because they were considered old enough to be able to answer questions about themselves. The children were asked if they had eaten breakfast or lunch before coming to school that day, depending on the shift, and if they had also eaten on their return from school the previous day. This combined the substitution of the snack for a meal before or after school in both shifts.
Data analysis
Data were double-entered into a computer using EpiInfo software version 6.04b (Centers for Disease Control and Prevention), which was also used to calculate Z-scores of height-for-age and weight-for-age in comparison with the National Center for Health Statistics reference values15. The data were analysed using the Statistical Package for the Social Sciences version 12 (SPSS Inc.) and Stata version 8 (StataCorp).
The means of measurements and indices were tested for statistical significance using Student's t-test. Differences between proportions were tested for statistical significance using the chi-square test or by Fisher's exact test if the expected numbers in any cell were less than five. Linear regression was used to examine the relationship between the change in weight and height and explanatory variables, including the programme and the initial degree of undernutrition (as this may influence the degree of change), while controlling for the sex and age of the child at baseline. This analysis was repeated using a multi-level model in Stata which included the school as a variable in order to control for the fact that children were studied in clusters.
Results
The programme schools were on average 7.8 km from the nearest comparison school (range 1.8–12.8 km). There was a greater proportion of boys than girls in the comparison schools than in the programme schools (385/720 vs. 163/360, χ2 = 6.45, P = 0.01).
Table 1 shows the mean age, height, weight and anthropometric indices of children in the seven programme and 14 comparison schools at the baseline survey in November 2003. There were no statistically significant differences between the study groups.
Table 1 Mean, standard deviation (SD) and 95% confidence interval (CI) of age and anthropometric measurements and indices of children in programme and comparison schools at the baseline survey, November 2003
* n = 357.
† n = 711.
Table 2 shows the change in anthropometric measurements and indices between the baseline and final surveys in both the programme and comparison groups. The children in programme schools gained significantly more weight (3.19 vs. 2.95 kg, P < 0.001) and height (8.15 vs. 7.88 cm, P = 0.008) than children in the comparison schools. The difference between the means was small: 0.27 cm in height and 0.24 kg in weight.
Table 2 Mean, standard deviation (SD) and 95% confidence interval (CI) around the mean of changes in anthropometric measurements and indices in children in programme and comparison schools between the baseline survey in November 2003 and the resurvey in April 2005
* n = 345.
† n = 691.
Table 3 shows the results of a regression analysis of the gain in body weight between the surveys while controlling for age, sex and initial Z-score of weight-for-age, an index of the prior degree of underweight. It indicates that older children gained slightly more weight than younger children (P < 0.001); that there was no difference in weight gain between boys and girls (P = 0.059); and that children who had a better initial anthropometric status gained more weight than children who were undernourished (P < 0.001).
Table 3 The results of a regression model in which the change in body weight was the dependent variable (r=0.472, r 2=0.223, adjusted r 2=0.220, F=76.97, P<0.001)
SE – standard error.
Figure 1 shows a scatter plot of the gain in weight of children in each group against the initial Z-score of weight-for-age of each child. For both groups the trend lines were statistically significant, indicating that weight gain over the 17-month period was related to the initial degree of underweight. The exclusion of outliers that were three standard deviations (3SD) greater or less than the mean did not reduce the statistical significance of the associations.
Fig. 1 A plot of the gain in weight between surveys against the Z-score of weight-for-age separately for children in the programme (n = 360) and comparison schools (n = 720). The regression lines are shown as a continuous line for the programme group (r = 0.464, P < 0.001) and as a dotted line for the comparison group (r = 0.327, P < 0.01). The equations for each line are given next to the line, with the 95% confidence interval (CI) of the slope given below
The angle of both lines in Fig. 1 indicates that there was a trend for those who were initially most underweight to gain the least weight. The fact that the two lines diverge indicates that the children in the programme group gained more weight than children in the comparison group, especially those who were initially better nourished. As the 95% confidence intervals for the slopes overlapped, the differences were not statistically significant.
Table 4 shows the results of a regression analysis of the gain in height between surveys while controlling for age, sex and initial Z-score of height-for-age, an indicator of the prior degree of stunting. Table 4 indicates that the programme had a statistically significant impact on height gain. The sex of the child was statistically significant in the model (P = 0.001), indicating that boys gained significantly less height than girls, while children who were initially less stunted gained slightly more height than stunted children (P = 0.011).
Table 4 The results of a regression model in which the change in height was the dependent variable (r=0.184, r 2=0.034, adjusted r 2=0.030, F=9.367, P<0.001)
SE – standard error.
The regression analysis was repeated in a multi-level model in Stata to include the school (cluster) as a variable in the analysis. The difference between programme and comparison groups in their change in weight retained statistical significance (coefficient = − 0.187, t = − 2.46, P = 0.024) but the difference in the change in height was not statistically significant (coefficient = − 0.231, t = − 0.79, P = 0.44).
The greater weight gain of children in the programme schools occurred against a general improvement in anthropometric status assessed as Z-scores. The mean Z-score of weight-for-age of children in the comparison schools, who did not benefit from school feeding, was significantly better at the final survey (baseline, − 1.541 (SD 0.907); resurvey, − 1.458 (SD 0.861); n = 720, P < 0.001). There was also a significant improvement in the mean Z-score of height-for-age (baseline, − 1.534 (SD 1.142); resurvey, − 1.445 (SD 1.087); n = 720, P < 0.001). The percentage of children in the comparison schools who were classified as underweight fell by 4.3% from 30.8 to 26.5%, which was similar to the fall of 3.8% from 29.4 to 25.6% in the programme schools. The percentage of children who were classified as stunted fell by 1.1% in the programme schools from 28.0 to 26.9% and by 5.3% in the comparison schools from 33.9 to 28.6%.
Table 5 shows for each school shift the percentage of children in grade 3 who reported having had breakfast, lunch and dinner in programme and comparison schools, and the percentage who reported that they were hungry at the start or end of the school shift. Even though children in the programme schools were given food at school, around 45% still reported being hungry at the end of their shift. This was 29% less than in the comparison schools for the morning shift (47.1% vs. 75.9%, P < 0.001), but was not significantly different for the afternoon shift (46.2% vs. 55.7%, P = 0.129).
Table 5 Percentage of children who had had breakfast, lunch and dinner, by their school shift, and the percentage who reported they were hungry at the start or end of the school shift
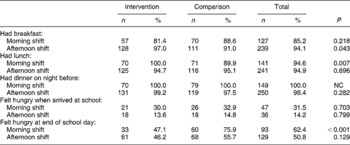
The statistical significance of differences was tested using the chi-square test or Fisher's exact test. NC – no calculation possible.
Discussion
This evaluation indicates that Vietnamese children who were given a snack at school providing 300 kcal of energy and micronutrients gained significantly more weight and height than children who were not fed in schools. When the fact that the children were sampled in clusters was taken into account, only the difference in weight gain remained statistically significant. The difference was small and amounted to about an extra 190 g in weight over a period of about a year and a half. The difference remained statistically significant after controlling for age, sex and the initial degree of underweight, although it seems that the children who gained the most weight were those who were better nourished at the baseline survey (Table 3 and Fig. 1).
The general improvement in anthropometric status over the study, shown as a 4% fall in the prevalence of underweight in both groups, could have been due to three factors: deworming all children at least once; a secular improvement as a result of economic and social development; or the effects of season on food intake, as the surveys were done at different times of the year. It would be necessary to have untreated controls to estimate whether deworming led to the overall drop in the prevalence of underweight and stunting. But this would have meant having a comparison group of children who did not benefit at all from participating in the evaluation, which is hard to justify on ethical grounds. There should be some benefit of participating in an evaluation, and giving treatment for worms is a simple thing to do, although it is only the first step in improving nutritional status. Even if worms have stunted a child's growth, remedial energy, protein and micronutrients may be required after treatmentReference Hall16, Reference Hall17.
The delivery of the milk and biscuits was intermittent: as well as breaks in feeding for weekends and a 3-month summer holiday, there was an enforced break while problems in manufacturing milk were sorted out. The average amount of extra energy given to children in the programme schools was only 89 kcal day− 1. This is based on the assumption that, over the average period of 523 days between the surveys (Table 2), each child had consumed the maximum amount of energy provided by the programme in the form of milk and biscuits of some 46 500 kcal. According to Vietnamese dietary allowances a 7–9-year-old child should be consuming 1800 kcal dailyReference Lien, Giay and Khoi18, so 89 kcal is just under 5% of that amount. As most children were undernourished at the baseline survey, it seems likely that many were not consuming 1800 kcal day− 1, so the extra food provided by the programme probably made a bigger contribution to the children's daily energy requirement. It is also possible that micronutrients such as iron in the biscuits and milk had an impact on growthReference Stoltzfus, Chway, Montresor, Tielsch, Jape and Albonico19.
Nevertheless, the amount of energy given was relatively small when averaged out over a year, and did not seem to bring a benefit in terms of weight gain to the most underweight children, who should be the main targets of such programmes. The World Food Programme recommends that children attending school for half a day should be given 600–900 kcal4. It would be necessary to double the weight of biscuits and the volume of milk to achieve this, an amount of food that a small child would find hard to consume in one snack. An option would be to increase energy density by including an oil-rich peanut paste in the biscuit, something that LOL has been trying in the Philippines and is an ingredient of nutrient-dense foods used for nutritional rehabilitationReference Lopriore, Guidoum, Briend and Branca20.
There was no evidence that the school feeding led to substitution – the practice of replacing the food taken at home with the snack given at school. Over 80% of children in the morning shift in both study groups had received breakfast and 95% of children on the afternoon shift had received lunch on the day they came to school, and there were no differences in proportions between groups (Table 5).
Roughly 30% of all children in the morning shift schools reported feeling hungry before school, suggesting that they had not had enough breakfast before coming to school, but only 14% of children on the afternoon shift felt the same. Short-term hunger may affect concentration and thus learningReference Pollitt21.
If the change in anthropometric indicators in the programme schools alone had been used to assess the impact of the interventions, then it would have been concluded that the percentage of underweight children had fallen by 3.8% and stunted children by 1.1%. This could have been interpreted as a satisfactory outcome of the school nutrition programme. But the prevalence of underweight and stunting dropped by similar amounts in the comparison schools also, so there were no significant differences between study groups in the proportions stunted or wasted at either the baseline or final survey. The differences between study groups were detectable statistically only when comparing mean changes in weight and height in a cohort of children, and it could be argued that the differences were so small as to be biologically inconsequential. But differences in weight gain were detected, and appeared to have moderately robust internal validity when examined in regression models.
The design of the evaluation was not ideal. There was no opportunity to randomise schools as they were all in a district chosen by the government, a common occurrence during programmes. By trying to study children in similar numbers of schools in a small geographic area divided only by an administrative boundary, the aim was to minimise the possible effect of environmental differences and attempt a proximate cluster evaluation. An important contributor to the validity of any findings is the number of clusters in order to distribute variability between study groups. The initial design in the present evaluation was to have >20 clusters in each group but this was compromised by the cut in funding, which led to a loss of 70% of the programme schools taking part in the evaluation. Although the design used in the present study has several flaws it may offer some potential to evaluate district-based nutrition programmes that could help to provide much needed evidence of impact, especially in terms of growth and nutritional status.
Acknowledgements
Sources of funding: The school nutrition programme in Vietnam and this evaluation were supported by the USDA under agreement number OGSM: G-440-2004/142-00-A.
Conflict of interest declaration: A.H. was employed as a short-term independent consultant to provide technical advice to evaluate the programme, analyse the data and write a report for submission by LOL to the USDA. He was not paid to write this paper.
T.T.M.H. was contracted by LOL, Vietnam through the Nutrition Center, Ho Chi Minh City as a consultant to undertake evaluation of the impact of their school nutrition programme. The Nutrition Center was paid by funds available to LOL from the USDA to carry out the evaluation. She was not paid to write this paper.
K.F. and T.P.N.Q. were employed full-time by LOL and undertook this evaluation as a part of their work, funded by the USDA as described above. K.F. was the Country Manager and T.P.N.Q. was Programme Coordinator. The programme ended in September 2005, and K.F. and T.P.N.Q. are no longer employed by LOL. They were not paid to write this paper.
F.V. is employed full-time by LOL as International School Nutrition Programs Coordinator. He was not paid specifically to write this paper.
Authorship responsibilities: A.H. designed the evaluation and the survey instruments with T.T.M.H., K.F., T.P.N.Q. and F.V. The fieldwork was organised and supervised by T.T.M.H. with T.P.N.Q. Data on the operation and coverage of the school nutrition programme were provided by K.F. and T.P.N.Q. The analysis of data was done by A.H. and T.T.M.H. The paper was written by A.H. in collaboration with T.T.M.H., K.F., T.P.N.Q. and F.V.
Acknowledgements:We would like to thank Dr Le Kim Hue, Dr Pham Thi Ngan Ha, Dr Nguyen Nhan Thanh, Dr Nguyen Hong Vu and staff of the Community Nutrition Department of the Nutrition Center, Ho Chi Minh City for their work on the surveys, and the schools and children who participated in the evaluation. Thanks to Veronica Tuffrey for commenting on a draft.


