


1. Introduction
Production quota programs are part of the world's agricultural landscape. In the United States, the majority of production quota programs were implemented during the Great Depression. Generally, as a form of supply management, production quotas were used to restrict production below competitive levels with the intention of improving producer income—this was especially crucial in a time when overproduction and a shrinking international market had driven down agricultural prices (Hurt, Reference Hurt2002).
The impact of production quotas has been examined in several works, including Barichello (Reference Barichello1981), Dawson (Reference Dawson1991), Schmitz (Reference Schmitz1983), Schmitz and Schmitz (Reference Schmitz and Schmitz1994), Schmitz, Coffin, and Rosaasen (Reference Schmitz, Coffin and Rosaasen1996), Schmitz et al. (Reference Schmitz, Moss, Schmitz, Furtan and Schmitz2010), Schmitz, Furtan, and Baylis (Reference Schmitz, Furtan and Baylis2002), van Kooten (Reference van Kooten1990), van Kooten and Taylor (Reference van Kooten and Taylor1989), and Veeman (Reference Veeman1982). Estimating the impact of eliminating a production quota program can be complicated for addictive goods such as tobacco, the use of which has given rise to social, ethical, and medical debates. In addition, as production quotas have been deemed both an asset and a right to produce, the amount of compensation to producers for the loss of a quota program (i.e., a buyout) can be controversial.
Since 2002, there have been at least three major production quota buyouts: two in the United States (the peanut and tobacco quota buyouts) and one in Canada (Ontario Tobacco Transition Program [TTP]). This article updates and extends the literature on production quotas with a heavy emphasis on their termination. Much of the early work in the field focused on the impact of introducing production quotas. We examine cases wherein production quota programs were eliminated and quota owners were compensated for their losses. Specifically, we provide an examination of (1) production quotas in both the absence and presence of international trade, (2) production quota buyouts (three case studies), (3) sources of funding (e.g., general tax revenue or excise tax monies), and (4) general equilibrium considerations. We also briefly discuss externalities, the interpretation of consumer surplus measures, and the nature of conducting economic analyses when addictive goods are involved.
2. Theoretical Framework
The subsequent analysis follows the theoretical welfare economics framework outlined in Currie, Murphy, and Schmitz (Reference Harberger1971) and Just, Hueth, and Schmitz (Reference Just, Hueth and Schmitz2004).
2.1. Production Quotas in the Absence of International Trade
In Figure 1a, demand is D, supply is S, marginal revenue schedule is MR, and marginal cost is MC. The competitive equilibrium price and quantity are given by p and q 2, respectively. However, what if production is restricted through quotas? If producers act as a monopolist, they set the price at p 1 and produce quantity at q 1 (production is restricted in the same manner as under production controls).Footnote 1 The price increase gives rise to a gross quota rent value of (p 1p 2ab). The quota results in a consumer loss of (p 1pcb), whereas, on net, producers gain [(p 1peb) − (eac)]. This net welfare gain to producers is less than the value of the quota (p 1p 2ab). Also, a quota gives rise to a net efficiency loss of (bac). This is often referred to as deadweight loss, or the Harberger triangle (Harberger, Reference Harberger1971, Reference Harberger1978).

Figure 1. The Welfare Economics of Production Quotas
Under a Stigler-type world, producers are able to act as a monopolist by convincing regulators to accept their preferred price and quantity. However, this outcome differs from a Peltzman-type world in which consumers might have some input in regulating the degree of monopoly pricing.Footnote 2
2.2. Production Quotas in the Presence of International Trade
In his early work on the cost of the U.S. tobacco quota program, Johnson (Reference Johnson1965) emphasized the importance of exports in the presence of exporter monopoly power. He concluded that under certain supply and demand elasticities, there can be positive net gains to the United States from the tobacco quota program, especially if exports represent a considerable portion of production. However, although there can be net gains to the United States from the tobacco quota program, the world as a whole loses.
For illustrative purposes, the impact of trade for an export good under a production quota is shown in Figure 1b. Total demand is given by Dt, whereas domestic demand is Dd. The competitive equilibrium price and quantity are p* and q*, and exports total jh. If a production quota is set at q**, the price will rise to p**. As a result of the quota, producers gain [(p**p*ig) − (ifh)]. The loss to consumers in both the exporting and importing countries is (p**p*hg), where domestic consumers lose (p**p*jk) and foreign consumers lose (kjhg).
Vercammen and Schmitz (1992) consider quotas in the context of an import good by analyzing Canadian agricultural supply management in the presence of domestic production controls and import tariffs (two distortions). They show the impact of supply management programs on Canadian producers and consumers given producer maximization of profits subject to tariff-constrained imports; however, they do not analyze the impact of removing production quotas.Footnote 3
In Figure 2 (Vercammen and Schmitz, Reference Vercammen and Schmitz1992), S is the supply curve and D is domestic demand. P 0 is the world free trade price, Q 1 is domestic production under the world free trade price, and imports are (Q 1 – Q 2). If, for example, under supply management, imports are restricted to (Q 2 – Q*), producers will maximize profit by setting the quantity produced at the point where supply and the marginal revenue schedule intersect. As a result, producers gain (P*P 0dc) from production controls. Import producers gain (cdeb), and domestic consumers lose (P*P 0ab).

Figure 2. Maximum Import Concession with Supply Management
Vercammen and Schmitz (Reference Vercammen and Schmitz1992) note that policies including import restrictions are generally more efficient (domestically) than those including import concessions, as deadweight losses can be eliminated in the latter case. Goodloe (Reference Goodloe, Schmitz, Moss, Schmitz and Koo2005) and Furtan, Romain, and Mussell (Reference Furtan, Romain, Mussell, Schmitz, Moss, Schmitz and Koo2005) extend the analysis in the context of the Canadian dairy supply management program and consider both production quotas and import quotas in the presence of export subsidies.
2.3. Production Quotas under Risk
In the literature under the effect of production quotas, there is little discussion of how risk affects the size of the distributional and efficiency effects of quotas. This topic is taken up in Dawson and Madden (Reference Dawson and Madden1996) and Schmitz et al. (Reference Schmitz, Moss, Schmitz, Furtan and Schmitz2010). In the latter study, the authors show that under producer risk aversion, the gains from production quotas could far exceed those derived from a riskless environment (the model is somewhat analogous to the work by Schmitz, Schmitz, and Dumas [Reference Schmitz, Schmitz and Dumas1997], in which they consider both producer price supports and input subsidies). This is often used as an argument by those who support supply management.
2.4. Production Quota Buyouts
When a production quota program is eliminated, the government typically determines (1) whether to compensate (“buyout”) quota owners for the loss of the quota, (2) the amount of the compensation package (or the approach to compensation [Schmitz and Schmitz, Reference Schmitz and Schmitz2011; Schmitz, Haynes, and Schmitz, Reference Schmitz, Haynes and Schmitz2015]), and (3) the source of any potential funding. We focus on two sources of funding for a production quota buyout: revenue raised from general taxation or litigation (within the context of the U.S. peanut buyout and the Ontario tobacco buyout, respectively) and revenue raised from an excise tax (within the context of the U.S. tobacco buyout).
The decision to compensate producers for the loss of a quota program is both complicated and subjective. Depending on the commodity in question, the decision to fund a buyout can be highly controversial. For example, although there was not much of an uproar against the U.S. peanut quota buyout, the decision to buy out U.S. tobacco farmers was highly debated. Pasour (Reference Pasour2005) famously questioned: Did the buyout make sense—legally, economically, or ethically? In fact, he argued that “the fact that tobacco-marketing quotas had economic values does not indicate that their owners had a legally protected property right in them. If tobacco quota owners had no legally protected property rights, there is no economic or legal basis for a buyout” (Pasour, Reference Pasour2005, p. 37). Health advocates (e.g., the American Cancer Society) were also involved in the debates questioning the ethics behind supporting the buyout of an industry that had been linked to health problems and even deaths across the world. This is just one example of the types of considerations that governments have to make when deciding whether to provide funding for the termination of a production quota program. If the benefits of production quotas are capitalized into land values, original owners of land benefit, but not subsequent owners. Removing quotas would incur an economic loss to the latter, which might be one justification for compensation. Subsequently, we provide a theoretical examination of eliminating a production quota program (with and without compensation).
Following the theory (Figure 1a), in the absence of both trade and compensation, the net gain from removing the program is the Harberger triangle (bac). Consumers gain (p 1pcb), and the net impact on producers is [−(p 1peb) + (eac)]. These results are exactly the opposite of implementing the quota program. That is, the net cost of the quota program (i.e., as measured by the size of the Harberger triangle) is exactly equal to the net welfare gain from removing the quota program. Likewise, what the gainers gain from implementing the program is exactly equal to what they lose from removing the program—the same is true for the losers.
In the presence of trade, the result of removing a production quota program is also exactly the opposite. In Figure 1b, as a result of removing the quota, there is a net producer impact of [−(p**p*ig) + (ifh)]. The gain to consumers in both the exporting and importing countries is (p**p*hg), of which domestic consumers gain (p**p*jk) and foreign consumers gain (kjhg).
2.5. Source of Funds for Buyout
The impact of a production quota buyout hinges on the source of the funding. In a partial equilibrium setting, a buyout funded by revenue raised from general taxation compensates producers for the loss of the quota without penalizing consumers (except in their role as taxpayers). In fact, consumers always gain from a buyout in the latter case. Given a buyout funded by an excise tax, however, consumers generally lose. This is the distinction between the two sources of funds. Additionally, we assume that government-funded buyouts can be lump-sum payments (i.e., the government has the money on hand, which it distributes in a onetime payment), whereas excise tax–funded buyouts are broken up into several periods (as the tax money comes in periodically from assessments on consumers). The welfare economic implications of both sources of funding are highlighted below.
2.5.1. General Tax–Funded Buyout
When the quota program is terminated, in the absence of trade, the net impact on producers is [−(p 1peb) + (eac)], as it would have been without compensation (Figure 1a). However, under the value of the quota approach (one method of compensation only), the government pays out (p 1p 2ab), and the net result is a gain of (pp 2ac).Footnote 4 Consumers gain (p 1pcb). In the presence of trade, the result is similar. The impact on producers is [−(p**p*ig) + (ifh)] with the addition of (p**p 0fg), leaving, on net, (p*p 0fh). Consumers gain (p**p*hg), with foreign and domestic consumers gaining (kjhg) and (p**p*jk), respectively. If producers are compensated based on a value greater than the quota, producers gain from the buyout. In this case, producers are overcompensated.
2.5.2. Excise Tax–Funded Buyout
An excise tax–funded buyout is depicted in Figure 1b, where S* is supply and Dt is total demand (some parts of this section have been adapted from Schmitz, Schmitz, and Haynes [Reference Schmitz, Schmitz and Haynes2012] and Schmitz, Haynes, and Schmitz [Reference Schmitz, Haynes and Schmitz2013a, Reference Schmitz, Haynes and Schmitz2013b]). Under a quota arrangement, price is p** and quantity is q**. Under a buyout, if producers are compensated based exactly on a tax equal to the value of the quota (p**p 0fg), there is no change in welfare during the buyout. The tax essentially acts as a replacement to the quota, and producers and consumers are neither better nor worse off. If producers are compensated based on a tax that is greater than the value of the quota, then producers gain from the buyout. In this case, producers are overcompensated.
The main points are that welfare economic outcomes of removing a production quota program are heavily dependent on the (1) magnitude of producer compensation, (2) source of the compensation, and (3) basis for compensation. Typically, government-funded buyouts provide immediate compensation and do not negatively affect consumers, whereas consumer tax-funded buyouts are lengthier, further distort markets, and by nature, negatively affect consumers.
2.6. A General Equilibrium Assessment
Most studies deal only with the impact of quotas on input markets and ignore final demand consideration. This raises many questions. What does the change in the area under the derived demand curve measure? Where does the consumer surplus for final demand products enter these models? How does one account for taxes on final demand products that existed in the presence of quotas?
Consider Figure 3 in which the market for tobacco (Figure 3a) and the market for cigarettes (Figure 3b) are given. The tobacco supply schedule is St, and Dt is the derived demand schedule for tobacco. The competitive price and output are p 0 and q 0, respectively. The corresponding supply and demand schedules for cigarettes are Sc and Dc (Figure 3b). In equilibrium (assuming the absence of tobacco taxes), with no tobacco production quota in place, the cigarette price is p* and the cigarette consumption is q*.

Figure 3. The Link between Tobacco and the Cigarette Markets
Now consider the effect of a production quota q 1 being implemented. In Figure 3a, the quota value is (p 1p 2ca), the price of tobacco rises to p 1, and producers gain [(p 1p 0da) − (dcb)]. A production quota of q 1 (Figure 3a), ceteris paribus, causes a shift in the supply curve of cigarettes to S'c (Figure 3b), an increase in the price of cigarettes to a', and a decrease in consumption to qe. Consumers lose (a'p*b'c') as a result.
The net impact of the quota on producers is clear, as Dt is the derived demand curve for tobacco. However, to determine the consumer impact requires knowledge about the demand for cigarettes DC. The consumer surplus change (p 1p 0ba), as measured in the cigarette market, does not equal the surplus change in the tobacco market (a'p*b'c'). The same arguments mentioned prevously apply to the removal of the tobacco quota. A tobacco tax, used to compensate producers, levied on tobacco processors of (jperk) results in a consumer loss of (ja'c'k), as measured in the cigarette market. This does not equal the surplus loss of (p 3p 1ao) in the tobacco market.
3. Three Historic Production Quota Buyouts
The following three sections provide examinations of three historic buyouts, based on the above-mentioned theory. We highlight the impact of the U.S. peanut production quota buyout, the Ontario TTP, and the U.S. tobacco production quota buyout.
3.1. The Buyout of the U.S. Peanut Production Quota Program
The U.S. peanut marketing quota program (like the tobacco quota program) was established in the early 1930s in response to the Great Depression. The intention of the program was to stabilize and increase producer incomes through the use of both production controls (a marketing quota) and price supports (Rucker and Thurman, Reference Rucker and Thurman1990; Rucker, Thurman, and Borges, Reference Rucker, Thurman, Borges, Schmitz, Coffin and Rosaasen1996; Schmitz and Schmitz, Reference Schmitz and Schmitz2010). Specifically, although the quota limited the amount of peanuts that could be sold domestically in the food-use market, peanuts that were produced in excess of the quota had to be exported or sold as oil or meal (Dohlman et al., 2004).
In part, because of both the North American Free Trade Agreement and the Uruguay Round World Trade Organization negotiations in the late 1990s and early 2000s (wherein increasingly cheaper imports threatened the domestic market), U.S. peanut growers faced increasing competition from abroad (Dohlman et al., 2004). Figure 4 depicts both falling prices and production of peanuts in the United States from 1989 to 2002.

Figure 4. U.S. Peanut Poundage and Prices (source: Schmitz and Schmitz, Reference Schmitz and Schmitz2010)
In light of increasing competition, among other reasons, the peanut program was eliminated at the beginning of the 2002 crop year. Under the buyout, peanut farmers and quota holders who rented quota to farmers were compensated at the annual rate of $0.11/lb. Payment was made under the total poundage of 2.4 billion. Compensation was paid over a 5-year period, in which quota holders received $0.55/lb. (Schmitz and Schmitz, Reference Schmitz and Schmitz2010).
Schmitz and Schmitz (Reference Schmitz and Schmitz2010) estimated both the effects of the peanut program and its removal. Their results on the cost of the program are very similar to Rucker and Thurman (Reference Rucker and Thurman1990) even though Schmitz and Schmitz (Reference Schmitz and Schmitz2010) did not take into account the fact that domestic peanut producers had the option of producing above the quota limit (to sell in the world market). For example, both studies estimate the net cost of the program to be in the neighborhood of $30 million per year.
In the Schmitz and Schmitz (Reference Schmitz and Schmitz2010) analysis of the quota buyout, the authors discuss producer compensation under both the “gains from the quota approach” and the “value of the quota approach.” Although various forms of compensation were available, the U.S. government chose to pay producers based on an estimate of the value of the peanut quota. However, although the form of compensation does not affect net efficiency gains, it does affect the distribution of gains (Figure 1a). Under the value of the quota approach, in which the government pays producers (p 1p 2ab), the net efficiency gain is the Harberger triangle (abc). This is also the efficiency result if the government pays the producers compensation based on [(p 1peb) – (eac)]—the gains from the quota approach (Figure 1a).
Empirically, under the value of the quota approach, the net benefit from the removal of the U.S. peanut quota was $25 million (ed = –0.58) and $41 million (ed = –1.19) (Table 1), where ed is the price elasticity of demand (Schmitz and Schmitz, Reference Schmitz and Schmitz2010). Depending on price elasticities of demand, the consumer gain from the buyout ranges between $194 million and $236 million, and the producer gain ranges between $53 million and $111 million. The government cost is $264 million, and the net gain to society (Harberger triangle) ranges between $25 million and $41 million (also dependent on demand elasticities).Footnote 5
Table 1. Terminating the U.S. Peanut Production Program

a ed and es are price elasticities of demand and supply, respectively.
Source: Schmitz and Schmitz (Reference Schmitz and Schmitz2010).
3.2. Ontario Tobacco Buyout
Ontario tobacco producers (along with tobacco-processing companies) established the Ontario Flue-Cured Tobacco Marketing Association (OFCTMA) in 1936 (Ramsey et al., Reference Ramsey, Stewart, Troughton and Smit2003). Similar to the United States, the Great Depression had ravaged the Canadian agricultural industry, and the OFCTMA was put in place to control prices and conditions of sale. It was not until 1957, however, that a true supply management program was established under the Ontario Flue-Cured Tobacco Growers’ Marketing Board (OFCTGMB) (for details on the function of the OFCTGMB, see Elgin County, Reference Schmitz, Haynes, Schmitz and Schmitz2013; Schmitz et al., Reference Schmitz, Haynes and Schmitz2015; Schmitz, Haynes, and Schmitz, Reference Schmitz, Haynes and Schmitz2015).
What made the Ontario tobacco program unique was that it was based on a two-quota system. The OFCTGMB used a total marketing quota (TMQ) in addition to the basic production quota (BPQ). Whereas the BPQ set production levels, the TMQ regulated the amount of tobacco that could be sold at auction (OFCTGMB, 2008). Production levels were pegged to the TMQ, so although producers could have chosen to produce at the BPQ, in the presence of falling demand, for example, they only produced at the TMQ—thus making the TMQ the binding quota. Importantly, even though production declined (along with the TMQ) from a peak of 238 million pounds in 1974 to an all-time low of 22 million pounds in 2009 (Figure 5), the BPQ remained at roughly 271 million pounds over the same time period (OFCTGMB, 2009).Footnote 6

Figure 5. Ontario Marketed Flue-Cured Production and Prices, 1957–2012 (source: Schmitz, Haynes, and Schmitz, Reference Schmitz, Haynes and Schmitz2015)
Given the previous description of the two-quota system, one might ask, what is the relevance of the BPQ? The BPQ was an asset and symbolized the right to produce tobacco—it had value in and of itself. In this context, a government buyout would literally buy the producers’ right to produce tobacco. For this reason, and fortunately for producers, the BPQ as opposed to the TMQ would be the basis of compensation given the termination of the quota program.
The above-mentioned declining tobacco market was a result of several factors, including an increase in contraband tobacco, decreasing exports, and falling domestic consumption of tobacco products (Physicians for a Smoke-Free Canada, 2008). As an example, Figure 6 depicts declining cigarette sales in Canada from a peak in 1981 of more than 65 billion cigarettes to an all-time low of 29 billion cigarettes in 2008. The jump in sales in 1994 is attributable to both the federal and provincial governments cutting taxes in half to combat increasing smuggling of contraband tobacco (Hamilton et al., Reference Hamilton, Levinton, St-Pierre and Grimard1997).

Figure 6. Cigarettes Sales in Canada, 1980–2011 (source: Health Canada, 2012)
Because of declining tobacco producer incomes, the OFCTGMB pushed for the government to end the production quota system via a buyout. The Canadian government unrolled the TTP in 2009 with three specific goals: (1) eliminate the tobacco quota program, (2) assist tobacco producers in exiting the industry via a compensation package (buyout), and (3) improve the viability of remaining and future producers who will produce tobacco under a new licensing system. As per the federal contract, all producers who chose to accept the buyout agreed to forfeit the right to produce tobacco. Those producers who refused to accept the buyout would have to convert from the quota-based system to a license-based system. Under the new license-based system, production would still be controlled. Only if a producer had a contract with a buyer for a specified amount of tobacco could he produce tobacco (up to, but not exceeding, the contracted amount).
Participation in the program was not mandatory; however, 99.5% of Ontario tobacco quota holders accepted both the compensation and the terms of the agreement, vowing to leave the industry (OFCTGMB, 2009). According to Daniszewski (2010), the $251 million compensation package averaged approximately $242,000 per grower.Footnote 7 Even though tobacco producers agreed to the terms in the TTP, they were able to find loopholes in the legislation, which allowed them to continue producing tobacco. Licenses were given to nonfarmers, who provided legal cover to producers, so that they could continue farming, even after receiving buyout funds (Daniszewski, 2010). Furthermore, the 2011 report of the auditor general (Office of the Auditor General of Canada, 2011) detailed flaws in the legislation, noting that it was hastily formulated, inadvertently allowing for business arrangements to be made that could undermine the intent of the program. In this context, not only did farmers continue producing tobacco in 2010, but they more than doubled the 2009 production levels.
We now depict a government-funded buyout in Figure 7, wherein S is the supply of tobacco, DT is total demand for tobacco, and DD is domestic demand. The binding TMQ is Q 1 [the value of this quota is (P 1P 2ca)], and the BPQ, which producers legally had the right to produce, is Q 3 [the value of this quota is (P 1P 2wn)].Footnote 8 The producer supply price is P 2 (they receive P 1), and the price faced by cigarette-manufacturing companies (CMCs) is P 1. A buyout based on the TMQ, in the absence of compensation, yields a producer impact of [(dcb) − (P 1P 0da)]. Given a buyout based on the inflated quota, the net impact on producers is {[(dcb) − (P 1P 0da)] + (P 1P 2wn)}.

Figure 7. Theoretical Ontario Tobacco Buyout Including Trade
From Table 2, if producers were compensated based on the TMQ, they would have gained approximately $7.7 million. This is a drastic difference compared with a $252 million buyout based on the inflated BPQ. Results from this section are from Haynes, Schmitz, and Schmitz (Reference Haynes, Schmitz and Schmitz2015a).
Table 2. Economic Impact of the Ontario Tobacco Buyout: Increasing Production Model (million U.S. dollars)a
a Based on a total demand elasticity of –1.5, a domestic demand elasticity of –1.2, and a supply elasticity of 1.8.
b The reported producer gain is greater than the actual payout because of the use of a relatively elastic total demand. In this case, in the absence of the quota, P 1P 0da < dcb. Adding this gain to the compensation yields an amount of $254.0 million.
Note: BPQ, basic production quota; TMQ, total marketing quota.
Sources: Schmitz et al. (Reference Schmitz, Haynes and Schmitz2015) and Schmitz, Haynes, and Schmitz (Reference Schmitz, Haynes and Schmitz2015).
The 2009 TTP provides an interesting example of policy failure where adherence to a zero-production mandate (as proposed in the original legislation) would have generated substantial net welfare losses (Haynes, Schmitz, and Schmitz, Reference Schmitz, Haynes and Schmitz2015a). An informative way to view this case is to compare the potential impact of the proposed TTP (i.e., zero-production mandate followed) against the impact of the TTP where the zero-production mandate was ignored. The welfare impacts from the zero-production model are far outweighed by those of the nonzero-production case.Footnote 9 This is understandably so given the theoretical structure in Figure 8a where the supply and demand schedules are S and D, respectively, and the tobacco quota is given by Q 0. In the corresponding cigarette market (Figure 8b), the cigarette price is p 0, and q 0 cigarettes are produced given demand DC. The marginal cost of producing cigarettes under the quota is MC. Under a zero-production model, the producers lose (P 1kca), which is at least partly offset by the government buyout money (Figure 8a). In the cigarette market, consumers lose (gp 0j) and CMCs lose (p 0tj) (Figure 8b). The net welfare impact is − [(P 1kca) + (gp 0j) + (p 0tj)]. Under the case in which producers ignore the zero-production mandate, producers lose [−(P 1P 0da) + (dcb)] but gain the buyout money. Unlike in the earlier model, tobacco consumers gain (p 0p 1hj), and likewise processors gain [(p 1fh) − (p 0tj)].

Figure 8. Theoretical Ontario Buyout: Dual Markets Excluding Trade
The above-mentioned impacts show that if the zero-production mandate had been followed, there would have been large welfare losses. Specifically, tax revenue losses, end-consumer losses, and domestic CMC losses would have far outweighed any gains in health care savings. On the contrary, the ex post analysis in Haynes, Schmitz, and Schmitz (Reference Schmitz, Haynes, Schmitz and Schmitz2015a) shows that positive welfare impacts from terminating the tobacco program are possible, even in the presence of increased tobacco production. In our ex post assessment, a key driver in both the theoretical and empirical sections is that tobacco production increased as a result of the production quota buyout. In this case, tax revenue, domestic CMC surplus, and consumer surplus gains outweigh the health care costs associated with a potential increase in cigarette consumption, ceteris paribus.
3.3. U.S. Tobacco Buyout: Benefit-Cost Analysis and Distributional Considerations
The U.S. tobacco program was instituted in 1938 to improve the income of tobacco producers. The main features were the use of production quotas and price supports. The former restricted tobacco production below competitive levels, and the latter ensured a minimum price for farmers. Alston (Reference Alston1981) argued that because quotas were not transferable, they induced supply shifts that in-turn created social costs. Johnson (Reference Johnson1965) and Sumner (Reference Sumner, Schmitz, Coffin and Rosaasen1996) argued that this benefited tobacco producers and landowners (collectively quota owners) by artificially raising the price of tobacco. Sumner (Reference Sumner, Schmitz, Coffin and Rosaasen1996) discussed how the quota program successfully allowed U.S. quota owners to exercise market power domestically and abroad by extracting cartel monopoly rents from both domestic and foreign consumers.
Rucker, Thurman, and Sumner (Reference Rucker, Thurman and Sumner1995) note that tobacco quota transfer was permitted within the same county but not between counties. In their seminal piece, the authors analyzed the impact of tobacco quota restrictions on producer and quota owner incomes, noting that although deadweight costs were minimal, effects on distribution were significant. Pasour (Reference Pasour2005, p. 35) outlined key details of the tobacco production quota program: “The market for the ‘right’ to produce and sell tobacco was tightly controlled. Tobacco had to be grown in the county to which the quota was assigned. If a farmer wished to grow tobacco but did not own a quota, he had to purchase or lease the quota from someone who did. If renting a quota from someone else, he had to produce tobacco on the farm to which the quota was attached—a quota could not be leased or sold across county or state lines.”
Similar to the Ontario case, declining demand for tobacco products over time (Figure 9) because of various reasons, including increasing cigarette taxes, rising consumer awareness of the dangers of smoking, and smoking bans, resulted in falling tobacco production (Figure 10) after the early 1960s.Footnote 10

Figure 9. U.S. Cigarette Sales, 1900–2012 (adult smoking prevalence refers to the percentage of American smokers over the age of 18; source: Cole and Fiore, Reference Cole and Fiore2014)

Figure 10. U.S. Tobacco Production, 1940–2014
After years of debate and negotiation, the U.S. government terminated the tobacco quota program in 2004 (for detailed descriptions of the U.S. tobacco quota program buyout, see Dohlman, Foreman, and Da Pra, Reference Dohlman, Foreman and Da Pra2009; Schmitz, Haynes, and Schmitz, Reference Schmitz, Haynes and Schmitz2013a; Serletis and Fetzer, 2008; Womach, Reference Womach2005). Generally, legislators from the U.S. tobacco states supported the termination of the tobacco program only if the tobacco quota owners were to be compensated. Tobacco quota owners were all landowners with the distinction being that only some of them produced tobacco whereas others did not (Womach, Reference Womach2005). Brown (2013) estimated that before the buyout, there were more than 38,000 individual flue-cured tobacco quotas (two-thirds were owned by nonproducers) and more than 240,000 individual burley tobacco quotas (at least two-thirds were owned by nonproducers). Collectively, there were roughly 416,000 tobacco quota owners, of which 14% were producers and 86% were landowners (Womach, Reference Womach2005). The final legislation provided all quota owners $7/lb. on the 2002 basic quota; the producers were compensated an additional $3/lb. on the 2002 effective quota. The source of compensation was tax revenue (gained from assessments on tobacco processors and importers) and was made in 10 equal annual installments of $0.70/lb. and $0.30/lb., totaling $9.6 billion over the 10-year compensation period (Womach, Reference Womach2005). Given that the quota rental rate was approximately $0.60/lb. per year, during the time of the buyout, and could arguably be viewed as the value of the quota, it appears that producers were overcompensated upward of $0.40/lb. per year, for the loss of the quota. (Leerberg [Reference Leerberg2006] argued, however, that quota owners were, in fact, undercompensated for the loss of the quota program and that payments should have been $1.26/lb. per year.) We account for this use of an inflated quota as the basis of compensation subsequently.Footnote 11
3.3.1. Consumer Tax Model
A model of the U.S. tobacco buyout paid for by a consumer tax is given in Figure 11 (Schmitz et al., 2013). We recognize that the buyout was paid for by a tax on tobacco processors and discuss this later. In Figure 11, S is the supply schedule for tobacco, DD is the domestic demand schedule, and DT is the total demand schedule.Footnote 12 Competitive equilibrium would result in a price p 0 and quantity q 0. However, prior to the buyout, the U.S. tobacco program imposed a production quota q 1, which caused the price to increase to p 1, resulting in a loss in domestic input surplus (p 1p 0ir) and a loss in foreign input surplus (riba) when compared with competitive equilibrium.Footnote 13 Hence, domestic and foreign consumers lose (p 1p 0ba) in total each year under the U.S. tobacco program. However, producers gain [(p 1p 0da) − (dcb)] in producer surplus and receive the true value of the quota from the market (p 1p 2ca) each year. The deadweight loss created by the quota is (acb).
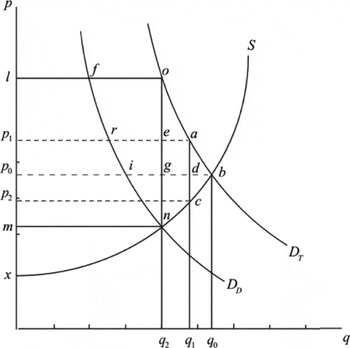
Figure 11. Implementation and Removal of the U.S. Tobacco Production Quota (source: authors)
Under a buyout where an inflated quota value (i.e., lmno) that is in excess of the true quota value (p 1p 2ca) is used as the basis for compensation, q 2 is tobacco production. There is a net producer gain of [(lp 1eo) − (enca)]. Additionally, there is an increase in the loss in economic efficiency (onca). The extent to which compensation is based on an inflated quota value depends on the rent-seeking strength of the growers.
3.3.2. Processor Tax Model
Womach (Reference Womach2005) noted that the cost of the buyout would be roughly $0.05/pack of cigarettes (approximately one billion dollars a year). This tax could have significantly increased the cost of production to CMCs and could have reduced CMC demand for tobacco substantially over the 10-year buyout period. If, in fact, CMCs passed the cost on to end consumers, the declining demand for cigarettes might not necessarily be accelerated by a $0.05/pack increase. In the event that the tax on processors was not passed on in terms of higher cigarette prices (no one knows the extent to which it was), then the model becomes much simpler than given in Figure 11. From the general equilibrium model (Figure 3a), given a buyout under the noninflated case, producers gain (p 0p 2cb), and processors lose [(p 1p 0ba) − (p 1p 2ca)] = [(adb) − (p 0p 2cd)]. Under the inflated quota case, producers gain {(p 5p 1av) + [(dcb) − (p 1p 0da)]}, whereas processors lose [(p 1p 0ba) − (p 5p 2cv)]. In this case, (p 5p 2cv) represents the processor (excise) tax used to finance the buyout.
Figure 10 shows that U.S. tobacco production dropped sharply in the decade prior to 2004. After the 2004 buyout, the harvested acreage of burley leaf and flue-cured tobacco decreased by 30% and 25%, respectively (Dohlman, Foreman, and Da Pra, Reference Dohlman, Foreman and Da Pra2009). Brown, Rucker, and Thurman (Reference Brown, Rucker and Thurman2007) analyzed the distortionary effects of U.S. tobacco production quotas and predicted that in the medium run, tobacco production would increase. Although not a major recovery by any means, aside from brief dips in 2005 and 2007 (Figure 10), it seems as though tobacco production has leveled out and that the buyout has arrested a dying industry.
Kirwan, Uchida, and White (Reference Kirwan, Uchida and White2012) analyzed the efficiency of agricultural production as a result of the U.S. tobacco buyout, taking into account the decrease in production because of the buyout. They contend that because of many factors, including an increase in farm size, and the elimination of restrictions on the transfer of quota as examples, U.S. tobacco production became much more efficient. An interesting question that remains unanswered is whether any part of the structural change in tobacco farming was because of the monies that producers and landowners received from the buyout. Specifically, would this structural change have materialized absent producer compensation?
Schmitz, Haynes, and Schmitz (Reference Schmitz, Haynes and Schmitz2013a) analyzed the effects of the U.S. tobacco buyout within the context of the above-mentioned consumer tax theory. From Table 3, there is a calculated yearly benefit (gain in producer surplus) of $202 million and a yearly cost (loss in consumer surplus) of $293 million, with domestic and foreign consumers losing $162 million and $130 million, respectively. There is a domestic efficiency gain of $40 million; however, including foreign impacts results in a total efficiency loss of $91 million. (Schmitz, Haynes, and Lakkakula [Reference Schmitz, Haynes and Schmitz2015] extend this work to examine the impact of the U.S. tobacco buyout within a multiperiod welfare economic context using both present and future value calculations.)
Table 3. Yearly Economic Impact of the U.S. Tobacco Buyout

Source: Schmitz, Haynes, and Schmitz (Reference Schmitz, Haynes and Schmitz2013a).
a Based on tobacco price elasticities of supply and demand of es = 0.7, ed = −1.1, respectively.
Whereas previous empirical work (e.g., Schmitz, Haynes, and Schmitz, Reference Schmitz, Haynes and Schmitz2013a) focused only on a consumer tax-funded buyout, we presently consider the CMC processor tax. Without producer compensation, producers lose $413 million per year from the termination of the quota program, and CMCs gain $454 million per year (Table 4). If producers are compensated from a tax based on the value of the quota at the time of the buyout, they gain $142 million per year, whereas CMCs lose $102 million per year. Lastly, if producers are overcompensated from a tax based on an inflated quota value, on net, they gain $547 million per year from the removal of the quota, and CMCs lose $507 million per year.
Table 4. Yearly Impact of the U.S. Tobacco Buyout (under a processor tax)

a Based on tobacco price elasticities of supply and demand of es = 1.95, ed = −0.65, respectively.
Note: CMC, cigarette-manufacturing company.
Source: Authors’ calculations.
We further the previous analysis by incorporating the use of benefit-cost ratios (BCRs) based on the model in Figure 11. Without including foreign consumers, the BCR associated with the buyout is
 $$\begin{equation}
BCR_d^I = \frac{{\Delta PS}}{{\Delta C{S_d}}} = \frac{{l{p_1}eo - enca}}{{l{p_1}rf}},
\end{equation}$$
$$\begin{equation}
BCR_d^I = \frac{{\Delta PS}}{{\Delta C{S_d}}} = \frac{{l{p_1}eo - enca}}{{l{p_1}rf}},
\end{equation}$$where ΔPS is the change in producer surplus and ΔCSd is the change in domestic consumer surplus. When the scope of the analysis includes the global cost associated with the buyout, the BCR (BCRI d + f) is
 $$\begin{equation}
BCR_{d + f}^I = \frac{{\Delta PS}}{{\Delta C{S_d} + \Delta C{S_f}}} = \frac{{l{p_1}eo - enca}}{{l{p_1}rf + frao}},
\end{equation}$$
$$\begin{equation}
BCR_{d + f}^I = \frac{{\Delta PS}}{{\Delta C{S_d} + \Delta C{S_f}}} = \frac{{l{p_1}eo - enca}}{{l{p_1}rf + frao}},
\end{equation}$$where ΔCSf is the change in foreign consumer surplus.
Empirically, from the consumer tax model, the BCRs for equations (1) and (2) are 1.3 and 0.7, respectively. Including the impact of the consumer tax on both domestic and foreign consumer decreases the BCR substantially. From the processor tax model, the BCRs for equations (1) and (2) are 2.0 and 1.1, respectively.
3.3.3. Distributional Considerations
A limitation of the above-mentioned work (Haynes, Schmitz, and Schmitz, Reference Haynes, Schmitz and Schmitz2014; Schmitz, Haynes, and Schmitz, Reference Schmitz, Haynes and Schmitz2013a) on the impact of the U.S. tobacco buyout is that it provides little information on the impact of the distribution of rents among quota owners of tobacco of the buyout. Unfortunately, this is true for the assessment of many such projects (Schmitz and Zerbe, Reference Schmitz and Zerbe2008). Subsequently, we address this deficiency by focusing on a detailed examination of the impact of the buyout on the distribution of rents among quota owners.
We estimate for the U.S. tobacco quota buyout: (1) the prebuyout quota owner surplus, (2) the distribution of gross and net quota owner benefits, (3) the overcompensation to quota owners, and (4) the distribution of the total benefits among the largest producers.
The removal of the tobacco quota and the implementation of an inflated processor tax (to pay for quota owner compensation) resulted in a compensation package greater than the true quota value. Given that all quota owners were landowners by definition, we divide them into two groups of landowners: those who produced tobacco (producers), and those who did not produce tobacco (nonproducers).Footnote 14 Nonproducers and producers owned 40% and 60% of the tobacco land, respectively, and 40% of the production quota was owned by nonproducers and the remaining 60% was owned by producers. Capehart (Reference Capehart2004) estimated that at least 62% of the tobacco land farmed was owned by producers. We refer to the “largest producers” as those farming tobacco on 25 acres or more of land. This group (4,022 out of 56,977 tobacco-producing farms) represented roughly 7% of all farms and 58% of all tobacco produced in 2002.
Yearly estimates of the prebuyout quota owner distribution of the total surplus are given in Table 5.Footnote 15 The total quota owner surplus before the buyout was $816 million, of which nonproducers and producers received $326 million and $489 million, respectively, per year. The largest producers received $284 million of the $489 million. The aggregate value of tobacco quota in 2004 was $556 million, of which $333 million was received by producers, with the largest receiving $193 million. The remaining $222 million went to nonproducers.
Although the previous results fall under the case in which there are transfer restrictions on quotas, the implications for the distribution of benefits among quota owners are in line with Dawson (Reference Dawson1991) in that the larger relatively wealthy producers gain the most.
Table 5. Prebuyout Distribution of Total Quota Owner Surplus (million U.S. dollars)a

a It is assumed that all “quota owners” (i.e., the collective form of “landowners” and “producers”) own land; however, landowners do not produce tobacco. This table represents the case in which producers had a 60% majority in quota and land allocation.
b The area is given in Figure 11.
c Based on tobacco price elasticities of supply and demand of es = 1.95, ed = −0.65, respectively.
d Quota value based on 2004 tobacco production and a per unit quota of $0.63/lb.
Source: Haynes, Schmitz, and Schmitz (Reference Schmitz, Haynes and Schmitz2015b).
Table 6 presents the yearly postbuyout surplus, and distribution of gross and net benefits. The total quota owner surplus is $1.2 billion. The net gain in quota owner surplus is $406 million. The gross quota owner compensation is $962 million per year (Womach, Reference Womach2005). The return to land only (specifically, the amount of the buyout that was based on the $0.70/lb. and an effective quota level of 959 million pounds) was $671 million per year, or 70% of the total buyout. Nonproducers received $269 million and producers received $403 million of the return to land, with the largest producers receiving $234 million (this represents roughly 35% of the entire payout to land). In policy discussions, the general conclusion reached is that the benefits from government programs, such as deficiency payments, get capitalized into land values. However, the impact of production quotas on land values is unclear and in need of further study.
Table 6. Postquota Elimination Total Quota Owner Surplus, Quota Owner Net Gain, and Distribution of Buyout Compensation (million U.S. dollars, yearly)a

a It is assumed that all “quota owners” (i.e., the collective form of “landowners” and “producers”) own land; however, landowners do not produce tobacco. This table represents the case in which producers had a 60% majority in quota and land allocation. Additionally, BQL and EQL are the basic quota level and effective quota level for the year 2002, respectively.
b The area is given in Figure 11.
c Based on tobacco price elasticities of supply and demand of es = 1.95, ed = −0.65, respectively.
Source: Haynes, Schmitz, and Schmitz (Reference Schmitz, Haynes and Schmitz2015b).
In addition to the initial payout based on the 2002 basic quota and $0.70/lb., producers received $0.30/lb. on the 2002 effective quota or $291 million, of which the largest producers received $169 million. The aggregate gross producer compensation was $694 million per year, of which the largest producers received $402 million.
Given the aggregate quota value in 2004 of $556 million (Table 5) and the total quota owner compensation of $962 million (Table 6), quota owners were overcompensated by $407 million per year, of which producers gained $293 million (or 72%, with the largest producers gaining $170 million), whereas nonproducers gained $114 million. Finally, considering that the gross return to land was roughly 70% of the total quota owner compensation, the net return to land was $171 million (Table 6).
4. Additional Considerations
Welfare economic analysis of supply management programs usually does not take into account externalities. For example, if a tobacco buyout causes an in-crease in production, and a decrease in prices for tobacco, ceteris paribus, an increase in smoking could affect health care costs in the long run. We also note that the opposite is possible. For example, if an increase in smoking leads to premature deaths for smokers (with associated economic losses), a number of health care costs associated with aging will be averted. Gruber and Kӧszegi (Reference Gruber and Köszegi2001) weigh both the economic losses (i.e., internalities) and added health care costs because of smoking (i.e., externalities) and find the former to be much more substantial. Future work should specifically address this point.
Another commonly forgotten negative externality associated with tobacco use is tobacco product litter. Schultz et al. (Reference Schultz, Large, Tabanico, Bruni and Bator2009) conducted one of the largest national litter studies ever conducted in the United States and found that the most frequently littered items were cigarette butts. According to the study, these small items amount to an estimated $11.5 billion in annual cleanup costs. In terms of evaluating policies/programs that affect tobacco product use, if cleanup costs are not taken into consideration, the BCRs associated with quota buyouts can be grossly underestimated (Haynes, Schmitz, and Schmitz, Reference Haynes, Schmitz and Schmitz2014).
A consideration that is often overlooked when conducting welfare economic analysis of government programs is the interpretation of consumer surplus—especially when the product being consumed is an addictive good (i.e., tobacco). As such, it would be useful to formally integrate the work on addiction by Weimer, Vining, and Thomas (2009) into benefit-cost analysis (BCA) (the authors argue that only 75% of the consumer loss from higher cigarette prices should be counted as a social cost). In addition, there is little agreement as to whether consumer surplus is an accurate measure of consumer utility from smoking. An article in the New York Times on health gains versus pleasure lost (Tavernise, Reference Tavernise2014) highlighted the concern over the interpretation of consumer surplus in economic analyses, particularly as used in BCA. A main point of concern was the potential for the analysis used by the U.S. Food and Drug Administration (FDA) to make it difficult to regulate tobacco products and to be inappropriately used as a benchmark for other industries. BCA that places an unrealistically heavy weight on consumer happiness rather than on consumer health would inhibit the main mission of the FDA (to protect public health). Generally, programs that would yield significant benefits in health care (and subsequently health care savings) would not be adopted if they were deemed to also decrease consumer happiness.
Traditionally, the view exists that higher taxes cause a decrease in demand and thereby cause a decrease in consumer surplus. If consumer surplus is a measure for consumer satisfaction, its interpretation becomes rather vague when considering a product like cigarettes. Specifically, considering the harmful nature of cigarettes, it is not unreasonable to conjecture that consumers are better off given higher taxes. Gruber (Reference Gruber2002, p. 55) proposes an alternate economic model wherein despite losses in economic surplus, consumers are actually better off because of their reduced consumption of cigarettes: “Under the traditional formulation, higher taxes on cigarettes make smokers worse off; the government is constraining their choice of an activity that they are pursuing rationally. But, under the alternative formulation, higher taxes on cigarettes make smokers better off; the government is helping them achieve the self-control that they cannot achieve through the private market.” Thus, when conducting BCA, the manner in which consumer losses are calculated and incorporated can have considerable impacts on the estimated BCR. Similarly, the inclusion of health care costs (savings) can also drastically change estimated BCRs (Schmitz et al., Reference Schmitz, Haynes, Schmitz and Schmitz2013). BCRs can vary by a factor of 17, depending on the magnitude of the consumer surplus and associated health costs (A. Schmitz, D.J. Haynes, and T.G. Schmitz, unpublished).
5. Conclusions
Production quotas have been around for quite some time. Although some have been eliminated, including the U.S. tobacco and peanut production quota programs, the Canadian tobacco production quota program, and, more recently, European dairy quotas, some programs are still in existence (e.g., the Canadian supply management system) that are being challenged. Like most production quota buyouts, the amount of producer compensation needed to eliminate the Canadian dairy supply management system could be sizable. The amount of producer compensation is partially determined by the strength of the producer lobbying group and is therefore difficult to justify economically. For example, according to Grant et al. (Reference Grant, Barichello, Liew and Gill2014), Canadian dairy producer compensation from a buyout can range between $3.6 billion and $40 billion if the basis for compensation is quota book value rather than quota market value. The Conference Board of Canada pegs the market value of the dairy quota at $23 billion, and the quota for chickens, turkeys, and eggs is worth another $7 billion. In this regard, we found that producers of the commodities surveyed were overcompensated in that they were paid in excess of the true quota value. Furthermore, payments to producers in general exceed the loss in producer surplus associated with quota removal.
The literature distinguishes between distributional and efficiency effects from a program change. As the studies reviewed show, programs can have large distributional effects accompanied by relatively small net efficiency impacts.
A difficult aspect of performing an economic assessment of a program change is to account for general equilibrium effects (Just, Hueth, and Schmitz, Reference Just, Hueth and Schmitz2004). Our work (and that of others) has been partial in nature. This analysis should be extended to include general equilibrium considerations to determine the extent to which partial analysis may lead to biased results. A general equilibrium analysis should include at least risk and final demand considerations within the context of international trade. The net impact of removing a tobacco production quota depends critically on the degree to which negative externalities are associated with production. Examples of these include tobacco addiction, the health care costs associated with smoking, and the reduction of tobacco-related litter.


 Open access