


INTRODUCTION
Q fever is a zoonosis caused by the bacterium Coxiella burnetii. The bacterium is found in the milk, urine, faeces and wool of infected animals (particularly sheep, goats and cattle) but birth products are known to be highly contagious [Reference Abinanti1–Reference Porten3]. It is hypothesized that human infection occurs through inhalation of contaminated aerosols [Reference Maurin and Raoult4]. Since 2007, over 3000 cases have been reported in The Netherlands (2354 cases in 2009 alone), peaking annually in spring–early summer. Commercial dairy-goat farms and some dairy-sheep farms have been implicated in the spread of disease. Control measures in 2008 and 2009 were centred on these farms, as the risk associated with non-milk-producing farms was thought to be low [5].
Limited data are available in relation to what other agricultural sectors might have contributed to the spread of disease.
In 2009, the municipal health service in the southeast region of Brabant province (MHS Brabant Southeast) received over 400 notifications of Q fever of which 379 were laboratory-confirmed cases (Fig. 1). The majority of these cases were probably explained by residence near an infected dairy-goat farm located northeast of Helmond city [Reference Schimmer6]. Following a trawling questionnaire conducted with 343 confirmed cases, a second cluster, possibly associated with a non-dairy sheep farm, was identified in the region. Forty-six cases spontaneously indicated in an open-text question that they had visited the sheep farm (farm X) during the lambing season in February–March 2009. In the trawling questionnaires other veterinary sources were listed, such as a visit to a pet goat farm and a zoo, but these locations were common for only two and three cases, respectively.
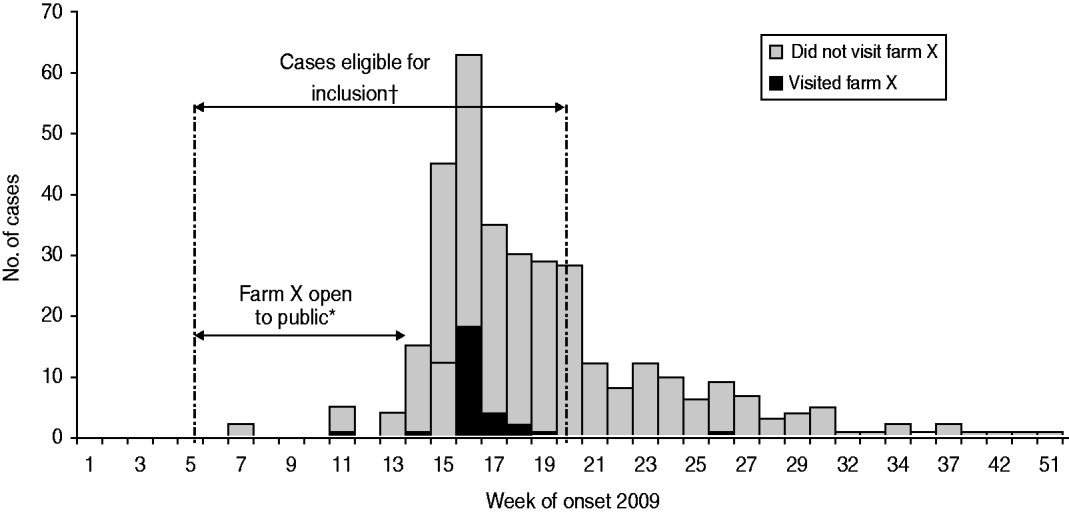
Fig. 1. Q fever cases by week of onset of symptoms and visits to farm X. Brabant Southeast, The Netherlands, 2009. * Farm X was open on weekends only from 1 February (week 5) to 31 March (week 14). † 246 cases had a date of onset of illness between 1 February 2009 and 15 May 2009 and were eligible for inclusion in the study.
Farm X has been open to the public during the lambing season since 2004. In 2009, it was open each Saturday from 1 February until 31 March and there were an estimated 12 000 visitors to the farm, most of whom lived locally within 25 km of the farm. More than 1200 lambs were born that season (the majority in January and February), and visitors could occasionally witness the birth of a lamb and were encouraged to watch the lambs play. Only three abortions were reported on the farm during this season, which is less than might be expected in a typical season, unaffected by Q fever.
The aim of this study was to test whether there was an association between visiting farm X and developing Q fever in residents of Southeast Brabant in February–May 2009. A secondary objective was to identify risk factors for acquiring Q fever (or a C. burnetii infection) in people who visited the farm.
METHODS
Epidemiological investigation
Southeast Brabant is predominantly an agricultural region in the south of The Netherlands bordering Belgium. A case-control study was conducted in the region in June 2010. All adults aged ⩾18 years who were normally resident in Southeast Brabant between 1 February and 31 of March 2009 were eligible for inclusion (n=732 731). The exposure of interest was a visit to farm X between 1 February (end of week 5) and 31 March (beginning week 14) in 2009 (the period when the farm was open to the public). Given a minimum incubation period of 3 days and a maximum incubation period of about 6 weeks [Reference Maurin and Raoult4, Reference Heymann7], cases were defined as adult inhabitants of the region who were notified with Q fever and for whom illness onset was between 1 February (end of week 5) and 15 May (end of week 20), 2009 (Fig. 1). In The Netherlands, criteria for notification of acute illness are presence of at least fever, pneumonia, or hepatitis plus laboratory confirmation of C. burnetii infection with (a) polymerase chain reaction (PCR), or (b) detection of a fourfold rise in serum antibody titres to C. burnetii or a high titre in two samples without a fourfold increase, or (c) a single high titre of IgM to phase II antigen. Controls were householders randomly selected based on having an address in the same six-digit postcode area (living on the same street) as each case.
Data were collected by means of a postal questionnaire addressed individually to named cases, and to ‘the householder’ at the control address. Questions related to demography (age, gender, occupation), exposure (number of visits to farm X and two additional agricultural sites Y and Z offering viewing/petting of sheep or goats, and which were open to the public in the area), month of visit, duration of direct contact with animals (time spent on the premises, presence at birth of lambs on the farm), outcome (symptoms, hospitalizations for Q fever-like symptoms), behavioural factors (travel history, smoking) and medical history.
Sample size calculation and data analysis
Of all notified adult cases in the region in 2009, 248 reported onset of illness between the start of week 5 and the end of week 20, and 42 of these had visited the farm between the first week of February and the last week of March (Fig. 1). The exposure among the cases was therefore 17% (42/248). For the detection of a minimum odds ratio (OR) of 3, two controls per case were required at a precision (alpha) of 5% [two-sided 95% confidence interval (CI)] to achieve power of 80%. Assuming 50% of cases responded, the minimum number of case respondents required was therefore 134 and for controls it was 268. Eight controls per case were invited to participate, with the aim of achieving a 25% response rate from controls.
Data were entered using Access and analysed using Stata v. 10.1 (StataCorp., USA). Baseline characteristics of cases and controls were compared using χ2 test. Univariable and multivariable analyses of the distribution of exposures in cases and controls were examined using matched ORs (conditional logistic regression) with 95% exact CIs. Risk factors which were statistically significantly associated with being a case at the 0·25 univariable level were selected for a conditional backward stepwise multivariable model. Significance level was set to 0·05 for the latter model.
Environmental investigation
Vaginal swabs were collected from 20 sheep on farm X on 19 May 2009, and were tested by multiplex quantitative real-time PCR (qPCR) at the laboratory in the National Institute of Public Health and the Environment in The Netherlands. Eight environmental aerosol samples were also obtained on 20 May 2009 in the vicinity of the farm, at a distance of 500 m and 1000 m in all four wind directions (north, east, south, west). A summary description of laboratory methods is given here, but these will be discussed in detail more appropriately elsewhere (A. De Bruin et al., unpublished data).
The qPCR detects two C. burnetii targets (com1 and IS1111), and one Bacillus thuringiensis internal control target (cry1b). B. thuringiensis spores were added to samples to control both DNA extraction and PCR amplification. Each DNA extract obtained was tested in triplicate for C. burnetii presence. Three μl of DNA extract per reaction were used in qPCR assays performed on a Lightcycler 480 Instrument (Roche Diagnostics Nederland BV, The Netherlands). In addition, 3 μl DNA from the C. burnetii Nine Mile RSA phase I strain were included as positive control, or 3 μl H2O as negative control. Analysis was performed on the instruments software: Lightcycler 480 software release 1.5.0. SP3.
Cq values were calculated using the second derivative method. Samples were scored as positive when at least one of the C. burnetii targets (com1, or IS1111) showed a positive signal. Samples were scored as negative when (a) no C. burnetii targets showed positive signals, and (b) there was a positive result for the internal control.
RESULTS
Epidemiological investigation
Sixty-five percent (162/248) of cases responded as did 35% (686/1985) of controls. As the sample size requirements had been fulfilled, no reminder letter was issued. Cases were individually matched on address and the matched analysis was performed on 146 cases matched to between one and six controls per case (1:Mk matching; total matched sample, n=579). Cases were of a similar age distribution to controls (mean age of cases 54·9 years, range 18–89; mean age of controls 54·8, range 22–79). Fifty-seven percent (n=85) of cases and 47% (n=202) of controls were male (Table 1). Of the cases, 62% (n=86) reported having pneumonia, two reported having hepatitis and three reported endocarditis; 38% of cases reported a variety of other symptoms including exhaustion, headache, high fever and cough. Overall, 35 (25%) cases were hospitalized. Mean duration of illness for cases was 21 days (median 10 days, range 0–365). No cases were pregnant at the time.
Table 1. Matched univariable and multivariable odds ratios of factors associated with the Q fever outbreak in Southeast Brabant region, The Netherlands, February–May, 2009
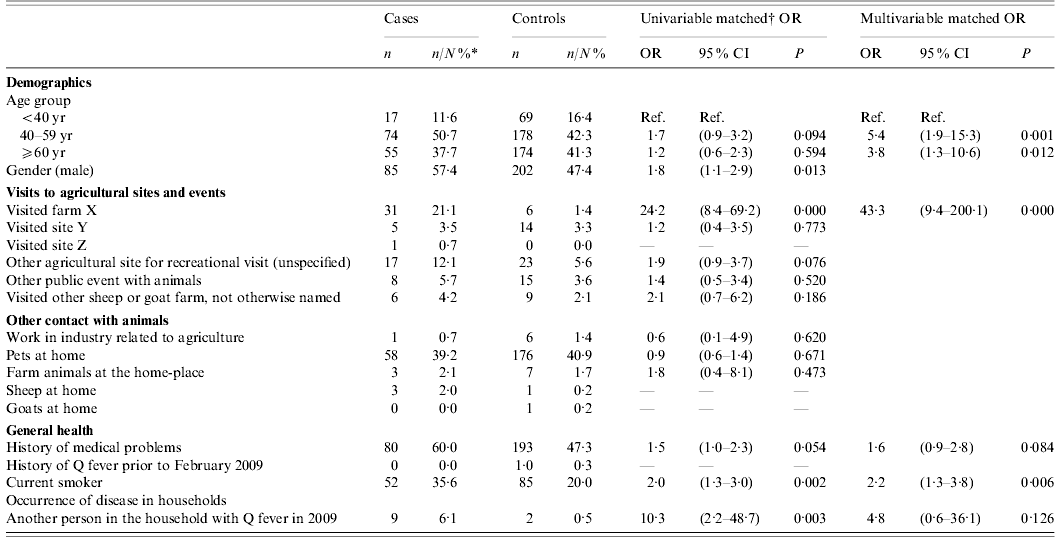
OR, Odds ratio; CI, confidence interval.
* N is the total number of respondents to the question. Where there is missing data, this may not total 146 for cases and 486 for controls.
† 1:Mk matching: cases matched to between 1 and 6 controls.
Based on trawling questionnaire data received from the first 32 cases (where precise date of farm visit and date of onset of illness were recorded), and assuming a point-source exposure, the average incubation time, defined as the time between day of illness onset and day of visit farm X, was 20·7 days (range 9–43 days).
At univariable level, 21% (n=31) of cases reported visiting farm X compared to 1% (n=6) of controls resulting in an OR of exposure between cases and controls of 24 (95% CI 8·4–69·2). When adjusted for other risk factors based on univariable findings (age group, gender, recreational visits to other agricultural sites or events, visits to other sheep/goat farms otherwise unspecified, medical history, smoking status and having a family member who had Q fever in 2009) the multivariable adjusted OR for a visit to farm X was 43·3 (95% CI 9·4–200·1). Other significant independent risk factors (Table 1) included being a current smoker (OR 2·2, 95% CI 1·3–2·8), and being aged >40 years (40–59 years: OR 5·4, 95% CI 1·9–15·3; ⩾60 years: OR 3·8, 95% CI 1·3–10·6).
Subgroup analysis: risk of Q fever for those visiting farm X
Thirty-seven respondents reported visiting farm X during the specified time period. No significant association was found between different behaviours on the farm (Table 2) in cases and controls.
Table 2. Distribution of exposures on the farm among cases and controls who visited the farm between 1 February and 31 March 2009
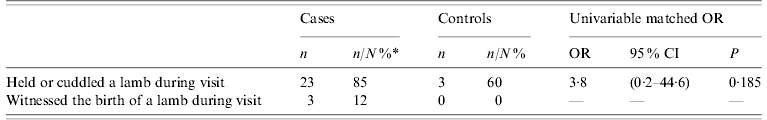
OR, Odds ratio; CI, confidence interval.
* N is the total number of respondents to the question. Missing data is not included.
Environmental investigation
Seventeen out of 20 vaginal swabs taken from sheep on the farm were positive for C. burnetii multicopy target IS1111 only, indicating a relatively low level of C. burnetii DNA present in these samples. One sample was found positive for both C. burnetii targets (com1 and IS1111).
Seven out of the total of eight aerosol samples taken 500 m and 1000 m from farm X were positive for C. burnetii target IS1111 in 2009; the only negative aerosol sample was located 500 m north of the farm.
DISCUSSION
This study confirms the association between a visit to ‘lamb-viewing days’ on sheep farm X between 1 February and 31 March 2009, and Q fever in cases. Other risk factors included increasing age, smoking and positive medical history (consistent with findings elsewhere [Reference Karagiannis9]). The reported mean incubation period of 21 days is also consistent with findings from other research [Reference Porten3]. Increased risk associated with handling or petting sheep and lambs, or witnessing the birth of a lamb was not demonstrated here (possibly related to the small number of cases and controls who reported such behaviours).
This study had a number of limitations. A cohort study of farm visitors could not be performed as no visitor list was available, therefore no attack rate or risk ratio could be calculated. The outbreak occurred in early 2009 and given the time lapse between the outbreak and this study and the degree of media coverage of outbreaks nationwide, there is potential recall bias. A farm visit is a distinct event however, and as the farm of interest was open for only a limited period it is likely that visitors would recall attending – in fact less than 1% reported not remembering whether they visited – although some could not remember the precise date.
This cluster occurred in the context of a much larger outbreak in the region. Farm X is situated in a region with other infected farms in proximity [Reference Schimmer6, 10], and given the potential role of the wind and other forms of indirect spread of C. burnetii [Reference Porten3, Reference Hawker11, Reference Lyytikainen12], it would in any case prove difficult to establish a causal link to farm X. In the absence of trawling questionnaires indicating the farm as a possible source, it is likely that this cluster would have remained unrecognized, and other unidentified sources may also be implicated in this outbreak. In this study, we matched controls to cases by street address in an attempt to control for some of these unknown factors. We tested the association with visits to other farm sites Y and Z, and public agricultural events in the area, but none was found. Q fever cases associated with flocks of non-dairy sheep and newborn lambs have been reported previously [Reference Koene13] and in one study, hundreds of infections were attributed to a single ewe at a farmer's market [Reference Porten3]. Given these findings, the positive vaginal swabs from sheep on the farm, and the fact that DNA was isolated from three aerosol sampling locations proximal to the farm, it is plausible that of those who visited farm X between 1 February and 31 March 2009, 95% of the cases that occurred were attributable to the visit (the attributable fraction among the exposed).
It is estimated that up to 60% of Q fever cases are asymptomatic, and therefore there were potentially cases in the control group. No serological testing of controls was conducted in this study; however, recent analysis of blood donor samples in the region confirmed a prevalence of anti-IgG antibodies of 12% in 2009 [Reference Hogema14]. If this prevalence were applied to our data, the impact on the ORs reported here is uncertain. If cases and controls were correctly classified, the reported ORs may be an overestimate of the association. If, however, a greater proportion of farm visitors than expected were reclassified as cases, the OR of association would not necessarily be reduced. In either case, a visit to farm X would still be a strong independent risk factor for Q fever.
In the Brabant region there are 35 petting farms and 14 zoos open to the public and in 2008, there were 1·6 million recreational visits to farms and farmland in the area. ‘Lamb-viewing days’ during lambing season were particularly popular [15]. ‘Agri-tourism’ is therefore an important recreational and revenue-generating activity in the region. In January 2010, the Ministry of Health issued a hygiene protocol to all farms with a public function including petting farms and those offering ‘lamb-viewing days’ [16]. Control measures implemented throughout the country included isolation of pregnant sheep and goats (away from public areas), mandatory animal vaccination, and cessation of ‘lamb-viewing days’ until vaccination was complete. As a result, farm X was closed to the public in February–March 2010, pending vaccination of the herd which has since been completed. The farm reopened to the public in spring 2011. As a result of the vaccination campaign in sheep and goats nationally, it is expected that the number of human cases will fall in the coming years [Reference van der Hoek17], but farm visitors should continue to be vigilant. Vulnerable groups such as pregnant women, people with cardiovascular anomalies, and those with reduced immunity, should be aware of their elevated risk with regard to Q fever. For all farm visitors, hygiene and preventive measures should continue to be practised according to recommendations [18].
ACKNOWLEDGEMENTS
Many thanks to Jan van den Beer for his contribution to this study. We are particularly grateful to the farmer at farm X who readily provided information about the farm and the public function of the farm; thanks are also due to all respondents who participated in the study. Finally, thanks to EPIET coordinator Ioannis Karagiannis for his comments and suggestions in relation to the manuscript.
DECLARATION OF INTEREST
None.


