1. INTRODUCTION
The aim of this paper is to highlight a variety of safety and economic issues the digital revolution potentially brings to aviation charting. There are numerous digital charting products used in aviation, such as enroute Visual Flight Rules (VFR) and Instrument Flight Rules (IFR) charts, the Airport Facility Directory (AF/D), and charted Standard Instrument Approach Procedures (SIAPs) (Secretan, Reference Secretan2011). This article focuses only on the US SIAP segment of the market, describes regulatory processes related to SIAP oversight, and argues emerging technology and economic trends suggest review of regulatory oversight related to SIAP implementation. The current generation of digital SIAP software delivery mechanisms render graphical charts as one file (object); however, there are regulatory, economic, and technology drivers that may change rendering methods to a dynamic, object orientated approachFootnote 1. This change may be a key enabler of innovations in digital SIAP chart delivery, enabling cockpit information displays consistent with US and worldwide 2025-era visions of air traffic management. However, should these innovations be improperly regulated, latent safety hazards may be introduced on the one hand, or conversely, new entrants may be inhibited from entry into the marketplace on the other, with a commensurate stifling of innovation.
The remainder of this paper is structured as follows: the US SIAP chart creation process and associated regulations are discussed in Section 2, concluding with a notional iPad-era® process transformation; Section 3 elaborates on the notional process, comparing the current one object digital SIAP chart rendering technique and a dynamic, object orientated approach. Innovations in consumer mobile applications are then discussed in Section 4, demonstrating the promise and regulatory challenges of these innovations relative to SIAP chart presentation and future visions of air traffic management in the US Next Generation Air Transportation System (NextGen) (FAA, 2011a) and Single European Sky Air Traffic Management Research Program (SESAR) (SESAR, 2012). A discussion of a few specific navigation concepts in a NextGen/SESAR world are discussed in Section 5, followed by conclusions in Section 6.
2. CHART CREATION PROCESS AND REGULATORY FRAMEWORK
There were over 12,000 SIAPs available in the US system alone in 2011 (FAA AeroNav, 2012). According to 14 Code of Federal Regulation (CFR) Part 97 (CFR, 2012), the complete regulatory description of each SIAP is contained in the appropriate Federal Aviation Administration (FAA) Form 8260 (FAA, 2009). 14 CFR 97 (CFR, 2012) further notes that Form 8260 textual descriptions are not regularly published due to their complexity and because airmen do not use the Form 8260 representation in flight operations; rather the graphical depiction of Form 8260 information is portrayed on charts produced by publishers of aeronautical materials. Figure 1 compares the official Form 8260 SIAP text to the graphical depiction of the same information. The process of converting a chart from its textually coded source data into a graphical depiction is guided by technical information in 14 CFR 97 (CFR, 2012), the FAA 8260 series of orders, International Civil Aviation Committee (ICAO) Annexes 4 (ICAO, 2009) and 15 (ICAO, 2010), ARINC (ARINC, 2012), RTCA (RTCA, 2012), as well as the 1967 Federal Aviation AgencyFootnote 2 Advisory Circular (AC), “Recommended Standards for IFR Aeronautical Charts” (Federal Aviation Agency, 1967). The manner in which the US government charges users for the charting process, referred to as economic recovery of chart publication costs, is governed by Title 49 US Code (USC) 44721 (USC, 2012).
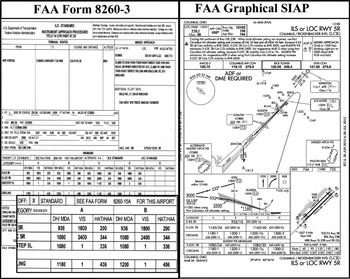
‘49 USC 44721’ (USC, 2012) requires charts published by the US federal government recover costs for database management processing, compilation, printing, and dissemination. This part of US code has been interpreted to mean that the graphical chart shown on the right side of Figure 1, whether paper or digital, must have a fee associated with it. On the other hand, the Form 8260 information shown on the left side of Figure 1 is part of the overhead of the administration of US air navigation and is in essence public information (FAA AeroNav, 2012).
2.1. Analysis of Regulatory Framework
The regulatory framework creates an important observation of the charting process: the FAA does not certify, review, or provide oversight of private vendor paper chart implementation. The advent of digital charts presents a potential challenge to this regulatory approach, as will be discussed further in this paper. While ICAO Annex 4 (ICAO, 2009) provides guidance on the paper size for charts (ICAO, 2009), and Annex 15 suggests charting data production use a Quality Management System (QMS) (ICAO, 2010), there is no definitive language stipulating regulatory oversight of the charting process. That is, while the information on the left side of Figure 1 is a highly regulated process and a prescribed facet of aeronautical information creation, the compilation and implementation of the graphical chart by private vendors has no certification or oversight process by the US government. This lack of oversight was noted by the US National Transportation Safety Board (NTSB) during its investigation of TWA Flight 514 in 1974, stating:
“The Jeppesen chart depicting the approach used by the crew of [TWA] Flight 514 was based on data published by the FAA on the Form 8260.5. However, there was no formal program of review or approval by the FAA in comparing the Jeppesen chart with the basic data on the FAA Form 8260.5” (NTSB, 1975, p. 13).
One of the contributing factors in TWA Flight 514 was stated as:
“Inadequate depiction of altitude restrictions on the profile view of the approach chart for the VOR/DME approach to runway 12 at Dulles International Airport” (NTSB, 1975, p. 40).
No recommendations were made to change charting oversight and the regulatory framework in use today is the same as it was in 1974, when the NTSB investigation of TWA Flight 514 took place.
The current SIAP charting environment is limited to only three major implementers of charts: private companies Jeppesen Sanderson® and Lufthansa's Lido® charts, and the FAA AeroNav charting office. Without regulatory oversight, operational problems are resolved through collaborative notification processes of the respective organizations, whereas process issues are addressed through government-industry groups, such as the FAA-hosted Aeronautical Charting Forum. For example, in 2010 the group debated differences between the charting of a crossing fix on the ‘Burbank Instrument Landing System (ILS) LOC Z Runway 8’ SIAP on a commercially implemented chart, as compared to the FAA AeroNav implementation of the chart (Instrument Procedures Group, 2010). Other sample issues discussed have included the combined presentation of localizer and ILS approaches on the same chart, and the selective omission of alternative missed approach procedures contained in the Form 8260 but not presented on the published chart (Instrument Procedures Group, 1998; Instrument Procedures Subgroup, 1997).
In 2010, in response to an RTCA NextGen task force report recommending a solution to approval and certification issues of SIAPs that may impede US NextGen capabilities, the FAA reviewed the workflows related to the creation of SIAPs and in their resulting NavLean report said:
“The current Instrument Flight Procedures (IFP) development and implementation process is actually a bundle of interconnected, overlapping, and sometimes competing processes. No unique description exists for the current process; however, there is a core process for IFP implementation (request, design and development, approval, implementation, and maintenance) along with several other auxiliary processes (Safety Management System, Operations Approval and Certification, Environmental, and Criteria Development) that intersect with this core process to complete the full life cycle of an IFP. (FAA, 2010a. p. 5)”
The working group made 21 recommendations to improve the SIAP production process. Notably, none of these recommendations addressed graphical chart implementation.
The TWA Flight 514 accident mentioned earlier led to the creation of the anonymous reporting program now known as the Aviation Safety Reporting Program administered by the US National Aeronautics and Space Administration (NASA), (Stolzer et al., Reference Stolzer, Halford and Goglia2008). Nearly 20 years later, in 1995, the Safety Management Systems (SMS) framework adoption process began, in an effort to expand on the concept of proactive safety (Stolzer et al., Reference Stolzer, Halford and Goglia2008). SMS is significant to the charting process in terms of its prescriptions for safety assurance measures and industry sharing of safety assurance measures. While the aviation community is moving towards SMS, current ICAO Annex 15 (ICAO, 2010) guidance as it relates to SIAPs only provides for QMS usage; there are gaps between a QMS and an SMS system, specifically in the areas of information sharing, safety risk management, safety assurance, and regulatory oversight (FAA, 2010b). The lack of regulatory oversight for chart implementers means that over fifty years of process metrics related to chart quality are at best un-standardized and at worse non-existent. While the industry forums discussed prior may serve a safety assurance function for a small number of chart implementers, with more entrants into the chart implementation space, a forum approach is questionable: SMS may provide the oversight framework enabling chart implementer data sharing of safety assurance metrics.
A more comprehensive view of the chart creation process is shown in Figure 2. While the steps preceding the publication of the Form 8260 are many and detailed, including request management, airport surveys, and information collection (FAA, 2010a), for the purpose of this paper, Figure 2 shows the graphical chart production as a distinct phase from the process leading to the creation of the Form 8260 as well as the distribution process.

Figure 2. Lifecycle of charting process.
The advent of digital distribution methods, both the connected internet and mobile devices such as Apple®'s iPad®, has radically changed the nature of aeronautical information delivery. For example, guidance has been developed for Electronic Flight Bags (EFBs) for private operators (FAA, 2007) and authorization processes for commercial operators (FAA, 2012; FAA, 2003; Skaves, Reference Skaves2011).
2.2. Impact of Digital Revolution
By June, 2011, over 25 million iPad®s had been sold with 90,000 of 425,000 Apple® mobile operating applications (iOS®) being targeted at the iPad® alone (Jobs, Reference Jobs2011). At a 13 December 2011 meeting of over 70 digital chart distributors (i.e., software products for the Internet and mobile devices), the FAA AeroNav office detailed how it has been financially impacted by the mobile digital revolution, reporting a $5 million operating deficit related to 49 USC 44721 (USC, 2012) mandated cost recovery in chart production (Anderson, Reference Anderson2011). At the same meeting, AeroNav proposed the suspension of feeless, web-based distribution of charts in favour of a digital chart vendor distribution agreement, with fees related to per end user cost recovery. The notional amount of the per-user fee for SIAPs was $48 per user per year as compared to a prior, DVD-mailed service of $179 for unlimited re-distribution per year (Sullivan, Reference Sullivan2011). For vendors with 5,000 customers, this would raise the per annum cost from $179 to $240,000 per annum, or about a 134,000% increase in per annum cost. This new cost structure may drive changes to the digital charting industry.
The distribution model currently employed by digital SIAP software uses the graphical SIAP charts compiled by charting organizations—principally FAA AeroNav—and redistributes those SIAPs through a digital device, for example the iPad® or a dedicated EFB. By pursuing software-based on a redistribution workflow, digital SIAP distributors gain two benefits: use of precompiled chart files with little risk of modification during rendering, and liability indemnification for error as described in 49 USC 44721 (USC, 2012). However, the financial value of these benefits can be compared to a workflow model shown in Figure 3. Under this model, the source data from the Form 8260 could be compiled by a new breed of digital chart compilers/distributors, bypassing the compilation and distribution charges incorporated in 49 USC 44721 (USC, 2012) and proposed on 13 December 2011 by the FAA AeroNav office.

Figure 3. Notional process model for digital chart distribution.
3. DIGITAL CHART RENDERING
Currently, the software produced by digital chart distributors has demonstrated capabilities to display charts, in addition to the overlay display of aircraft position and weatherFootnote 3. Given the file used to depict a digital SIAP is one, static digital file—essentially an Adobe® Acrobat® (PDF) file—there are few opportunities for modification of the chart (FAA AeroNav, 2012). The relationship of one file to one SIAP (i.e., one object) has the benefit of preventing unintended modification to the chart during digital rendering. However, the one object rendering method is an obstacle to taking advantage of the opportunities of the digital medium.
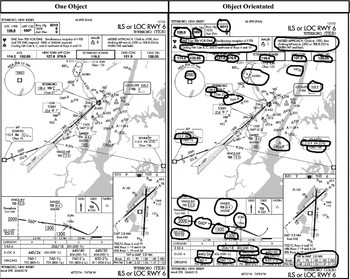
Figure 4 shows a notional comparison of a one object versus an object orientated model to digital chart rendering. The object orientated approach maintains the original Form 8260 data elements as accessible objects for interface and software manipulation. The right side of Figure 4 circles each data element from the underlying source data, notionally retaining the related semantic meaning of each highlighted attribute.

Figure 4. Object orientated approach to chart rendering; the right side highlighting data attributes.
3.1. Object Orientated Rendering in a Growing Aviation System
There have been studies related to the display of information on SIAPs. In the late 1990s, before i-prefixed products such as the iPad® existed, the FAA sponsored a study on SIAP information presentation and pilot attitudes towards future digital presentation. The study included consideration of chart clutter and pilot customization of information displayed. While 59% of pilots desired no change to SIAP formatting, only 31% of those surveyed said they would be comfortable using electronic SIAPs without a paper backup. The low response rate of the study—only 29 respondents of 300 solicited—renders its quantitative findings questionable. However, the study design and qualitative results provide insight into the nature of an object orientated approach to chart rendering. For example, the study defined approximately 80 information elements (i.e., objects) that make up the information on an SIAP. Some qualitative comments collected noted the many towers depicted on a chart were of little use and chart users attributed their placement on the chart to the needs of the chart manufacturer rather than the chart user (Hansman & Mykityshyn, Reference Hansman and Mykityshyn1995; Mykityshyn, Reference Mykityshyn1991).
More recent studies related to SIAPs relate to human factors considerations of charting symbols and display of real time environmental information, such as Notices to Airmen (NOTAMs). The Department of Transportation Volpe Center studied the possibility of confusion generated by non-standard symbols on charts in a study related to the harmonization of international standards (Chandra et al., Reference Chandra, Yeh and Donovan2007). Part of the efforts of NextGen (FAA, 2011a) and SESAR (SESAR, 2012) is delivery of the right information to the right users at the right time (FAA, 2011b). In defining the vision for US aviation in 2025, the FAA emphasizes the need to increase situational awareness on the flight deck, and integrating human factors with technology (FAA, 2011a); electronic displays such as navigation charts are a key element of cockpit information delivery. In order to enable this information exchange and associated situational awareness, interoperability efforts are underway, including System Wide Information Management (SWIM) and Aeronautical Information Exchange Model (AIXM). Key technology themes enabling these interoperability and human factors efforts can be summarized as: information transmission mechanisms; rule-based processing; and display mechanisms (Zimmer et al., Reference Zimmer, Schiefele, Bayram, Hankers, Frank and Feuerle2011).
4. MOBILE INNOVATION APPLIED TO CHARTS
The challenges of information transmission, rule-based processing, and display mechanisms are embodied in the success of mobile applications, most notably the market share leader, Apple®'s iOS® (Apps). In the three year period since the initial opening of Apple®'s App StoreSM, over 425,000 Apps had been created by independent software developers for iOS® devices, resulting in payments to these developers of over $2.5 billion by June 2011. These Apps have penetrated the marketplace with over 14 billion installs, addressing challenging problems similar to those potentially faced by object orientated chart rendering through the use of powerful application programing interfaces for information transmission, rule based processing, and display mechanisms (Jobs, Reference Jobs2011; Stauffer, Reference Stauffer2011). Said simply, if mobile Apps can interact with iCloud® (Jobs, Reference Jobs2011), display graphic intensive applications such as Angry Birds™, and ShadowGun™, and identify music titles through heuristic pattern matching and wireless database comparisons, then object orientated delivery of charts is well within the capability of current technology.
As mentioned previously, today's digital SIAP App market software renders a chart as one object, a model that can be characterized as redistribution of content with the significant additional feature of position and weather overlays. This redistribution paradigm could transition to the combined renderer/distributor object orientated model shown in Figure 3. Given the current regulatory environment, which considers the Form 8260 data to be the official SIAP document and provides no oversight of chart compilation and production, such a transition may create safety concerns distinct from the existing SIAP paper chart implementation oversight process. These concerns span issues of data management, human factors, symbology usage, and advanced features such as selective display of information. While SIAP chart implementation issues share many EFB concerns, addressing the transformation of Form 8260 data to chart rendering through EFB hardware and software operational authorizations (FAA, 2012; FAA, 2003; Skaves, Reference Skaves2011) may challenge multi-disciplinary regulator resources. This challenge may prove ineffectual and stifle competition and innovation by deterring potential new entrants into the digital SIAP charting market. The result could be that other sectors of mobile digital applications will continue to innovate, and aviation digital charting will lag behind.
While safety and regulatory issues related to chart compilation and object orientated rendering are significant, the ecological maturation of digital features in electronic products has been proven time and again in other industries, for example: from film to digital photography, from travel agents to internet based self-booking, and physical medium music to digital music to cloud-based music (Lucas, Reference Lucas2008). Object orientated chart rendering can be an enabler of the future needs of NextGen (FAA, 2011a) previously mentioned. However, none of the NextGen (FAA, 2011a) portfolios reviewed specifically address the narrow issue of SIAP digital chart compilation and rendering (FAA, 2011b), yet numerous domestic and global notional prototypes of 2025–2030 generation displays incorporate chart related information (Bayram et al., Reference Bayram, Hankers, Zimmer, Schiefele and Hecker2011; Innovation Analysis Group, 2010; Kelly & Painter, Reference Kelly and Painter2006; Open Geospatial Consortium, 2011).
Building upon the research cited in this article, possible innovations enabled by object orientated chart rendering include:
• De-clutter charts by only displaying the category-related minimums and information of the aircraft (i.e., A, B, C, D, E) being operated rather than all informationFootnote 4, and excluding the display of Ultra-High Frequency (UHF) or Tactical Air Navigation system (TACAN) channels for operators not in need of such information.
• Highlight key features through the use of flashing icons, such as the highest obstacle on the chart (a specifically recommended item for inclusion on charts in AC 211–2) (Federal Aviation Agency, 1967) or exceptional, key features, such as mandatory crossing altitudes;
• Guided approach briefings through timer-based highlighting of information blocks on the chart;
• Interactive display of alternate missed approach procedures, when such information exists in the Form 8260 record;
• Automated update of approach minimums when airport and navigational components are out of service through interoperability with NOTAMS; and
• Interactive frequency selection, i.e., touch on a frequency on the mobile device and the frequency is selected on a communication or navigation device.
This list of ideas is only notional, each requiring discovery of human factors and safety issues as outlined in publications such as AC 120-76B (FAA, 2012). Under the current regulatory environment, these notional ideas for interactive, object orientated chart rendering can conceivably be put into practice without any regulatory oversight for private 14 CFR 91 operators (non-subpart F or K) (FAA, 2012; FAA, 2007; CFR, 2012) and the human factors and safety issues will be the evaluative responsibility of the individual pilot, to decide if the chart is an adequate and proper representation of the underlying Form 8260 data. Conversely, if the regulatory oversight of digital chart implementations is contained within EFB authorization documents such as AC 120-76B (FAA, 2012), then the number of competitors in the chart implementation market may remain limited, with the aforementioned consequence of missing out on potential innovations experienced in other segments of mobile applications.
5. NEXTGEN AND THE PLACEMENT OF SIAPS
There are emerging trends of how future cockpit information displays will look and work. For example, there are notions for displays that include applying rule-based processing to NOTAMS and weather information to create an integrated display for enroute and taxi phases of flight (Bayram et al., Reference Bayram, Hankers, Zimmer, Schiefele and Hecker2011). There is work on the creation of ARINC 816 (ARINC, 2012) to define an industry data standard useful to airport moving map displays (Pschierer & Schiefele, Reference Pschierer and Schiefele2007). There are concepts of highway in the sky displays (Kelly & Painter, Reference Kelly and Painter2006). Each of these display technologies can benefit from evolutions in SIAP digital rendering.
During an international forum on EFBs, industry discussed how to integrate EFBs with the aircraft databus and the concerns and benefits of such integration, including position information, fuel state, quick access recorder information, and inputs from the electronic centralized aircraft monitor (Norell, Reference Norell2011). Innovative, 2025–2030 notions of EFB displays of enroute maps show overlays of weather and NOTAM information from real-time weather sources, even considerations for pilot “social networks” for exchange of pilot reports while enroute (Ritter, Reference Ritter2011).
The extent of EFB display integration in literature and industry forums seems limited to overlays with the most significant advances occurring in airport moving map displays. Absent from the notional displays are use of the SIAP chart as both an information source and user interface device.
6. CONCLUSIONS
The current state of regulatory oversight of SIAP chart implementation is limited to the federal design of SIAPs and the publication of Form 8260 data. There is no oversight of the private vendor conversion process from Form 8260 data to a paper chart depiction. The digital revolution challenges this regulatory approach. EFB authorization seems to provide the regulatory control for new entrants into the digital SIAP charting market.
The current delivery mechanism of single object SIAP charts to display devices is in part driven by the ready availability of free, digitally compiled charts. However, the economic landscape is in a state of flux, and the 134,000% proposed increase in chart distributor fees related to 49 USC 44 721 may change the way chart distributors innovate, causing them to source their products directly from Form 8260 data. If such innovators embark into this new area of chart implementation aimed at private aircraft operators without regulatory oversight, there could be significant safety concerns. Conversely, if regulatory oversight is misapplied, digital SIAP innovation may be stifled, inhibiting future evolution of notional NextGen (FAA, 2011a) information exchanges and displays.
In the FAA's vision for 2025, key strategies include: strengthening and improving technology as well as certification processes; ensuring no degradation of safety as new NextGen (FAA, 2011a) technologies are incorporated in practice; and implementing NextGen architectures to deliver accurate information to equipped users (FAA, 2011a). At minimum, the process by which SIAPs are implemented as charts, both paper and digital, is worthy of a technology and regulatory process review.
GLOSSARY

ACKNOWLEDGEMENTS
I wish to thank Dr. Steve Hampton, Embry-Riddle, for helping me mature this paper, and those many peers who provided feedback. Also thanks to my good friends Michael Hodish and Todd Huvard for their encouragement and review.