


INTRODUCTION
Micronutrient deficiencies affect a large segment of the population in the developing world (WHO 2002). Iron (Fe) and zinc (Zn) are receiving increasing attention globally as their deficiency is widespread, particularly in developing countries. Iron deficiency primarily affects women and children. The consequences of malnutrition are varied and far-reaching. In infants and young children, undernutrition and growth retardation are associated with reduced physical activity, lowered resistance to infection, impaired intellectual development and cognitive abilities, and increased morbidity and mortality. Despite the large-scale intervention programmes, Fe-deficiency anaemia remains the most widely prevalent nutritional problem in the world.
Plant foods remain the major source of minerals and vitamins for the poor in developing countries since animal products, which are rich in micronutrients, are beyond their reach. Enhancing the Fe and Zn concentrations of plant foods that are consumed daily may prove to be an effective and convenient way of overcoming deficiencies of these micronutrients in human diets (Bouis Reference Bouis1996; Grusak & DellaPenna Reference Grusak and DellaPenna1999; House et al. Reference House, Welch, Beebe and Cheng2002). However, bioavailability of Fe and Zn from plant foods is low (Gibson Reference Gibson1994; Sandberg Reference Sandberg2002) due to the presence of anti-nutrient factors such as phytates and polyphenols (Engle-Stone et al. Reference Engle-Stone, Yeung, Welch and Glahn2005). It is possible to enhance the bioavailability by addition of erythorbic acid or ascorbic acid in processed foods (Fidler et al. Reference Fidler, Davidsson, Zeder and Hurrell2004) and through fermentation of food, which activates endogenous phytases (Hemalatha et al. Reference Hemalatha, Platel and Srinivasan2007).
Significant genetic variation in the seed concentrations of Fe and Zn of various crops is reported in the literature – rice, Oryza sativa L. (Sarla et al. Reference Sarla, Mallikarjuna Swamy, Kaladhar, Anuradha, Venkateshwar Rao, Batchu, Agarwal, Babu, Sudhakar, Sreenu, Longvah, Surekha, Rao, Reddy, Roja, Kiranmayi, Radhika, Manorama, Cheralu and Viraktamath2012); cassava, Manihot esculenta Crantz (Maziya-Dixon et al. Reference Maziya-Dixon, Kling, Menkir and Dixon2000); common wheat, Triticum aestivum L. (Morgounov et al. Reference Morgounov, Gómez-Becerra, Abugalieva, Dzhunusova, Yessimbekova, Munimjanov, Zelenskiy, Ozturk and Cakmak2007); maize, Zea mays L. (Maziya-Dixon et al. Reference Maziya-Dixon, Kling, Menkir and Dixon2000); sorghum, Sorghum bicolor (L.) Moench (Ashok Kumar et al. Reference Ashok Kumar, Reddy, Ramaiah, Reddy, Sahrawat and Upadhyaya2009; Reddy et al. Reference Reddy, Reddy, Ashok Kumar, Ramesh, Sahrawat and Venkateswara Rao2010); pearl millet, Pennisetum glaucum (L.) R. Br. (Velu et al. Reference Velu, Rai, Muralidharan, Longvah and Crossa2011); common beans, Phaseolus vulgaris L. (Beebe et al. Reference Beebe, Gonzalez and Rengifo2000; House et al. Reference House, Welch, Beebe and Cheng2002; Blair et al. Reference Blair, Astudillo, Grusak, Graham and Beebe2009); chickpea, Cicer arietinum L. (Thavarajah & Thavarajah Reference Thavarajah and Thavarajah2012); lentil, Lens culinaris Medic. (Thavarajah et al. Reference Thavarajah, Thavarajah, See and Vandenberg2010); field peas, Pisum sativum L. (Amarakoon et al. Reference Amarakoon, Thavarajah, McPhee and Thavarajah2012); soybean, Glycine max (L.) Merr. (Raboy et al. Reference Raboy, Dickinson and Below1984); and peanut, Arachis hypogaea L. (Lal & Singh Reference Lal and Singh2007; Asibuo et al. Reference Asibuo, Akromah, Safo-Kantanka, Adu-Dapaah, Ohemeng-Dapaah and Agyeman2008; Singh et al. Reference Singh, Chaudhari and Misra2011; Upadhyaya et al. Reference Upadhyaya, Dronavalli, Singh and Dwivedi2012a). Furthermore, simultaneous improvement of both Fe and Zn concentrations in seeds is possible, since a strong positive association is reported between them in peanut (Upadhyaya et al. Reference Upadhyaya, Dronavalli, Singh and Dwivedi2012a), common bean (Gregorio Reference Gregorio2002; House et al. Reference House, Welch, Beebe and Cheng2002), lotus (Lotus japonicus (Regel) K. Larsen) (Klein & Grusak Reference Klein and Grusak2009), sorghum (Ashok Kumar et al. Reference Ashok Kumar, Reddy, Ramaiah, Reddy, Sahrawat and Upadhyaya2009; Reddy et al. Reference Reddy, Reddy, Ashok Kumar, Ramesh, Sahrawat and Venkateswara Rao2010), wild emmer wheat (Triticum turgidum ssp. dicoccoides (Körn.) Thell.) (Peleg et al. Reference Peleg, Saranga, Yazici, Fahima, Ozturk and Cakmak2008), common wheat (Morgounov et al. Reference Morgounov, Gómez-Becerra, Abugalieva, Dzhunusova, Yessimbekova, Munimjanov, Zelenskiy, Ozturk and Cakmak2007) and maize (Maziya-Dixon et al. Reference Maziya-Dixon, Kling, Menkir and Dixon2000). A similar correlation in cassava was weak (Maziya-Dixon et al. Reference Maziya-Dixon, Kling, Menkir and Dixon2000). Accumulation of Fe and Zn in plants is also highly influenced by environmental factors. Temperature during the seed-filling stage influences accumulation of seed Fe and Zn in common beans (Thavarajah et al. Reference Thavarajah, Thavarajah, See and Vandenberg2010). Similarly, temperature and soil mineral content of Fe and Zn are reported to influence grain Fe and Zn concentrations in wheat (Joshi et al. Reference Joshi, Crossa, Arun, Chand, Trethowan, Vargas and Ortiz-Monasterio2010; Singh et al. Reference Singh, Chaudhari and Misra2011).
The nature of inheritance and presence of quantitative trait loci (QTL) for Fe and Zn seed concentrations in various crops have been reported in the literature. In cereals, additive and dominant gene effects, environmental effects and reciprocal effects (Gregorio Reference Gregorio2002) and a few QTL with considerable additive×additive epistatic interactions (Lu et al. Reference Lu, Li, Zheng, Zhang, Mou and Hu2008) in rice, a preponderance of additive gene action in pearl millet (Velu et al. Reference Velu, Rai, Muralidharan, Longvah and Crossa2011), and strong genotype by environment (G×E) interaction and very low broad sense heritability in wheat (Joshi et al. Reference Joshi, Crossa, Arun, Chand, Trethowan, Vargas and Ortiz-Monasterio2010) have been documented. In inter-specific crosses of common bean, the inheritance of Fe concentration in seed is reported to be quantitative (Guzmán-Maldonado et al. Reference Guzmán-Maldonado, Martínez, Acosta-Gallegos, Guevara-Lara and Paredes-Lopez2003) and that of Zn to be simple (Cichy et al. Reference Cichy, Forster, Grafton and Hosfield2005). Blair et al. (Reference Blair, Astudillo, Grusak, Graham and Beebe2009) reported five QTL for Fe and six for Zn concentration that were clustered on the upper half of linkage group B11, explaining up to 0·48 of phenotypic variance and suggesting the presence of an important locus useful for marker-assisted selection in bean.
Peanut is considered highly nutritious for humans and is considered a high-energy food as it contains 480–500 mg/g high-quality edible oil, 260–280 mg/g easily digestible protein and 200 mg/g carbohydrates (Jambunathan Reference Jambunathan, Jambunathan, Hall, Sudhir, Rajan and Sadhana1991). It is also a rich source of vitamins E, K and B complex. Of the 20 minerals necessary for normal body growth and maintenance, seven, including Fe and Zn, are present in peanut. It is also rich in dietary fibre and is rated as a low sodium food. Developing countries, where micronutrient deficiencies are widespread, contribute c. 0·98 of the world's peanut-growing area and 0·96 of global peanut production (FAO 2011). More than 100 countries grow the crop. Thus, peanut can contribute significantly towards reduction of protein-energy and micronutrient malnutrition. There are only a few studies on genetic variation in Fe and Zn concentrations in peanut seed (Lal & Singh Reference Lal and Singh2007; Asibuo et al. Reference Asibuo, Akromah, Safo-Kantanka, Adu-Dapaah, Ohemeng-Dapaah and Agyeman2008; Singh et al. Reference Singh, Chaudhari and Misra2011; Upadhyaya et al. Reference Upadhyaya, Dronavalli, Singh and Dwivedi2012a). Except for the study of Upadhyaya et al. (Reference Upadhyaya, Dronavalli, Singh and Dwivedi2012a) on a mini core collection of peanut germplasm in India, the other studies are preliminary in nature and of limited value. Improving concentrations of Fe and Zn in peanut seed through breeding requires a good knowledge of the extent of genetic variation, stable genotypes that maintain superior performance across environments and knowledge of trait inheritance. The present study was conducted to (i) estimate the extent of variation for Fe and Zn concentrations along with oil and protein concentrations in peanut seed from selected germplasm and advanced breeding lines, (ii) determine the heritability of these traits, (iii) find correlations among these traits with yield parameters and (iv) identify genotypes with stable performance for Fe and Zn concentrations across environments that can be used as parents in breeding programmes and to develop mapping populations.
MATERIALS AND METHODS
Sixty-four groundnut genotypes consisting of germplasm accessions and popular varieties originating from India, Africa and South America, and advanced breeding lines and inter-specific derivatives developed at the International Crops Research Institute for the Semi-Arid Tropics (ICRISAT) were included in the current study. These genotypes belonged to three botanical varieties – A. hypogaea subsp. hypogaea var. hypogaea (Virginia type), A. hypogaea subsp. fastigiata var. vulgaris (Spanish type) and A. hypogaea subsp. fastigiata var. fastigiata (Valencia type). Each of these botanical types has different plant, pod and seed characteristics (Krapovickas & Gregory Reference Krapovickas and Gregory1994). The experiment was conducted in eight environments in Alfisols (Alfisol-Patancheru Soil Series; Udic Rhodustolf) fields at ICRISAT, Patancheru, India (17°31′N, 78°16′E, 545 m a.s.l.) during four cropping seasons (rainy seasons of 2009 and 2010, and post-rainy seasons of 2009/10 and 2010/11). It was laid out in an 8×8 Alpha Lattice design with two replications. The plot size in the 2009 rainy season consisted of two 4 m rows on ridges 60 cm apart. In the other three seasons, it was four 4 m rows 30 cm apart grown on a broad bed and furrow system. The plant to plant distance within a row in all seasons was 10 cm. Standard agronomic management practices was followed in each season: 60 kg phosphorus pentoxide (P2O5) as a basal application, seed treatment with mancozeb (2 g/kg seed) and imidachloprid (2 ml/kg seed), pre-emergence application of pendimethalin (1 kg active ingredient/ha), irrigation soon after planting, and subsequently as and when needed, or as per the requirement of the treatment, gypsum (400 kg/ha) at peak flowering and protection against insect pests and diseases.
In the rainy seasons of 2009 and 2010, two sets of experiments were grown in the same field, with one receiving irrigation as and when required (supplementary irrigation) and the other solely under rainfed conditions (barring one irrigation soon after sowing). Similarly, in the post-rainy seasons of 2009/10 and 2010/11, two sets of experiments were grown in the same field with one receiving full irrigation and the other under managed moisture stress 60 days after sowing (DAS) until harvest. The moisture stress was created by skipping alternate irrigations from 60 DAS. Thus, the genotypes were evaluated in eight different environments for Fe, Zn, oil and protein concentrations in the seeds, pod yield, shelled weight from 100 g of pods and 100-seed weight.
Soil analysis to estimate the Fe and Zn status of the experimental block was conducted in all eight environments. In each block of a replication, two soil samples were collected from a depth of 15 cm before sowing using an auger. Subsequently, all 16 samples in one replication (eight blocks in a replication) were bulked, thoroughly mixed and foreign materials such as roots, stones, pebbles and gravel were removed. After this, soil was quartered by spreading it in a circle, dividing the sample into four equal parts and discarding the opposing quarters. Quartering was repeated to obtain a final soil sample of 100–150 g, which was used to estimate micronutrient status in the soil. The samples were analysed at the Charles Renard Analytical Laboratory (CRAL) at ICRISAT, Patancheru. The quality of analysis was assured by regularly monitoring and analysing the standard samples received from the International Plant and Soil Analytical Exchange Laboratory, Wageningen Evaluating Programmes for Analytical Laboratories (WEPAL), located in the Netherlands (http://www.intranet.icrisat.org/gtaes/Services/laboratories.htm).
Protocol for estimation of iron and zinc concentrations in groundnut seeds
Iron and Zn concentrations were estimated following the protocol given by Sahrawat et al. (Reference Sahrawat, Ravi Kumar and Rao2002). The protocol involved tri-acid digestion of ground seed samples and estimation of Fe and Zn concentrations in the aliquot by atomic absorption spectrometer (AAS Varian SpectrAA-20, Varian Techtron Pty. Limited, Mulgrave, Victoria, Australia). The standards for Fe and Zn were obtained from M/s Merck, Germany. Along with standards, internal control standards were also used for every batch of 20 samples. The detection limits were 0·2 mg/kg for Fe and 0·1 mg/kg for Zn. The Fe and Zn concentrations are expressed as defatted meal weight basis. Adequate precautions were taken to avoid any possible contamination of Fe and Zn at all the stages of analysis.
Protocol for determination of oil and protein contents
The oil content was determined by a nuclear magnetic resonance (NMR) spectrometer. High correlation (r=0·97) between the estimates of Soxhlet and NMR methods was reported by Jambunathan et al. (Reference Jambunathan, Raju and Barde1985). The protein content was determined using a Technicon Autoanalyser (Pulse Instrumentation Ltd, Saskatoon, Canada) (Singh & Jambunathan Reference Singh and Jambunathan1980).
Statistical analysis
For each trait, pooled analysis of variance over eight environments (combination of 2 years, two seasons and two stress conditions) using the SAS GLM procedure (SAS Inst. 2002–08, SAS V 9.2) was performed considering environments, replications, blocks and genotypes as fixed effects. Before pooling data over environments, the Bartlett χ 2 test was used to test homogeneity of error variance of all environments. Since heterogeneity among the environment variances was confirmed for all traits, data were appropriately transformed and pooled analysis was carried out. Adjusted means are the least-square means. Contrast analysis was done to compare (1) rainy season rainfed (RSRF) environment (mean of 2009 and 2010 RSRF environments) v. post-rainy season irrigated (PRSIR) environment (mean of 2009/10 and 2010/11 PRSIR environments), (2) RSRF environment v. post-rainy season moisture stressed (PRSS) environment (mean of 2009/10 and 2010/11 post-rainy season imposed moisture stressed environment), (3) PRSS environment v. PRSIR environment and (4) RSRF environment v. rainy season supplemental irrigation (RSSIR) environment (2009 and 2010 rainy season with irrigation as and when needed environments).
Since the G×E effect was significant, a genotype and genotype×environment (GGE) biplot (Yan & Tinker Reference Yan and Tinker2006) was drawn to study the performance of genotypes based on mean value and stability. A standard biplot is the scatter plot that graphically displays both the row factor and column factors of a two-way table data. A biplot graphically displays a matrix with application to principal component analysis (PCA) (Kroonenberg Reference Kroonenberg1995). In order to generate a biplot, a two-way table representing two factors was subjected to singular value decomposition. The singular value decomposition of a matrix X=(x ij)vxs is given by
 $$x_{ij} = \sum\limits_{k = 1}^r {u_{ik}} \lambda _k v_{kj} $$
where (u ik) is the element of the matrix U vxs characterizing rows, λ k is the singular value of a diagonal matrix L sxs, vkj is the element of the matrix V sxs characterizing the columns and r represents the rank of matrix X⩽min(v,s). PC scores for row and column factors were calculated after singular value partitioning of (x ij)vxs (Yan Reference Yan2002). A biplot was obtained using the first two components and the proportion of variation explained by them was calculated.
The fixed effect two-way model for analysing multi-environments genotype trials was:
 $$E(Y_{ij} ) = \mu + g_i {\rm} + e_j + (ge)_{ij} $$
where μ is the grand mean, g i and e j are the genotype and environmental main effects, respectively, and (ge)ij is the G×E effect. The sites regression model is given by Crossa & Cornelius (Reference Crossa and Cornelius1997) and Yan & Kang (Reference Yan and Kang2003):
 $$E(Y_{ij} ) = \mu + e_j + \sum\limits_{n = 1}^r {\xi _{in} ^*} \eta _{\,jn} ^* $$
where r is the number of PCs required to approximate the original data,  $\xi _{in}^* $ and $\eta _{\,jn}^* $ are the ith genotype and the jth environmental scores for PCn, respectively. In the site regression method, PCA is applied on residuals of an additive model with environment as the only main effect. Therefore, the residual term $\sum\nolimits_{n = 1}^r {\xi _{in}^*} \eta _{\,jn}^* $ contains the variation due to G and G×E. A two-dimensional biplot (Gabriel Reference Gabriel1971; Parsad et al. Reference Parsad, Crossa, Vargas, Bhatia, Parsad, Gupta, Bhar and Bhatia2007) derived from the above two-way table of residuals is called a GGE biplot (G plus G×E) (Yan et al. Reference Yan, Hunt, Sheng and Szlavnics2000). A GGE biplot graphically depicts the genotypic main effect (G) and the G×E effect contained in the multi-environment trials: they have been found very useful in understanding G×E, mega-environment identification and genotype recommendation.
Correlation coefficients among different traits over environments were calculated by the Pearson method using the SAS CORR procedure (SAS Institute 2008, SAS V9.2). The broad sense heritability (H 2) over environments was calculated as the ratio of genetic variance (V G) to total phenotypic variance (V P) (genotypic and environmental variances) given by the equation, H 2=H 2=V G/V P (Fehr Reference Fehr1991):
 $$V_{\rm p} {\rm =} \sigma _g^2 + (\sigma _{ge}^2 /e) + (\sigma _e^2 /re)$$
where  $\sigma _g^2 $ is the variance for genotype, $\sigma _{ge}^2 $ the variance for G×E, $\sigma _e^2 $ the error variance, e the number of environments and r the number of replications.
Heritability estimates were computed using SAS Version 9.2 (SAS Institute 2008, SAS V 9.2).
RESULTS
Iron and zinc status of soil in experimental plots
The Fe concentration in the soil of the experimental plots varied from 7·2 to 32·8 mg/kg and that of Zn from 2·47 to 9·75 mg/kg across the eight experiments. In all the experiments, the Fe and Zn concentrations of the soil were above critical limits (Fe 2·0 mg/kg and Zn 0·75 mg/kg, Olsen's method) (Muhr et al. Reference Muhr, Datta, Sankaran Bramony, Leley and Donahue1965). The soil pH of the experimental plots was between 7·1 and 7·9.
Combined analysis of variance
The combined analysis of variance showed significant differences among genotypes and environments and their interactions for Fe and Zn concentrations and other traits included in the study (Table 1). The environments are also compared based on the performance of genotypes for Fe and Zn concentrations and other traits (Table 1). Except for protein concentration in the RSRF v. PRSIR comparison, 100-seed weight in RSRF v. PRSS and Zn concentration in RSRF v. RSSIR, the difference in performance for all the traits was significant (P<0·05 or 0·01) in the aforementioned three comparisons and PRSS v. PRSIR. The mean performance of genotypes for nutritional and agronomic traits for individual environment over 2 years and mean over eight environments are given in Tables 2–6, respectively. The mean Fe concentration of genotypes over eight environments ranged from 42·8 to 58·2 mg/kg and that of Zn concentration between 55·3 and 81·0 mg/kg (Table 2).
Table 1. Combined analysis of variance for different traits included in the study on 64 peanut genotypes under different environments at ICRISAT, Patancheru, during the 2009–11 cropping season

d.f., degrees of freedom; NS, not significant; Fe, iron concentration (mg/kg); Zn, zinc concentration (mg/kg); PC, protein concentration (mg/g); OC, oil concentration (mg/g); SW, shelled weight per 100 g of pods; PY, pod yield (kg/ha); HSW, 100-seed weight (g).
Table 2. Mean Fe and Zn concentration of peanut genotypes (over 2 years) studied in four environments and the overall mean performance over eight environments

Fe, iron concentration (mg/kg); Zn, zinc concentration (mg/kg); RS, rainy season; PRS, post-rainy season; RF, rainfed environment; SIR, supplementary irrigation environment; IR, irrigated environment; S, imposed moisture stressed environment; CV, coefficient of variation expresses the variation as a percentage of the mean.
Table 3. Mean oil and protein concentration of peanut genotypes (over 2 years) studied in four environments and the overall mean performance over eight environments

PC, protein concentration (mg/g); OC, oil concentration (mg/g); RS, rainy season; PRS, post-rainy season; RF, rainfed environment; SIR, supplementary irrigation environment; IR, irrigated environment; S, imposed moisture stressed environment; CV, coefficient of variation expresses the variation as a percentage of the mean.
Table 4. Mean shelled weight per 100 g of pods for peanut genotypes (over 2 years) studied in four environments and the overall mean performance over eight environments
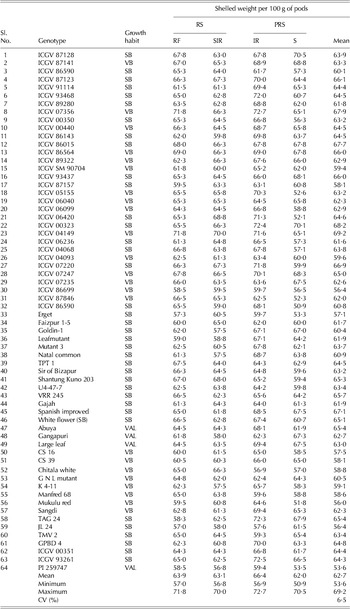
RS, rainy season; PRS, post-rainy season; RF, rainfed environment; SIR, supplementary irrigation environment; IR, irrigated environment; S, imposed moisture stressed environment; CV, coefficient of variation expresses the variation as a percentage of the mean.
Table 5. Mean pod yield of peanut genotypes (over 2 years) studied in four environments and the overall mean performance over eight environments
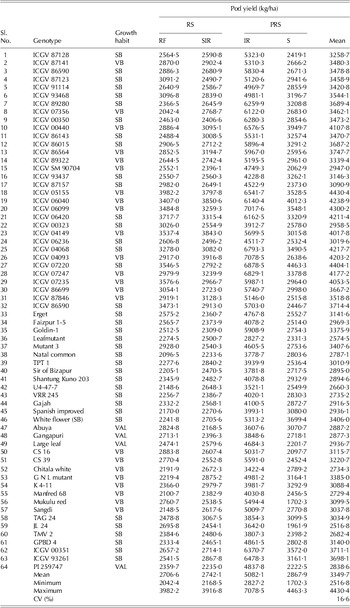
RS, rainy season; PRS, post-rainy season; RF, rainfed environment; SIR, supplementary irrigation environment; IR, irrigated environment; S, imposed moisture stressed environment; CV, coefficient of variation expresses the variation as a percentage of the mean.
Table 6. Mean 100-seed weight of peanut genotypes (over 2 years) studied in four environments and the overall mean performance over eight environments

HSW, 100-seed weight (g); RS, rainy season; PRS, post-rainy season; RF, rainfed environment; SIR, supplementary irrigation environment; IR, irrigated environment; S, imposed moisture stressed environment; CV, coefficient of variation expresses the variation as a percentage of the mean.
The range and mean of various traits under study for each environment and over environments are summarized in Table 7. The environmental mean for various traits across environments was between 46 and 53 mg/kg for Fe concentration, 56 and 81 mg/kg for Zn concentration, 480 and 530 mg/g for oil concentration, 200 and 280 mg/g for protein concentration, 57 and 67 g for shelled weight, 1·75 and 6·16 t/ha for pod yield and 37 and 55 g for 100-seed weight.
Table 7. Variability and heritability of traits included in the study based on the performance of 64 peanut genotypes under different environments at ICRISAT, Patancheru, during the 2009–11 cropping seasons

ENV, environment; RSRF, rainy season rainfed; RSSIR, rainy season supplemental irrigation; PRSIR, post-rainy season irrigated; PRSS, post-rainy season stress; R, range; M, mean; H, heritability in broad sense (%); Fe, iron concentration (mg/kg); Zn, zinc concentration (mg/kg); PC, protein concentration (mg/g); OC, oil concentration (mg/g); SW, shelled weight per 100 g of pods; PY, pod yield (kg/ha); HSW, 100-seed weight (g).
Heritability
The broad-sense heritability over eight environments was 0·81 for Fe concentration, 0·92 for Zn concentration, 0·81 for protein concentration, 0·92 for oil concentration, 0·70 for shelled weight, 0·82 for pod yield and 0·91 for 100-seed weight (Table 7). The zero values for heritability of Fe and Zn concentrations occurred in the 2010–11 post-rainy season under the irrigated conditions environment, where genotypic differences for these traits were not significant.
Genotypes stable for iron and zinc concentrations across environments
The GGE biplots were drawn only for Fe and Zn concentrations (Figs 1 and 2), the two main traits of interest in the present study. The genotypes were represented by the numbers 1–64, and the environments were represented by the year/season followed by growing conditions (stress (ST), irrigated (IR), rainfed (RF)) in the figures. The average tester coordinate (ATC) (line with an arrow head in the biplot figures) on the X-axis passes through the biplot origin and represents the average of the environments, which is defined by the average of PC1 and PC2 (first and second PCs) scores over all environments. The genotypes falling on or close to ATC are stable across the environments tested. All the genotypes on the right-hand side of the coordinates on the Y-axis, i.e. perpendicular to ATC, are the ones that perform above average, and the farther they are from the origin the better is their performance. A genotype falling away from the co-ordinate of the Y-axis and at the same time on or close to ATC is not only a good performer for the trait under consideration, but also stable across the environments. Based on this, the best genotypes that are stable across the environments are identified. The five best and relatively stable genotypes for Fe and Zn concentrations and their performance for other traits studied in different environments are given in Tables 8 and 9, respectively.
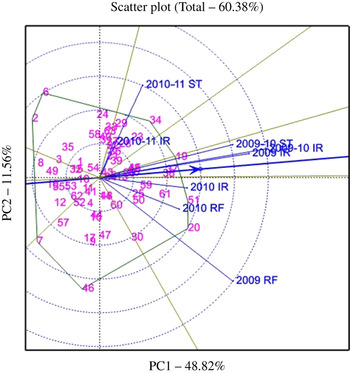
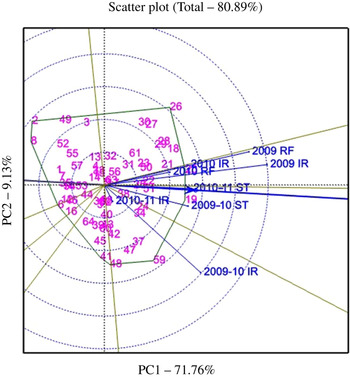
Table 8. The five stable and best-performing peanut genotypes for Fe concentration across eight environments at ICRISAT, Patancheru, during the 2009–11 cropping seasons

Fe, iron concentration (mg/kg); Zn, zinc concentration (mg/kg); PC, protein concentration (mg/g); OC, oil concentration (mg/g); SW, shelled weight per 100 g of pods; PY, pod yield (kg/ha); HSW, 100-seed weight (g).
Table 9. The five stable and best-performing peanut genotypes for Zn concentration across eight environments at ICRISAT, Patancheru, during the 2009–11 cropping seasons

Fe, iron concentration (mg/kg); Zn, zinc concentration (mg/kg); PC, protein concentration (mg/g); OC, oil concentration (mg/g); SW, shelled weight per 100 g of pods; PY, pod yield (kg/ha); HSW, 100-seed weight (g).
Correlation studies
The correlation values of different trait pairs over eight environments are given in Table 10. The Fe concentration showed significant (P<0·001) positive associations with oil and protein concentration and Zn concentration, and significant (P<0·001) negative associations with shelled weight (r=−0·22). However, with the exception of Zn concentration (r=0·535; P<0·001), the magnitude of the associations was low. Similarly, the Zn concentration was significantly (P<0·001) and positively correlated with pod yield, 100-seed weight, protein concentration, but significantly (P<0·001) and negatively with shelled weight. Except for protein concentration (r=0·678; P<0·001), the magnitudes of association between Zn concentration and the other traits were low. The protein and oil concentrations were significantly and negatively correlated (r=−0·554; P<0·001). The significant (P<0·001) and positive association between protein concentration and pod yield and 100-seed weight were of low magnitude. The pod yield was significantly positively associated with 100-seed weight (r=0·533; P<0·001) and shelled weight (r=0·342; P<0·001).
Table 10. Correlations between different traits studied in 64 peanut genotypes under different environments at ICRISAT, Patancheru, during the 2009–11 cropping seasons
P-values are given in parenthesis. NS, not significant; Fe, iron concentration (mg/kg); Zn, zinc concentration (mg/kg); PC, protein concentration (mg/g); OC, oil concentration (mg/g); SW, shelled weight per 100 g of pods; PY, pod yield (kg/ha); HSW, 100-seed weight (g).
DISCUSSION
Biofortification (delivery of micronutrients via micronutrient-dense crops) offers a cost-effective and sustainable approach for addressing the issue of micronutrient deficiencies in humans (Bouis Reference Bouis1996; Grusak & DellaPenna Reference Grusak and DellaPenna1999; House et al. Reference House, Welch, Beebe and Cheng2002). If there is sufficient genetic variation for the density of micronutrients in edible parts of the crop, biofortification can be achieved through plant breeding (Mayer et al. Reference Mayer, Pfeiffer and Beyer2008). Before a breeding programme is initiated to enhance Fe and Zn concentrations in peanut seeds, it is essential to study the extent of variability for these traits and their heritability and association with other important nutritional and yield parameters. Furthermore, genotypes that are rich in these micronutrients and have a stable performance across environments need to be identified for use as sources/parents to develop high-yielding cultivars with high Fe and Zn concentrations.
Iron and Zn concentrations in the soil, or their application to the soil/foliage, influence their concentration in the seeds (Joshi et al. Reference Joshi, Crossa, Arun, Chand, Trethowan, Vargas and Ortiz-Monasterio2010; Singh et al. Reference Singh, Chaudhari and Misra2011). The variation in Fe and Zn concentrations in the soil across environments will affect discrimination of genotypes for these micronutrients in the seed, as high-Fe and high-Zn genotypes will accumulate more of these nutrients than low-Fe and low-Zn genotypes grown at the same location during the same growing season environments (Gregorio Reference Gregorio2002). Therefore, conducting experiments with uniform levels of Fe and Zn in soil is essential to discriminate genotypes based on their Fe and Zn concentrations. In the present study, Fe and Zn are not applied to the experimental materials either as seed treatment or foliar application.
There is significant genetic variability for all the traits, including Fe and Zn concentrations in peanut seed that can be successfully exploited to develop high-Fe and high-Zn high-yielding cultivars. Both genotypes and environments were significantly different for Fe and Zn concentrations and other traits included in the study (Table 1). The G×E interaction was also significant for all the traits, but its magnitude was small. Upadhyaya et al. (Reference Upadhyaya, Dronavalli, Singh and Dwivedi2012a, Reference Upadhyaya, Mukri, Nadaf and Singhb) also recorded similar observations in their studies of peanut. The environment variance in the present study was the largest component in total variation, followed by genotype.
Compared to the RSRF environment, the yield-related traits (pod yield, shelled weight and 100-seed weight) and Zn concentration were higher in the PRSIR environment, whereas the reverse was true for Fe concentration and oil concentration. The difference for protein concentration was not significant. When RSRF and post-rainy season with imposed stress environments were compared, all traits except for oil concentration and shelled weight were significantly higher in the latter. Within the post-rainy season environments, Fe, Zn and protein concentrations were significantly higher in the imposed stress environment compared to the irrigated environment, whereas oil concentration and other yield parameters (pod yield, shelled weight and 100-seed weight) were higher in the irrigated environment. In the comparison of the two rainy season environments, Fe concentration, oil content and shelled weight were higher in the rainfed environment, whereas the rest, except for Zn concentration, were higher in the supplemental irrigated environment. In wild emmer wheat, Peleg et al. (Reference Peleg, Saranga, Yazici, Fahima, Ozturk and Cakmak2008) also observed significant genotype×irrigation interaction for Fe, Zn and protein concentration without affecting the overall mean of these traits under the two irrigation regimes. Variation in soil Fe and Zn concentrations (Gregorio Reference Gregorio2002; Joshi et al. Reference Joshi, Crossa, Arun, Chand, Trethowan, Vargas and Ortiz-Monasterio2010; Singh et al. Reference Singh, Chaudhari and Misra2011) and environmental factors such as temperature during the seed-filling stage (Joshi et al. Reference Joshi, Crossa, Arun, Chand, Trethowan, Vargas and Ortiz-Monasterio2010; Thavarajah et al. Reference Thavarajah, Thavarajah, See and Vandenberg2010; Singh et al. Reference Singh, Chaudhari and Misra2011) are reported to influence kernel Fe and Zn concentrations in groundnut.
The Fe concentration in the genotypes over eight environments was up to 58 mg/kg and that of Zn was up to 81 mg/kg (Table 2). The range for these two traits expressed in the ICRISAT mini-core collection of 184 accessions of peanut belonging to both subspecies, A. fastigiata and A. hypogaea, was from 18·3 to 30·8 mg/kg for Fe concentration and from 28·4 to 43·8 mg/kg for Zn concentration (Upadhyaya et al. Reference Upadhyaya, Dronavalli, Singh and Dwivedi2012a). Based on one environment data from 20 peanut varieties belonging to two subspecies in Ghana, Asibuo et al. (Reference Asibuo, Akromah, Safo-Kantanka, Adu-Dapaah, Ohemeng-Dapaah and Agyeman2008) reported a range of 2–37 mg/kg for Fe and 0–65 mg/kg for Zn concentration in seed. Kintampo Local was the variety lowest in seed concentration of both Zn and Fe in Ghana. The range of Zn seed concentration in the study on 70 genotypes by Lal & Singh (Reference Lal and Singh2007) in India was from 11 to 77 mg/kg and in the study of Singh et al. (Reference Singh, Chaudhari and Misra2011) on 60 genotypes it was from 32 to 67 mg/kg. Three genotypes, Gangapuri, ICGV 87141 (ICGS 76) and ICGV 87128 (ICGS 44), included in the present study were also studied by Upadhyaya et al. (Reference Upadhyaya, Dronavalli, Singh and Dwivedi2012a). The Fe and Zn concentration levels reported by Upadhyaya et al. (Reference Upadhyaya, Dronavalli, Singh and Dwivedi2012a) in these genotypes are similar to that observed in the present study when expressed on defatted meal basis. The oil concentration in groundnut genotypes shows a large environmental influence and procedures of estimating oil concentration can also introduce errors; therefore, it may be desirable to express Fe and Zn concentrations on a defatted meal basis.
The broad-sense heritability for Fe and Zn concentrations was high, indicating possible gains through selection. Similarly, the heritability was high for protein concentration and kernel oil content as well as for yield parameters. In spite of highly significant environmental effects, the heritability values were high due to the low magnitude of G×E interactions for different traits included in the study. Based on their study of a mini-core collection of peanut, Upadhyaya et al. (Reference Upadhyaya, Dronavalli, Singh and Dwivedi2012a) also reported high heritability (>0·70) for Fe and Zn concentrations. However, the estimates of broad-sense heritability in a study are specific to the population used in the study and the environment under which the study is conducted, and can therefore not be generalized for the trait. In other crops, such as spring wheat, a strong G×E interaction and very low broad sense heritability for Fe and Zn concentrations have been reported (Joshi et al. Reference Joshi, Crossa, Arun, Chand, Trethowan, Vargas and Ortiz-Monasterio2010).
For Fe concentration, the five best and relatively stable genotypes are Mutant 3, Natal Common, ICGV 06040, CS 39 and ICGV 06099 in order of their stability. Among these, Mutant 3 and Natal Common were highly stable followed by ICGV 06040 and CS 39. ICGV 06099, although a high performer for Fe concentration, was relatively less stable than the other four genotypes. Similarly, for Zn concentration, the stable genotypes included ICGV 06040, ICGV 06099, ICGV 06420, ICGV 05155 and ICGV 04093. ICGV 06040 and ICGV 06099 were not only highly stable but also high performers for Zn concentration. When both Fe and Zn were considered together, ICGV 06099 and ICGV 06040 were stable genotypes across environments with high yield and high concentration of both the micronutrients.
The absence of association, or low association, between pod yield and Fe and Zn concentrations and the significant positive association between Fe and Zn concentrations indicated that these traits can be improved simultaneously. The same holds true for oil concentration, which can also be improved simultaneously with Fe and Zn concentrations. However, an increase in oil concentration will have an adverse impact on protein concentration. Significant positive associations between Fe and Zn concentrations in seed have been reported in several crops (common bean: Gregorio Reference Gregorio2002; House et al. Reference House, Welch, Beebe and Cheng2002; lotus: Klein & Grusak Reference Klein and Grusak2009; sorghum: Ashok Kumar et al. Reference Ashok Kumar, Reddy, Ramaiah, Reddy, Sahrawat and Upadhyaya2009; Reddy et al. Reference Reddy, Reddy, Ashok Kumar, Ramesh, Sahrawat and Venkateswara Rao2010; wild emmer wheat: Peleg et al. Reference Peleg, Saranga, Yazici, Fahima, Ozturk and Cakmak2008; common wheat: Morgounov et al. Reference Morgounov, Gómez-Becerra, Abugalieva, Dzhunusova, Yessimbekova, Munimjanov, Zelenskiy, Ozturk and Cakmak2007 and maize: Maziya-Dixon et al. Reference Maziya-Dixon, Kling, Menkir and Dixon2000), including peanut (Upadhyaya et al. Reference Upadhyaya, Dronavalli, Singh and Dwivedi2012a). Interestingly, when a subset of 20 peanut genotypes with high concentrations of Fe and Zn was studied to determine correlations, the correlation coefficient between Fe and Zn concentrations was not significant (data not given). Thus, when attempting to improve both Fe and Zn concentrations, the selection should be based on the estimation of both Fe and Zn concentrations in the seed, because, though a positive association was observed in general, the same did not hold good for high Fe and Zn genotypes. Similarly, no association was observed between Fe and Zn concentrations with oil and protein concentration, 100-seed weight, pod yield and shelled weight. Thus, all the traits can be improved simultaneously.
No studies on the inheritance of Fe and Zn concentrations in peanut have been reported in the literature, but they are available for other crops as reviewed in the Introduction section of the present paper. In inter-specific crosses of common bean, the inheritance of Fe concentration was suggested to be quantitative (Guzmán-Maldonado et al. Reference Guzmán-Maldonado, Martínez, Acosta-Gallegos, Guevara-Lara and Paredes-Lopez2003), while simple inheritance was suggested for Zn concentration (Cichy et al. Reference Cichy, Forster, Grafton and Hosfield2005). Blair et al. (Reference Blair, Astudillo, Grusak, Graham and Beebe2009) reported five QTLs for Fe and six QTLs for Zn concentration clustered on the linkage group B11, explaining up to 0·48 of phenotypic variance, suggesting the presence of an important locus useful for marker assisted selection in bean. In rice, where the presence of additive and dominant gene effects, environmental effects and reciprocal effects was reported for Fe concentration, Gregorio (Reference Gregorio2002) suggested a delay in the selection for high Fe in the later generations while following the bulk breeding method in early generations for selection for agronomic traits: alternatively, he suggested that a single seed descent method could be followed. To minimize the adverse effect of the reported strong G×E interactions on the genetic enhancement of Fe and Zn concentrations in wheat seeds, Ortiz-Monasterio et al. (Reference Ortiz-Monasterio, Palacios-Rojas, Meng, Pixley, Trethowan and Pena2007) suggested the use of a systematic check, alpha lattice design and spatial analyses of segregating and advanced populations, and application of Zn fertilizer (foliar or soil application) to harmonize soil Zn concentration. Although G×E interaction for Fe and Zn concentrations in the peanut seeds in the present study was significant but relatively small, it would be advisable to adopt these strategies in genetic enhancement of these micronutrients in peanut as well. While improving Fe and Zn concentrations in plants, it would be desirable to also pay attention to reducing bio-inhibitors to enhance the bioavailability of Fe and Zn in human diets.
CONCLUSIONS
Significant genetic variability for kernel Fe and Zn concentrations, protein and oil concentration and their high heritability favour genetic enhancement of these traits in peanut. The concentration of Fe is 1·4-fold higher than the normal genotypes and that of Zn 1·5-fold higher. Similarly, protein concentration is 1·1-fold higher and oil concentration is 1·2-fold higher than the normal genotypes. Barring associations between protein content with oil content, and shelled weight with Fe and Zn concentrations, which are negative, all other associations are either positive, low or absent. Thus, it is possible to simultaneously improve Fe and Zn concentrations, pod yield and 100-seed weight with either protein or oil concentration. Genotypes, ICGV 06099 and ICGV 06040, have high concentrations of both Fe and Zn in their seeds, and are stable across environments. They are also high yielding. Because of these characteristics, these genotypes make an ideal choice as parents in a breeding programme aiming to improve Fe and Zn concentrations in peanut seeds. They can also be used in developing mapping populations to identify QTLs associated with high Fe and Zn concentrations in peanut seed.


