


The metabolic syndrome (MetS) is a clustering of cardiometabolic risk factors, namely central obesity, hyperglycaemia, hypertension and dyslipidaemia (hypertriacylglycerolaemia and reduced HDL-cholesterol)( Reference Grundy 1 ). By increasing CVD and type 2 diabetes risk by 1·7- and 5-fold( Reference Galassi, Reynolds and He 2 , Reference Alberti, Eckel and Grundy 3 ), respectively, the MetS is a threat to public health, with rising all-cause mortality rates, disability and healthcare costs( Reference Appels and Vandenbroucke 4 – Reference Wolf and Colditz 12 ). Dairy product consumption’s effect on the MetS remains controversial( Reference Crichton, Bryan and Buckley 13 ). Among dairy product constituents, SFA shows deleterious effect on weight and CVD( Reference Bray and Popkin 14 – Reference Miller, Lindeman and Wallace 18 ), whereas Ca and Mg may carry beneficial effects( Reference Crichton, Bryan and Buckley 13 , Reference Pfeuffer and Schrezenmeir 19 – Reference Pal and Radavelli-Bagatini 27 ). Notably, dietary Ca, a key weight regulator, affects adipocyte intracellular Ca concentration, thus decreasing fatty acid synthesis, while up-regulating lipolysis and reducing net TAG stores( Reference Dugan and Fernandez 24 , Reference Pfeuffer and Schrezenmeir 28 ).
Most guidelines recommend 2–3 dairy product servings/d, a goal unreachable by many US adults( Reference Da Silva and Rudkowska 23 ). Optimal dairy product intake may prevent adverse health outcomes and related risk factors, including obesity, central obesity and the MetS( Reference Da Silva and Rudkowska 23 ). Recent observational and experimental studies suggest that dairy product and Ca consumption may reduce obesity risk( Reference Marques-Vidal, Goncalves and Dias 29 , Reference Rosell, Johansson and Berglund 30 ), excess central( Reference Elwood, Pickering and Fehily 31 ) fat distribution, type 2 diabetes( Reference Choi, Willett and Stampfer 32 , Reference He, Liu and Daviglus 33 ), hypertension( Reference Azadbakht, Mirmiran and Esmaillzadeh 34 ) and the MetS( Reference Elwood, Pickering and Fehily 31 , Reference Azadbakht, Mirmiran and Esmaillzadeh 34 – Reference van Meijl and Mensink 68 ), whereas mixed or negative finding were reported by others( Reference Steffen, Kroenke and Yu 69 – Reference Crichton, Howe and Buckley 83 ).
To our knowledge, our study is the first to assess, in an urban population, the association between consumption of dairy foods and related nutrients and obesity, central obesity and the MetS, with repeated measures on dietary and metabolic parameters. We further examined socio-demographic correlates of dairy foods, dairy-related nutrient intakes and metabolic disturbances (MetD). Finally, we tested sex- and race-specific associations between dairy product intake and MetD.
Methods
Database
Initiated in 2004, the Healthy Aging in Neighborhoods of Diversity across the Life Span (HANDLS) study is a prospective, population-based, longitudinal study. The sample is a fixed cohort of participants based on household screenings from an area probability sample of thirteen neighbourhoods (areas of contiguous census tracts) in Baltimore City, MD. Neighbourhoods were selected to yield sufficient numbers of participants to fill a four-way design of race, sex, age and socio-economic status assessed by 125 % of the Federal poverty level. Recruitment and sampling contractors produced household listings to identify residential dwellings in each neighbourhood. The contractors performed doorstep interviews, identified eligible persons in each household, selected one of two eligible persons per household and invited the eligible candidates to participate in HANDLS. Participants had to be aged 30–64 years, to self-identify as White or African-American, have the ability to give informed consent, perform at least five study measures and present valid picture identification. Individuals were excluded from the study if they were pregnant, within 6 months of active cancer treatment, or multiethnic individuals who did not identify strongly with either the Black or White race( Reference Evans, Lepkowski and Powe 84 ). The present study uses baseline visit 1 (V1: 2004–2009) and the first follow-up visit 2 (V2: 2009–2013). All participants provided written informed consent, after accessing a protocol booklet in layman’s terms and a video detailing all procedures and future re-contacts. HANDLS study was ethically approved by the National Institute on Environmental Health Sciences, National Institutes of Health Institutional Review Board.
Study participants
Of the original HANDLS sample (n 3720), 24-h dietary recall data were collected for each of the two visits (i.e. V1 and V2) for 1513 participants (sample 2, Fig. 1). Among those, data were complete on metabolic outcomes at each of the two visits as outlined in Fig. 1 (samples 3a–3h). The final analytic samples consisted of individuals with complete data on dietary intakes and metabolic outcomes at both visits (sample 5h, Fig. 1: n 1371), and MetD-free participants for each of the metabolic outcomes (samples 6a, 6b (n 588–859) and 7a–7d (n 915–1171), Fig. 1). Mean follow-up time with their standard errors was estimated at 4·62 (se 0·95) years (range: 0·42–8·20).
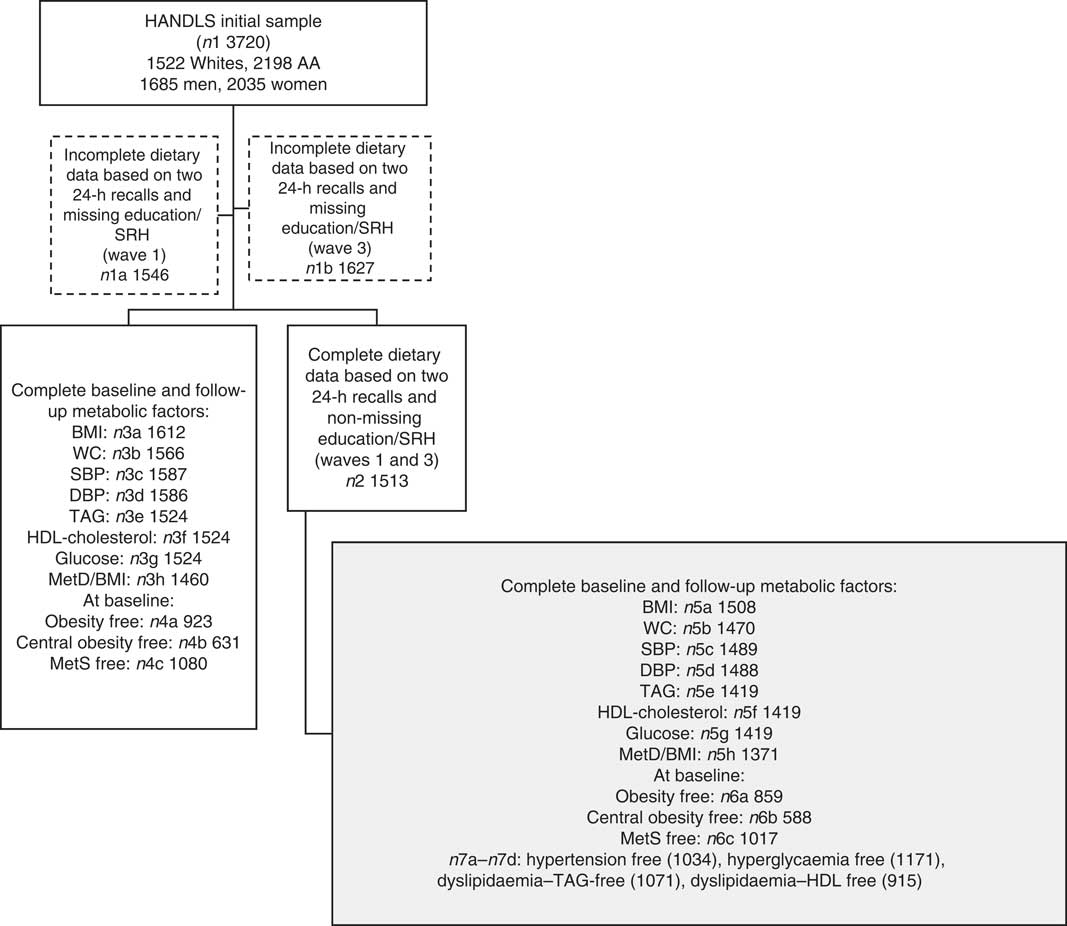
Fig. 1 Participant flow chart. HANDLS, Healthy Aging in Neighborhoods of Diversity across the Life Span; AA, African-Americans; SRH, self-rated health; WC, waist circumference; SBP, systolic blood pressure; DBP, diastolic blood pressure; MetD, metabolic disturbances; MetS, metabolic syndrome.
Dietary assessment
At each visit, the average nutrient and food group intakes from two 24-h dietary recalls were estimated. Each 24-h dietary recall was obtained using the US Department of Agriculture (USDA) Automated Multiple Pass Method, a computerised structured interview( Reference Moshfegh, Rhodes and Baer 85 ) utilising measurement aids (e.g. cups, spoons, ruler, illustrated Food Model Booklet). At first visit, both recalls were administered in-person by trained interviewers, 4–10 d apart, whereas at follow-up (visit 2) the second recall was administered using telephone interviews. Using Survey Net, trained nutrition professionals matched foods consumed with eight-digit codes from the Food and Nutrient Database for Dietary Studies version 3.0( 86 ), and MyPyramid equivalents database was used to create food groups (MPED 2: http://www.ars.usda.gov/SP2UserFiles/Place/80400530/pdf/mped/mped2_doc.pdf).
Dietary exposures
Dietary exposures of interest included the following: (1) dairy foods, namely, total dairy product intake (servings/d), total fluid milk intake (servings/d), total cheese intake (servings/d) and total yogurt intake (servings/d) – one serving of dairy food is calculated in terms of cup equivalents, and thus for milk a serving is 1 cup, whereas for cheese it ranges between 1·5 oz for hard cheese to two cups for ricotta cheese, and for yogurt, on the other hand, a serving is 1 cup or 8 fl oz; and (2) dairy-related nutrients, namely Ca (mg/d), Mg (mg/d), P (mg/d) and dairy product fat % of total fat (myristic acid (14:0)×100/total fat). Fluid milk was also categorised into whole v. reduced fat milk (g/d), whereas DRI of Ca and total dairy products consumption were estimated. Key exposures were measured as baseline (V1) values and annualised rates of change (i.e. Δdairy products=(dairy productfollow−dairy productbase)/(Agefollow−Agebase)).
Anthropometric measures and metabolic outcome variables
BMI and waist circumference
BMI (weight/height2 (kg/m2)) was calculated for each participant using measured weight and height. Waist circumference (WC (cm)) was measured using a tape measure starting from the hip bone and wrapping around the waist at the level of the navel.
Systolic and diastolic blood pressure
Systolic and diastolic blood pressure levels (SBP and DBP) were measured by averaging right and left sitting non-invasive assessments using brachial artery auscultation with an aneroid manometer, a stethoscope and an inflatable cuff.
Other metabolic risk factors
After an overnight fast (8–12 h), blood was drawn and collected from an antecubital vein. Total cholesterol, HDL-cholesterol, TAG and fasting glucose were assessed using a spectrophotometer (AU5400 High-Volume Chemistry Immuno Analyzer; Olympus Global).
Classification of key health outcomes
Obesity was defined as BMI≥30 kg/m2, and central obesity as WC≥102 cm or 40 inches (men), ≥88 cm or 35 inches (women)( Reference Wang and Beydoun 87 ).
Participants were classified as MetS-positive if they screened positive on at least three of five conditions( Reference Grundy 1 ) – (1) central obesity (see above); (2) dyslipidaemia: TAG≥1·695 mmol/l (150 mg/dl); (3) dyslipidaemia: HDL-cholesterol<40 mg/dl (male), <50 mg/dl (female); (4) blood pressure≥130/85 mmHg; and (5) fasting plasma glucose≥6·1 mmol/l (110 mg/dl)( 88 ). Similarly, continuous annual rates of change (Δ) in metabolic outcomes were considered, namely number of MetD, BMI, WC, SBP, DBP, TAG, HDL-cholesterol and glucose. Binary incident outcomes were obesity, central obesity, the MetS and other MetD (i.e. hypertension, dyslipidaemia–TAG, dyslipidaemia–HDL and hyperglycaemia).
Covariates
Covariates included in our analyses were baseline age, sex, race, poverty status, education, self-rated health, smoking and drug use among fixed or baseline covariates. Annual rates of change (Δ) in covariates were considered, except when baseline dairy product exposures were examined. Those were total energy intake (kJ/d (kcal/d)), caffeine intake (mg/d) and MyPyramid equivalents of total fruit, dark green and orange vegetables, whole and non-whole grains, legumes, nuts/seeds, soya, total meat/poultry/fish, eggs, discretionary solid fat and oils (g), added sugars (teaspoons) and alcoholic beverages (servings).
Statistical analyses
Using Stata release 14.0( 89 ), we first described the sex and race differences in dairy product consumption and metabolic outcomes, comparing means using independent samples t-tests, and testing associations with χ 2 tests. Second, Cox proportional hazards (PH) regression models were fit to test independent associations of socio-demographic factors with dairy product consumption and incident metabolic outcomes.
Importantly, two sets of models included as exposures dairy foods (model 1) and dairy-related nutrients (model 2), respectively. Cox PH models tested associations of baseline dairy products (V1) and Δdairy product exposures with incident binary metabolic outcomes. To account for potential selection bias in our multivariate models due to the non-random selection of participants with complete data from the target study population, a two-stage Heckman selection process was used( Reference Heckman 90 ). A probit model was constructed to obtain an inverse mills ratio at the first stage (derived from the predicted probability of being selected, conditional on the covariates in the probit model, mainly baseline age, sex, race, poverty status and education), as was done in earlier studies( Reference Beydoun, Canas and Dore 91 – Reference Beydoun, Beydoun and Rostant 93 ). This inverse mills ratio was then entered as a covariate in the main models to adjust for sample selectivity. Type I error was set at 0·05.
Results
Baseline study characteristics
Key study characteristics and socio-demographic correlates of dairy product consumption and metabolic outcomes are presented in Table 1. Our final sample of 1371 urban adults had a mean age of 48·4 with an se of 0·24, with 40·6 % being men and 48·5 % being African-American. Only 36·6 % had>High school educational attainment and the proportion above poverty was 60·1 %. About 23 % reported their health as being fair or poor. Socio-economic, lifestyle and health-related factors differed markedly by sex and by race, reflecting lower SES among African-Americans and women, and higher prevalence of risky healthy behaviours among men as well as among African-Americans. In terms of dietary intakes, overall, mean baseline dairy product servings/d was 1·02 (fluid milk (0·51), cheese (0·48) and yogurt (0·03)). Moreover, the three servings/d goal for dairy product consumption was reached by 6·6 % of men and 3·8 % of women (P<0·05, χ 2 test), with lower proportions among African-Americans v. Whites, who consistently consumed less Ca, Mg, P and dairy product fat, as is the case for women v. men. With men having higher energetic intake than women, baseline intakes of orange vegetables, whole grains, nuts/seeds, soya and caffeine were lower among African-Americans, with a reverse trend observed for meat/poultry/fish and eggs.
Table 1 Sex and racial differences in intakes of dairy foods and related nutrients, obesity and metabolic outcomes: Healthy Aging in Neighborhoods of Diversity Across the Life Span (HANDLS) 2004–2009 and 2009–2013 (Percentages; mean values with their standard errors)

V1, baseline visit 1; Δ, annual rate of change; V2, first follow-up visit 2; SBP, systolic blood pressure; DBP, diastolic blood pressure; MetS, metabolic syndrome.
* P<0·05 for testing the null hypothesis that means or proportions are the same between groups.
† To convert kcal to kJ, multiply by 4·184. To convert HDL-cholesterol in mg/dl to mmol/l, multiply by 0·0259. To convert TAG in mg/dl to mmol/l, multiply by 0·0113. To convert glucose in mg/dl to mmol/l, multiply by 0·0555.
‡ Defined as waist circumference >102 cm for men and >88 cm for women.
§ Defined based on National Cholesterol Education Program Adult Treatment Panel III described in the ‘Methods’ section.
∥ Three or more metabolic disturbances as listed above represent the MetS. Metabolic disturbances may range between 0 and 5.
Furthermore, hypertension was more prevalent among African-Americans v. Whites, whereas lipid profiles reflected poorer cardiometabolic health among Whites. Central obesity and the MetS were also more prevalent among Whites, although incidence proportions in metabolic outcomes did not differ by race.
Socio-demographic correlates of dairy product consumption and metabolic outcomes
Moreover, dairy product intake was higher among Whites and those with>high school education, independently of age, sex and poverty status (Table 2). Nevertheless, above poverty status was directly linked to obesity and central obesity incidence, particularly among women. Both central obesity and MetS incidence rates increased with age, consistently among women, who simultaneously had lower incidence rates of both outcomes compared with men. Most notably, MetS incidence was lower among African-Americans v. Whites.
Table 2 Associations of socio-demographic characteristics with baseline dairy product consumption, incident obesity, central obesity and the metabolic syndrome: Healthy Aging in Neighborhoods of Diversity Across the Life Span (HANDLS), 2004–2009 and 2009–2013* (Regression coefficients (β) with their standard errors; hazard ratios (HR) and 95 % confidence intervals)

* See Table 1 for definitions of obesity, central obesity and the metabolic syndrome. These were based on multivariate regression analyses. Linear regression was conducted for dairy product consumption, and Cox proportional hazards regression models was conducted for obesity, central obesity and the metabolic syndrome.
Dairy product consumption and incident metabolic outcomes
Furthermore, in the overall population, cheese and yogurt (both V1 and Δ) were directly related to central obesity incidence (Table 3), whereas Δdairy product fat was positively associated with dyslipidaemia disturbances (TAG and HDL) and with MetS incidence. Moreover, higher milk consumption (both V1 and Δ) was inversely related to dyslipidaemia–TAG, whereas only its baseline value (i.e. All milk (V1)) was inversely related to the MetS, while being directly related to dyslipidaemia–HDL.
Table 3 5-Year cases of incident metabolic disturbances by baseline and annual rates of change in dairy food and dairy-related nutrient intake among disturbance-free (at baseline) Healthy Aging in Neighborhoods of Diversity Across the Life Span (HANDLS) participants: HANDLS 2004–2009 and 2009–2013Footnote * (Multivariable-adjusted hazard ratios (HR) and 95 % confidence intervals)
V1, baseline visit 1; AA, African-Americans; Δ, annual rate of change.
* See Table 1 for scaling of exposure variables in each model. Each model controls for age, sex, race, socio-economic status (education and poverty status), energy intake at baseline, current smoking, current drug use and self-rated health. Additional control was also made on the following major food group servings and nutrients (V1 and Δ): energy intake, total fruit, dark green vegetables, deep yellow vegetables, whole grains, non-whole grains, legumes, nuts/seeds, soya, total meat/poultry/fish, eggs, grams of discretionary solid fat, grams of discretionary oils, added sugars (teaspoons), alcoholic beverages (servings) and mg of caffeine.
† Based on National Cholesterol Education Program Adult Treatment Panel III criteria described in ‘Methods’ section.
‡ P<0·05 for null hypothesis that logeHR=0.
§ P<0·05 for testing effect modification by sex, in separate models using interaction terms between exposure and each of the two effect modifiers.
|| P<0·05 for testing effect modification by race, in separate models using interaction terms between exposure and each of the two effect modifiers.
Sex-specific findings indicated some significant differentials in the relationship between dairy product intakes (including dairy-related nutrients) and MetD. Most notably, Δdairy product fat was inversely related with obesity among men while being positively related to dyslipidaemia–HDL among women (P<0·05 for exposure×sex interaction in a separate model with main effects).
Other relationships were race specific, including a 14 % increased risk of central obesity with each 0·20 serving increase in baseline milk intake, observed in Whites only. Moreover, the positive association between Δdairy product fat and the MetS, as well as with dyslipidaemia–HDL, was restricted to Whites.
Discussion
Main findings
Our study uncovered some important findings regarding the relationship between dairy product consumption and various MetD, including the MetS. Specifically, in the overall urban adult population, both cheese and yogurt (V1 and Δ) were associated with an increased risk of central obesity. Baseline fluid milk intake (V1 in cup equivalents) was inversely related to the MetS (hazard ratio (HR) 0·86; 95 % CI 0·78, 0·94), specifically to dyslipidaemia–TAG (HR 0·89; 95 % CI 0·81, 0·99), although it was directly associated with dyslipidaemia–HDL-cholesterol (HR 1·10; 95 % CI 1·01, 1·21). Furthermore, ΔCa and ΔP were inversely related to dyslipidaemia–HDL and MetS incidence, respectively, whereas Δdairy product fat was positively associated with incident TAG–dyslipidaemia and HDL-cholesterol–dyslipidaemia and the MetS. A few of those associations were sex and race specific.
Previous studies
Among recent cross-sectional studies, sixteen found an inverse relationship between dairy product consumption and adverse metabolic outcomes (positive findings)( Reference Azadbakht, Mirmiran and Esmaillzadeh 34 , Reference Liu, Song and Ford 47 – Reference Drehmer, Pereira and Schmidt 62 ), whereas five had mixed findings( Reference Beydoun, Gary and Caballero 71 , Reference Snijder, van der Heijden and van Dam 74 – Reference Shin, Choi and Kim 78 ) and the remaining studies failed to detect an association in the expected direction( Reference Sun, Buys and Shen 79 – Reference Ghotboddin Mohammadi, Mirmiran and Bahadoran 81 ). Among positive findings, a study of 827 Iranian adults (18–74 years) concluded that the uppermost quartile of dairy product consumption (v. lowest) had reduced odds of central obesity, hypertension and the MetS, an association primarily mediated by Ca intake( Reference Azadbakht, Mirmiran and Esmaillzadeh 34 ), as was replicated in a separate study( Reference Martins, Kac and Silva 60 ). In a US study of adult women (n 10 006, ≥45 years), both Ca and dairy products’ intakes were inversely related to the MetS, in multivariate-adjusted models( Reference Liu, Song and Ford 47 ). Similarly, a large Korean study (n 4862, ≥19 years) replicated those findings for milk and yogurt intake( Reference Kim 54 ). Moreover, a large study of middle-aged adults (Brazilian Longitudinal Study of Adult Health, n 9835) concluded that a higher intake of total and full-fat dairy foods was inversely related to the MetS, and that dairy product SFA may be mediating this effect. Specifically, dairy product consumption was inversely related to blood pressure, glucose and TAG, and total dairy product consumption was positively associated with HDL-cholesterol among women( Reference Drehmer, Pereira and Schmidt 62 ). Mixed findings were echoed in a recent national study of US adults (the National Health and Nutrition Examination Surveys (NHANES 1999–2004)), whereby metabolic disorders were inversely related to whole milk, yogurt, Ca and Mg but positively associated with low-fat milk, cheese and P intakes( Reference Beydoun, Gary and Caballero 71 ). Using NHANES 2001–2010, another study concluded that women meeting the RDA for Mg and Ca have lower odds of the MetS, unlike men who required above-RDA Ca intakes to be protected( Reference Moore-Schiltz, Albert and Singer 77 ). The inverse relationship between full-fat dairy product consumption and insulin resistance was also observed in a study of 496 Japanese adults( Reference Akter, Kurotani and Nanri 53 ). Studies examining whole dietary patterns also suggested an inverse relationship of the dairy product-rich pattern with the MetS( Reference Hong, Song and Lee 51 , Reference Setayeshgar, Whiting and Vatanparast 52 , Reference Arisawa, Uemura and Yamaguchi 55 , Reference Choi, Woo and Lee 58 , Reference Grosso, Stepaniak and Micek 59 ).
Most selected cohort studies( Reference Pereira, Jacobs and Van Horn 35 , Reference Babio, Becerra-Tomas and Martinez-Gonzalez 37 – Reference Alonso, Nettleton and Ix 46 , Reference Sayon-Orea, Bes-Rastrollo and Marti 72 , Reference Snijder, van Dam and Stehouwer 73 ) concluded that dairy product consumption, dairy-related nutrients or dietary patterns that include dairy product consumption are inversely related to the risk of the MetS and various MetD. For instance, after an average 3·2 years of follow-up, incident MetS among 1868 older adults was inversely related to low-fat dairy product intake and yogurt but positively related to cheese intake( Reference Babio, Becerra-Tomas and Martinez-Gonzalez 37 ). Similarly, using data from the Framingham Offspring study (n 3440, baseline mean age: 54·5 years), Wang et al. found that total dairy product and yogurt intake were both related to over-time weight loss, as well as reduction in WC( Reference Wang, Troy and Rogers 38 ). In another follow-up study of Korean middle-aged adults (n 7240, average follow-up time: 45 months), higher baseline dairy product intake was associated with lower MetS risk and a reduction in WC over time( Reference Shin, Yoon and Lee 39 ). Regular fat dairy product intake was associated with lower MetS incidence, as was found in our secondary analysis, in another recent study of Australian middle-aged adults( Reference Louie, Flood and Rangan 40 ). In a large study combining data from the Atherosclerosis Risk in Communities study and the Multi-Ethnic Study of Atherosclerosis (n 13 444), incident hypertension was inversely related to P, particularly when derived from dairy products( Reference Alonso, Nettleton and Ix 46 ). Two selected cohort studies found little evidence of an association between dairy product consumption and MetD( Reference Sayon-Orea, Bes-Rastrollo and Marti 72 , Reference Snijder, van Dam and Stehouwer 73 ).
Most relevant intervention trials( Reference Drouin-Chartier, Gagnon and Labonte 63 – Reference van Meijl and Mensink 68 , Reference van Meijl and Mensink 82 , Reference Crichton, Howe and Buckley 83 ) detected a protective effect of dairy product consumption on metabolic end points. In a 6- to 12-week follow-up study that randomised adults into three groups (n 25 (glucose control), n 20 (casein group), n 25 (whey group)), there were consistently faster reductions in TAG, insulin, insulin resistance and LDL-cholesterol over time in the whey group compared with controls( Reference Pal, Ellis and Dhaliwal 66 ). Those results were replicated in another smaller study (n 20 obese/overweight postmenopausal women) comparing whey and caseinate intervention v. glucose control on a wider array of metabolic outcomes. The protective effect of caseinate was found by a reduction in post-prandial TAG over time( Reference Pal, Ellis and Ho 67 ). Nevertheless, in a randomised cross-over study of thirty-five subjects (mean age 49·5 years), the milk/yogurt arm (v. fruit juice, fruit biscuit control) had limited effect on metabolic risk factors( Reference van Meijl and Mensink 82 ). This null finding was also replicated in an Australian randomised cross-over study (n 71, 18–75 years) of high dairy product intake v. low dairy product intake after 12 months of follow-up, measuring glucose, TAG and HDL-cholesterol among others( Reference Crichton, Howe and Buckley 83 ).
Biological plausibility
Some of our key findings have plausible biological underlying mechanisms( Reference Astrup 21 , Reference Dugan and Fernandez 24 , Reference Kratz, Baars and Guyenet 26 – Reference Pfeuffer and Schrezenmeir 28 ). First, dairy products provides half of dietary Ca( Reference Dugan and Fernandez 24 ) and 1·1 μg/100 ml of vitamin D, which promotes Ca gut absorption and helps maintain adequate serum Ca and phosphate concentrations, thus enhancing bone mineralisation and preventing hypocalcaemia and secondary hyperparathyroidism( Reference Dugan and Fernandez 24 ). In fact, serum Ca is tightly regulated whereby minor decreases trigger normalisation by parathyroid hormone, which activates kidney 1α hydroxylase, thus converting 25-hydroxyvitamin D to its active form 1,25-dihydroxyvitamin D (1,25-OH2-D)( Reference Dugan and Fernandez 24 , Reference Zemel 94 ). The latter induces rapid Ca ions (Ca2+) increase, inhibiting PPAR-γ expression, CCAAT/enhancer-binding protein α and steroid regulatory element-binding protein, which are strong inhibitory signals for adipogenesis and inflammation( Reference Jensen, Farach-Carson and Kenaley 95 ). A similar mechanism may also be responsible for the calciuretic effect of high-salt diets, which increase 1,25-OH2-D and vascular smooth muscle intracellular Ca, thereby increasing peripheral vascular resistance and blood pressure( Reference Zemel 96 ). Second, dairy product are an important source of beneficial microbiota and two proteins, whey and casein, which along with branched-chain amino acids (e.g. leucine) improve complex indigestible polysaccharide utilisation and enhance the anti-obesity effects of Ca by suppressing plasma lipids, blood pressure, improving glucose homoeostasis and ameliorating pro-inflammatory and oxidative stress( Reference Babio, Becerra-Tomas and Martinez-Gonzalez 37 , Reference Yoda, Sun and Kawase 97 , Reference Zemel, Richards and Mathis 98 ). Third, Ca from dairy products can also bind intestinal SCFA and bile acids causing up-regulation of the LDL receptor and thus reducing serum LDL-cholesterol concentration( Reference Dugan and Fernandez 24 ). The cholesterol-lowering effects of Ca accompanied by the effects of low-fat milk products enriched with plant stanol esters improve both total and LDL-cholesterol concentration in subjects with moderate hypercholesterolaemia( Reference Dugan and Fernandez 24 , Reference Hunter, Zhang and Kris-Etherton 99 , Reference Seppo, Jauhiainen and Nevala 100 ).
Moreover, Mg can modulate insulin action and secretion by preserving pancreatic β-cell function through their impact on Ca homoeostasis and oxidative stress among others( Reference Sarrafzadegan, Khosravi-Boroujeni and Lotfizadeh 101 ). Mg can also raise serum HDL-cholesterol while reducing LDL-cholesterol and TAG, through increasing lipoprotein lipase activity among others( Reference Sarrafzadegan, Khosravi-Boroujeni and Lotfizadeh 101 ). Mg’s potential effect on weight maintenance was also reported, forming an un-absorbable soap with fatty acids and cholesterol, decreasing their absorption, and thus reducing energy intake from the diet( Reference Sarrafzadegan, Khosravi-Boroujeni and Lotfizadeh 101 ). Similarly, reduced serum phosphate level, partly ascribed to reduced P intake, is also a hallmark of the MetS, mostly the insulin resistance component as suggested elsewhere( Reference Kalaitzidis, Tsimihodimos and Bairaktari 102 ).
Strengths, limitations of the study and conclusions
Our study has several strengths, including its prospective design with long follow-up and repeated measures on exposures and outcomes. Further, we studied both major dairy foods and dairy-related nutrients, while distinguishing between low-fat and full milk in part of the analysis. Although fat content was available for all dairy products, we only considered varying fat contents of milk being the important contributor to total dairy product intake. Although small randomised trials have already been conducted, larger observational cohort studies remain clinically important to examine this research question over longer follow-up periods. Moreover, our study collected two 24-h dietary recalls/wave instead of one, reducing measurement error and enhancing the value of dietary variables in reflecting usual intake. Given the overall lower socio-economic status of our study sample, dairy product consumption was expected to be lower than the national average( Reference Beydoun, Gary and Caballero 71 ). In fact, in both nationally representative data and this urban sample of US adults, educational attainment was an important factor determining dairy product intake, particularly among women. Our sample had almost half a serving lower mean intake of total dairy products compared with the national average, with <5 % reaching the recommended three servings/d in total dairy product intake.
Despite its strengths, our study findings should be interpreted in light of some limitations. Some findings may be observed owing to selection bias, given that less than half of the original HANDLS sample was included in our present study. This was partly adjusted for using the two-stage Heckman selection model, as described in previous studies( Reference Beydoun, Canas and Dore 91 – Reference Beydoun, Beydoun and Rostant 93 ). Moreover, measurement error in dietary exposures can still be sizeable, even though two 24-h recalls per wave are an improvement over many large cross-sectional studies. Those errors are probably random across MetD groups, leading to attenuation of true associations. Nevertheless, our findings regarding yogurt intake may not be as reliable as other dairy foods, given the low average consumption (<0·1 serving/d)( Reference Thiebaut, Kipnis and Schatzkin 103 ). Additionally, data on supplemental intakes of Ca, Mg and P were not available for baseline data, which precluded the assessment to total intake of those nutrients. Our findings may be generalisable to urban adults in Baltimore city and other cities around the USA with similar racial composition. Finally, modest associations observed could be the result of residual confounding by unmeasured lifestyle or health-related factors, whereas other associations may have been left undetected owing to inadequate statistical power. In fact, dairy product intake may be a reflection of a healthy lifestyle measured by factors that were not accounted for in our analyses. It is worth noting that in addition to the commonly cited limitations of observational studies, many of the randomised trials to date have failed to use an adequate comparison group that would reflect the dairy-related nutrients’ potential effects on the MetS or its components, including Ca and Mg. It is therefore important to compare dairy product consumption with non-dairy products (e.g. soya products) and their potential effect on metabolic parameters over time. Instead, most randomised trials to date have compared individual constituents within dairy product (e.g. whey v. casein) or dairy product v. sugar-sweetened beverages. The latter cannot be considered a good comparison, as sugar-sweetened beverages are well-known to increase blood glucose, insulin and TAG over time( Reference Narain, Kwok and Mamas 104 ). Although differential composition in Ca, Mg and P, as well as dairy product fat, may partially explain differences in the association between various dairy products and MetD, further studies are needed to uncover the key mediators.
In sum, various dairy product exposures had differential associations with MetD. Future intervention studies should uncover how changes in dairy product components over time may affect metabolic disorders, accounting for sex and race differences in those putative effects. Specifically, our study found that some dairy foods (yogurt and cheese) were directly associated, whereas milk was inversely related to the MetS and its components. Furthermore, minerals such as Ca and P are abundantly found in yogurt and cheese, as well as in milk. They are also found in other foods such as vegetables and whole grains. The latter food groups have been associated with lower incidence of major chronic diseases, and thus their consumption should be further encouraged. Replication of our findings by randomised controlled trials with similar exposures would strengthen the case for the public health implications of intakes of various dairy foods and related nutrients on populations and their potential impacts on metabolic disorders, including the MetS.
Acknowledgements
The authors thank Dr Ola S. Rostant and Nicolle Mode (NIA/NIH/IRP) for their internal review of the manuscript.
This work was fully supported by the Intramural Research Program of the NIH, National Institute on Aging.
M. A. B.: conceptualisation; literature search and review; data management; plan of analysis; statistical analysis; write-up of manuscript; and revision of the manuscript. M. T. F. K.: data acquisition; data management; plan of analysis; literature search and review; write-up of parts of manuscript; and revision of the manuscript. H. A. B., G. A. D. and J. A. C.: literature search and review; write-up of parts of the manuscript; and revision of the manuscript. M. K. E.: data acquisition and revision of the manuscript. A. B. Z.: data acquisition; plan of analysis; write-up of parts of the manuscript; and revision of the manuscript.
The authors declare that there are no conflicts of interest.


