


Diabetes is one of the biggest public health challenges of the twenty-first century with increasing prevalence globally( Reference Danaei, Finucane and Lu 1 ). According to a report( 2 ) released by the International Diabetes Federation, in 2012, more than 371 million people had diabetes, representing 8·3 % of the global adult population, while 4·8 million people died due to diabetes and more than 471 billion US$ were spent on health care for diabetes. Therefore, the primary prevention efforts towards diabetes should be explored.
Several cohort studies( Reference Bhupathiraju, Pan and Malik 3 – Reference Salazar-Martinez, Willett and Ascherio 18 ) have inconsistently shown that regular tea consumption may have a protective effect on type 2 diabetes (T2D). An earlier meta-analysis( Reference Jing, Han and Hu 19 ) that focused on tea consumption and T2D risk and combined results from nine cohort studies( Reference Odegaard, Pereira and Koh 10 – Reference Salazar-Martinez, Willett and Ascherio 18 ) published before 2009 reported that the consumption of tea is not associated with a lower risk of T2D in individuals consuming large amounts compared with those consuming low amounts and that consuming ≥ 4 cups per d may lower the risk of T2D (relative risk (RR) 0·80, 95 % CI 0·70, 0·93), in which the conclusion was drawn on the basis of five studies in the secondary analysis. Furthermore, another meta-analysis of cohort studies carried out by Huxley et al. ( Reference Huxley, Lee and Barzi 20 ) published in the same year has concluded that consuming ≥ 3 or ≥ 4 cups of tea daily is associated with a 16 % reduced risk of T2D compared with not consuming tea. These investigations( Reference Jing, Han and Hu 19 , Reference Huxley, Lee and Barzi 20 ) have much practical implication regarding the prevention of T2D. However, whether tea is inversely associated with T2D risk over the entire range of consumption categories or has a threshold effect on T2D remains unclear. Besides, categories as well as reference groups of tea consumption vary among individual studies. In some cases, the highest category assumed in one study might be the lowest category in another, which could complicate the interpretation of the pooled risk estimates as in the meta-analysis by Jing et al. ( Reference Jing, Han and Hu 19 ). Since then, a number of pertinent studies have been published( Reference Bhupathiraju, Pan and Malik 3 – Reference van Dieren, Uiterwaal and van der Schouw 9 ), allowing a more detailed analysis of the association between consumption of tea and subsequent risk of diabetes.
Hence, in the present study, we conducted a dose–response meta-analysis of cohort studies to quantitatively assess the relationship between consumption of 1–6 cups of tea per d and risk of T2D, following the guidelines of the Meta-analysis of Observational Studies in Epidemiology( Reference Stroup, Berlin and Morton 21 ) for reporting a systematic review and meta-analysis.
Methods
Search strategy
We comprehensively identified studies by searching PubMed, Web of Science and EMBASE databases through 31 March 2013 for cohort studies that evaluated the effect of tea consumption on the subsequent risk of T2D. The search was limited to studies conducted in human subjects. The reference lists of the retrieved articles were also scrutinised to identify additional relevant studies. No language restrictions were applied. In total, three search themes were combined using the Boolean operator AND. The first theme, tea, combined the exploded versions of the Medical Subject Headings terms tea, caffeine, polyphenols, catechin or flavonoids. The second theme, diabetes, combined the exploded versions of the Medical Subject Headings terms diabetes mellitus, glucose or insulin. The third theme, cohort study, combined the exploded versions of cohort studies, longitudinal studies or prospective studies (given in Supplementary Appendix 1, available online).
Study selection criteria
Articles were considered for inclusion in the meta-analysis if the authors had reported data from an original, peer-reviewed study other than review articles or meeting abstracts, the study had a cohort design consisting of non-institutionalised adults ( ≥ 18 years old), and the authors provided RR or hazard ratio (HR) and its 95 % CI or standard error of incident T2D for tea consumption. The selected studies were further considered for inclusion in a dose–response meta-analysis if the authors had additionally provided adjusted RR or HR and 95 % CI for three or more quantitative categories of tea consumption (cups/d), as well as the corresponding number of cases and person-years or subjects for each category. If publications were duplicated or from the same cohort, the most recent publication was included.
Data extraction and quality assessment
Using a unified data form, two authors (W.-S. Y. and W.-Y. W.) independently evaluated study eligibility and conducted data extraction and quality assessment. Relevant variables included in the data form were as follows: study name (together with the first author's name and year of publication); study region; study design; number of cases; cohort size; follow-up years; variables matched on or adjusted for in the design and data analysis. To conduct a dose–response meta-analysis, RR or HR and 95 % CI that reflected the greatest degree of control for potential confounders (i.e. the study-specific most-adjusted RR or HR and its 95 % CI), as well as the corresponding number of cases and person-years or subjects for each category of tea consumption, were also extracted. If any of the above-mentioned information was not available in the articles, the first or corresponding authors were contacted by email for additional information. Some studies separated risk estimates according to the different types of tea consumed and did not report the effect of total tea consumption. In this case, the study-specific effect size in the overall analysis was recalculated by combining the risk estimates of such tea types using the random-effects model meta-analysis( Reference DerSimonian and Laird 22 ). The two lists from the authors were then compared, and disagreements were settled by consensus or by involving a third reviewer (W.-Y. F.) for adjudication.
To assess study quality, a 9-point scoring system according to the Newcastle–Ottawa Scale( Reference Wells, Shea and O'Connell 23 ) was used. Quality characteristics were assessed using the following criteria: (1) representativeness of the exposed cohort; (2) selection of the unexposed cohort; (3) exposure assessments; (4) outcome of interest not present at the start of the study; (5) control for important factors or additional factors; (6) outcome assessments; (7) follow-up period long enough for outcomes to occur; (8) adequacy of follow-up of cohorts. A study can be given a maximum score of one point for each item, except for the item ‘control for important factors or additional factors’, for which studies that adjusted for body weight or BMI or waist circumference or waist:hip ratio were given one point and those that also adjusted for other potential confounders including smoking, total energy intake, physical activity (PA) and intake of other beverages were given an additional point. Hence, the full score was 9, and a high-quality study in the present analysis was defined as a study with ≥ 7 points.
Data synthesis and analyses
For every study, we estimated a RR and its 95 % CI for an increase of 2 cups/d in tea consumption in the first stage. The method suggested by Greenland & Longnecker( Reference Greenland and Longnecker 24 ) and Orsini et al. ( Reference Orsini, Bellocco and Greenland 25 ) was used to calculate study-specific log-linear trends in random-effects generalised least-squares models for every study. We then combined the study-specific log-linear trends in a second random-effects generalised least-squares model for summary linear trend estimation. The mean or median tea intake levels for each category were assigned to each corresponding RR for every study.
We also conducted a two-stage random-effects dose–response meta-analysis( Reference Orsini, Li and Wolk 26 ) to study the potential non-linear relationship between tea consumption and T2D risk. This was carried out by modelling tea consumption using a restricted cubic spline model with four knots at fixed percentiles (5, 35, 65 and 95 %) of the distribution( Reference Durrleman and Simon 27 ). In the first stage, a restricted cubic spline model was estimated using generalised least-squares regression accounting for the correlation within each set of published risk estimates( Reference Orsini, Bellocco and Greenland 25 ). In the second stage, the study-specific slopes (trend) that had been estimated within each study were combined by using the restricted maximum-likelihood method in a multivariate random-effects meta-analysis( Reference Jackson, White and Thompson 28 ). A P value for non-linearity was computed by testing the null hypothesis that the coefficients of the second and third splines are all equal to zero. Cubic spline models with three knots were also used and similar results were obtained (data not shown).
A separate random-effects meta-analysis( Reference DerSimonian and Laird 22 ) was also conducted to calculate the summary RR with 95 % CI of T2D for comparable categories of tea consumption when compared with the lowest category in each study. In this approach, we pooled the tea consumption categories into five groups: reference (no tea consumption); < 1 cup/d; 1–3 cups/d; 3–4 cups/d; ≥ 4 cups/d.
Between-study heterogeneity among the study-specific trends (one-stage estimations) for the dose–response meta-analysis and heterogeneity within the study-specific RR and HR for the separate random-effects meta-analysis were evaluated using Cochran's Q and I 2, and the null hypothesis that the studies are homogeneous was rejected if the P value for heterogeneity was < 0·10( Reference Higgins, Thompson and Deeks 29 ) or the I 2 value was ≥ 50 %. The potential small-study bias was evaluated using Begg's rank correlation method( Reference Begg and Mazumdar 30 ) and by means of visual inspection of the funnel plot. A subgroup analysis was conducted by study quality, study region, sex, follow-up years, tea types, diabetes assessments and covariates adjusted in the articles if ≥ 2 studies were included in each stratum. All the data analyses were carried out using the R 2.15.3 (R Development Core Team) and SAS 9.2 (SAS Institute, Inc.) software, and a two-sided P value of 0·05 was considered to be statistically significant if not specified.
Results
Literature search
A flow diagram of the literature search strategy employed in the present study is shown in Fig. 1. Using the search strategy, a total of 5006 citations were identified, of which 4889 articles were excluded after review of the title or abstract. After examining the full text of the remaining 117 articles, 101 articles were found to be reviews or not to have a cohort design; one study( Reference Salazar-Martinez, Willett and Ascherio 18 ) was excluded because analysis in this study was updated by a later publication with a longer follow-up period( Reference Bhupathiraju, Pan and Malik 3 ). Thus, fifteen articles were included in the meta-analysis.
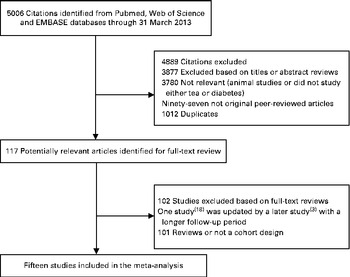
Fig. 1 Literature search and reference selection for the meta-analysis.
Study characteristics
The characteristics of sixteen cohorts from the fifteen selected articles are given in Table 1. Altogether, these studies had 37 445 cases of T2D among 545 517 participants during a follow-up period ranging from 3·4 to 24 years. All the studies were published between 2004 and 2013 and were conducted in Asia (n 4)( Reference Hayashino, Fukuhara and Okamura 5 , Reference Oba, Nagata and Nakamura 7 , Reference Odegaard, Pereira and Koh 10 , Reference Iso, Date and Wakai 14 ), Europe (n 5)( Reference InterAct 4 , Reference Sartorelli, Fagherazzi and Balkau 6 , Reference van Dieren, Uiterwaal and van der Schouw 9 , Reference Hamer, Witte and Mosdol 11 , Reference Hu, Jousilahti and Peltonen 15 ) and the USA (n 6)( Reference Bhupathiraju, Pan and Malik 3 , Reference Boggs, Rosenberg and Ruiz-Narvaez 8 , Reference van Dam, Willett and Manson 12 , Reference Pereira, Parker and Folsom 13 , Reference Song, Manson and Buring 16 , Reference Greenberg, Axen and Schnoll 17 ). Most of the studies recruited both men and women, of which four studies( Reference Bhupathiraju, Pan and Malik 3 , Reference Oba, Nagata and Nakamura 7 , Reference Iso, Date and Wakai 14 , Reference Hu, Jousilahti and Peltonen 15 ) presented results by sex, while five studies( Reference Sartorelli, Fagherazzi and Balkau 6 , Reference Boggs, Rosenberg and Ruiz-Narvaez 8 , Reference van Dam, Willett and Manson 12 , Reference Pereira, Parker and Folsom 13 , Reference Song, Manson and Buring 16 ) included only women and one study( Reference Hayashino, Fukuhara and Okamura 5 ) included only men. Only four studies( Reference Hayashino, Fukuhara and Okamura 5 , Reference Oba, Nagata and Nakamura 7 , Reference Odegaard, Pereira and Koh 10 , Reference Iso, Date and Wakai 14 ) separated the risk estimates according to the different types of tea consumed: three for green tea( Reference Oba, Nagata and Nakamura 7 , Reference Odegaard, Pereira and Koh 10 , Reference Iso, Date and Wakai 14 ); three for oolong( Reference Hayashino, Fukuhara and Okamura 5 , Reference Oba, Nagata and Nakamura 7 , Reference Iso, Date and Wakai 14 ); three for black tea( Reference Oba, Nagata and Nakamura 7 , Reference Odegaard, Pereira and Koh 10 , Reference Iso, Date and Wakai 14 ); others reported the effect of total tea consumption with unspecified tea types. All the studies simultaneously adjusted for age, BMI, smoking and PA; fourteen articles also adjusted for alcohol drinking, of which eleven articles also adjusted for consumption of beverages other than tea (coffee and other sugar-sweetened beverages).
Table 1 Characteristics of the studies included in the meta-analysis
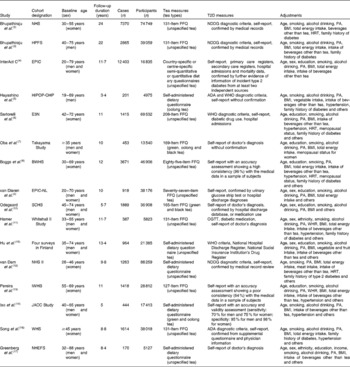
T2D, type 2 diabetes; NHS, Nurses' Health Study; NDDG, National Diabetes Data Group; PA, physical activity; HRT, hormone replacement therapy; HPFS, Health Professionals' Follow-up Study; EPIC, European Prospective Investigation into Cancer and Nutrition; HIPOP-OHP, High-risk and Population Strategy for Occupational Health Promotion Study; ADA, American Diabetes Association; E3N, Etude Epidémiologique auprés de femmes de la Mutuelle Générale de l'Education Nationale; BWHS, Black Women's Health Study; EPIC-NL, European Prospective Investigation into Cancer and Nutrition – Netherlands; SCHS, Singapore Chinese Health Study; OGTT, oral glucose tolerance test; WHR, waist:hip ratio; IWHS, Iowa Women's Health Study; JACC, Japan Collaborative Cohort Study; WHS, Women's Health Study; NHEFS, First National Health and Nutrition Examination Survey Epidemiologic Follow-Up Study.
All the selected studies utilised self-reported FFQ or self-administered questionnaires to estimate tea intake. In most of the studies, the diagnosis of diabetes was determined from self-report and was further verified by evidence from medical records, diabetes registration system, hospital admissions and hypoglycaemic agent use; three studies( Reference InterAct 4 , Reference Sartorelli, Fagherazzi and Balkau 6 , Reference Hamer, Witte and Mosdol 11 ) combined self-reported measures with medical records and five studies relied solely on self-reported outcomes( Reference Hayashino, Fukuhara and Okamura 5 , Reference Oba, Nagata and Nakamura 7 , Reference Pereira, Parker and Folsom 13 , Reference Iso, Date and Wakai 14 , Reference Greenberg, Axen and Schnoll 17 ), of which two studies( Reference Pereira, Parker and Folsom 13 , Reference Iso, Date and Wakai 14 ) considered the validity of outcome data (Table 1).
Study-specific quality scores are summarised in Table 2. The range of quality scores was from 6 to 9; the mean and median scores were 7·3 (sd 0·86) and 7·0, respectively. All the selected studies except one( Reference Greenberg, Axen and Schnoll 17 ) were defined as high-quality studies according to the Newcastle–Ottawa Scale 9-scoring system.
Table 2 Methodological quality of studies included in the meta-analysis*
NHS, Nurses' Health Study; HPFS, Health Professionals' Follow-up Study; EPIC, European Prospective Investigation into Cancer and Nutrition; HIPOP-OHP, High-risk and Population Strategy for Occupational Health Promotion Study; E3N, Etude Epidémiologique auprés de femmes de la Mutuelle Générale de l'Education Nationale; BWHS, Black Women's Health Study; EPIC-NL, European Prospective Investigation into Cancer and Nutrition – Netherlands; SCHS, Singapore Chinese Health Study; IWHS, Iowa Women's Health Study; JACC, Japan Collaborative Cohort Study; WHS, Women's Health Study; NHEFS, First National Health and Nutrition Examination Survey Epidemiologic Follow-Up Study.
* A study can be awarded a maximum of one star for each item, except for the item ‘control for important factors or additional factors’.
† A maximum of two stars can be awarded for this item. Studies controlling for body weight or BMI or waist circumference or waist:hip ratio were awarded one star, while studies controlling for other important confounders including smoking, total energy intake, and intake of other beverages were awarded an additional star.
‡ Duration of 10 years was the predefined follow-up duration long enough for outcomes to occur, and a cohort study with follow-up duration ≥ 10 years was awarded one star.
§ A cohort study with a follow-up rate of more than 75 % was awarded one star.
Overall analysis
From thirteen articles( Reference Bhupathiraju, Pan and Malik 3 – Reference Sartorelli, Fagherazzi and Balkau 6 , Reference Boggs, Rosenberg and Ruiz-Narvaez 8 – Reference van Dam, Willett and Manson 12 , Reference Iso, Date and Wakai 14 – Reference Greenberg, Axen and Schnoll 17 ), fourteen cohorts were combined in the dose–response meta-analysis. There was a significant linear association between tea consumption and T2D risk (P for linear trend = 0·02; P for non-linear trend = 0·96) (Fig. 2). The risk reduction of T2D for an increment of 2 cups of tea per d was 4·6 (95 % CI 0·9, 8·1) %. Compared with no tea consumption, the summary RR of T2D were 0·97 (95 % CI 0·94, 1·01) for 1 cup of tea per d, 0·95 (95 % CI 0·92, 0·98) for 2 cups of tea per d, 0·93 (95 % CI 0·88, 0·98) for 3 cups of tea per d, 0·90 (95 % CI 0·85, 0·96) for cups of tea per d, 0·88 (95 % CI 0·83, 0·93) for 5 cups of tea per d and 0·85 (95 % CI 0·80, 0·91) for 6 cups of tea per d (Table 2). The results were consistent when analyses were restricted to twelve high-quality studies (P for linear trend < 0·01). A significant between-study heterogeneity was detected in the study-specific trends (Q= 45·32, P< 0·01, I 2 =60·3 %). Begg's rank correlation test (P= 0·46) and funnel plot (shown in Supplementary Fig. 1, available online) provided no evidence of substantial small-study bias among the study-specific trends.

Fig. 2 Dose–response relationship between tea consumption and type 2 diabetes risk with restricted cubic splines in a random-effects model. ![]() and
and ![]() represent the estimated relative risks and 95 % CI. No tea consumption was used as the reference group. P for linear trend = 0·016.
represent the estimated relative risks and 95 % CI. No tea consumption was used as the reference group. P for linear trend = 0·016.
In the separate random-effects meta-analysis for comparable categories of tea consumption, the RR of T2D were 1·00 (95 % CI 0·97, 1·04) for < 1 cup/d (twelve studies) (Q= 12·71, P= 0·69, I 2 =0), 0·98 (95 % CI 0·94, 1·02) for 1–3 cups/d (thirteen studies) (Q= 20·75, P= 0·24, I 2 =18·1 %), 0·93 (95 % CI 0·65, 1·34) for 3–4 cups/d (three studies) (Q= 16·34, P< 0·01, I 2 =81·6 %) and 0·85 (95 % CI 0·77, 0·94) for ≥ 4 cups/d (eleven studies) (Q= 16·45, P= 0·13, I 2 =33·1 %).
Subgroup and sensitivity analyses
In the subgroup analysis (Table 3), the inverse association between tea consumption and diabetes risk appeared to be confined to European populations (five studies), women (five studies), and oolong and black tea intake (three studies) when stratified by study region, sex and tea type; however, the number of selected studies in each stratum was small (six studies for US populations and three for Asian populations; four studies for men; and two studies for green tea intake). The inverse association was apparent (P for linear trend = 0·01) in the analysis of cohort studies with over a median of 10 years of follow-up duration, but not among studies with less than 10 years of follow-up duration. The summary RR of diabetes were similar in the subgroup analysis by three types of adjustments in the models (i.e. simultaneously controlling for BMI, PA and smoking; simultaneously controlling for BMI, PA, smoking and intake of other beverages; and simultaneously controlling for BMI, PA, smoking, intake of other beverages and alcohol drinking).
Table 3 Relative risks (RR) of type 2 diabetes associated with daily consumption of 1–6 cups of tea compared with no consumption* (Relative risks and 95 % confidence intervals)
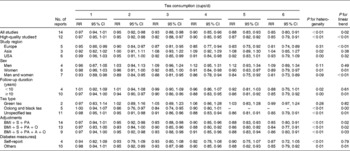
S, smoking; PA, physical activity; O, beverages other than tea; A, alcohol drinking.
* Due to few data points at high levels of tea consumption (i.e. >6 cups of tea per d), we only report RR of 1–6 cups of tea per d.
† A high-quality study was defined as a study with ≥ 7 points according to the Newcastle–Ottawa Scale.
‡ ‘Self-report’ means that the study identified type 2 diabetes using self-reported data without any further confirmations, while studies that identified type 2 diabetes using self-reported data with further confirmations by evidence from medical records, diabetes registration system, hospital admissions and hypoglycaemic agent use were categorised into the ‘Others’ group.
In the sensitivity analysis, when we excluded one study( Reference InterAct 4 ) with the largest statistical weight (9·67 %) in the meta-analysis, the inverse linear trend between tea consumption and diabetes risk remained (P for linear trend = 0·03). Similarly, simultaneous exclusion of three studies( Reference Hayashino, Fukuhara and Okamura 5 , Reference Odegaard, Pereira and Koh 10 , Reference Iso, Date and Wakai 14 ) without risk estimates of total tea consumption yielded similar results (P for linear trend < 0·01).
Discussion
To our knowledge, the present meta-analysis is the first to quantify the dose–response relationship between regular tea consumption and T2D risk. We found that regular tea consumption was inversely linearly associated with the risk of developing T2D. Such an inversely linear trend persisted and remained statistically significant in high-quality studies. We also observed that individuals who consumed ≥ 4 cups of tea per d had a 15 % risk reduction for developing T2D. According to the results of the present meta-analysis, adults who consumed at least 2 cups of tea daily might suffer from a lower risk of incident T2D compared with those not consuming tea. Given the high prevalence of diabetes and the popularity of tea worldwide, the observed association, if validated in future studies, has both clinical and public health importance.
There is emerging evidence from experimental and clinical research demonstrating that tea may protect against diabetes. Data from both in vitro and animal in vivo studies indicate several possible mechanisms by which tea and its active components may affect glucose metabolism and insulin signalling( Reference Kao, Chang and Lee 31 , Reference Stote and Baer 32 ). Tea catechins, including epigallocatechin-3-gallate, epicatechin-3-gallate, tannins and theaflavins, may lower glucose and insulin concentrations by inhibiting the carbohydrate digestive enzymes α-amylase, intestinal sucrose and α-glucosidase in the intestines of rabbits( Reference Shimizu, Kobayashi and Suzuki 33 , Reference Kobayashi, Suzuki and Satsu 34 ). Tea catechins, particularly epigallocatechin-3-gallate, which is the most abundant catechin and has received by far the most attention, have also been shown to enhance insulin sensitivity and insulinotropic activity by increasing insulin-stimulated glucose uptake in adipocytes( Reference Kao, Hiipakka and Liao 35 – Reference Anderson and Polansky 37 ). Moreover, a recent meta-analysis that combined twenty-two clinical trials has indicated that the consumption of green tea catechins can significantly decrease fasting blood glucose concentrations in humans( Reference Zheng, Xu and Li 38 ). Another meta-analysis of seventeen randomised controlled trials carried out by Liu et al. ( Reference Liu, Zhou and Wang 39 ) has also suggested that green tea consumption is associated with decreased fasting blood glucose and glycated Hb concentrations. Besides, caffeine, mainly present in coffee and tea, could increase energy expenditure and fat oxidation in humans( Reference Dulloo, Duret and Rohrer 40 , Reference Gregersen, Bitz and Krog-Mikkelsen 41 ) and may thereby help individuals control their body weight and hence lower diabetes risk, although some studies( Reference Keijzers, De Galan and Tack 42 , Reference Greer, Hudson and Ross 43 ) have shown that caffeine may impair insulin sensitivity.
In the present meta-analysis, the limited data available according to different tea types (only four studies) did not support a positive association between green tea consumption and T2D risk, although green tea has a higher content of epigallocatechin-3-gallate than oolong and black tea due to oxidation during tea fermentation. Of the tea types produced worldwide, 78 % is black tea, which is fully fermented and commonly consumed in Western countries; 20 % is green tea without any fermentation, which is typically consumed in Asian countries; and 2 % is oolong tea, which is semi-fermented and produced mainly in southern China( Reference Yang and Landau 44 ). Given the popularity of these three tea types worldwide, more large and well-designed cohort studies are needed to clarify the difference in the effects of fermented tea and unfermented tea on the aetiology and prevention of T2D.
We found that the evidence from observational studies on the association of T2D risk with the consumption of both caffeinated and decaffeinated tea is limited and controversial, which hampers the secondary analysis by these two tea types. Bhupathiraju et al. ( Reference Bhupathiraju, Pan and Malik 3 ) examined the association of caffeinated compared with caffeine-free tea consumption with T2D risk in 39 059 US men from the Health Professionals' Follow-up Study, aged 40–75 years, and 74 749 US women from the Nurses' Health Study, aged 30–55 years, with follow-up duration of 22 and 24 years, respectively. They found that only caffeinated tea consumption was associated with a lower risk of T2D among the Nurses' Health Study participants. Paradoxically, in another cohort study of 7006 US men and women with a median follow-up period of 8·4 years, Greenberg et al. ( Reference Greenberg, Axen and Schnoll 17 ) found that regular tea consumption is negatively associated with diabetes risk, and this association remained significant when accounting for the effect of caffeine. They also found that tea consumption is not significantly associated with weight loss. These results indicate that the inverse association between tea consumption and T2D risk may be independent of caffeine. Although a recent meta-analysis of twenty-two human randomised controlled trials with an average study duration of 12 weeks has shown that the administration of green tea catechins, irrespective of the caffeine content, has a beneficial effect on glycaemic control with significantly reduced concentrations of fasting blood glucose of 14·8 (95 % CI 4, 25·7) mg/l( Reference Zheng, Xu and Li 38 ), the long-term effects of caffeinated and decaffeinated tea consumption on T2D risk await further evaluation in a cohort design, given the short duration of the currently available randomised controlled trials.
We found a significantly inverse association existing only among studies with more than 10 years of follow-up duration. This finding might be partly due to the lack of statistical power in studies with shorter follow-up periods. Due to the small number of studies for male sex, we did not observe a significantly inverse association between tea consumption and T2D risk among men. We also found that outcome data from a self-reported history of diabetes without any further confirmations may bias the tea–T2D association, given the inconsistent results observed in the subgroup analysis according to different diabetes measures, which indicated that the validity of self-reported diabetes warrants careful consideration in future studies.
The reasons for sex difference in the association between tea consumption and T2D risk remain unclear. In addition to the smaller number of studies for male sex, which may have led to unstable results for men, an alternative possible explanation for the observed difference is the residual confounding by cigarette smoking( Reference Kuriyama, Shimazu and Ohmori 45 ). In most of the selected studies in the present meta-analysis, men were generally more likely to smoke compared with women. Although all the included studies adjusted for cigarette smoking, the misclassification of smoking cannot be ruled out and may thus mask the association between tea consumption and T2D risk among men.
The strengths of the present meta-analysis include the inclusion of cohort studies, the use of study-specific RR reflecting the greatest degree of control for potential confounders, less influence exerted by small-study bias, and a moderate-to-high quality of studies included in the meta-analysis.
However, several limitations of the present study should be considered. First, we found a mild heterogeneity within the studies, which could be due to the difference in study design, study populations, tea and T2D measures, and analytical strategies. Second, as we carried out a meta-analysis of observational studies, inherent problems with confounding in each individual study could not be addressed. Nonetheless, most of the included studies had adjusted for a wide range of potential confounders, including BMI (all the fifteen studies), smoking (all the fifteen studies), PA (all the fifteen studies), alcohol drinking (fourteen studies), and intake of coffee and other sugar-sweetened beverages (eleven studies). Furthermore, the subgroup analysis by different types of adjustments in the articles showed consistent results (Table 2). Third, although our overall analysis was based on many studies, few studies were available according to tea subtypes, study populations (Asian and US populations) and sex, which may have led to unstable results in the secondary analysis and did not allow us to draw firm conclusions. In addition, the data available were insufficient for us to address the types of tea, preparation methods and differences in tea strength. These factors may partly explain the regional differences (Table 3) that we observed. It is likely, for example, that European populations tend to drink stronger tea than North American populations( Reference Peters, Poole and Arab 46 ). If this were true, the effect of 1 cup of tea would be higher among European populations than in US populations. However, this is just a hypothesis, and the observed regional differences await further elucidation in future research.
In summary, the findings of the present meta-analysis suggest that tea consumption is linearly associated with a reduced risk of T2D. Future well-designed observational studies that account for different characteristics of tea such as tea types, preparation methods and tea strength are needed to fully characterise such an association. In addition, the underlying mechanisms and active components in tea that may be responsible for the association await further elucidation.
Supplementary material
To view supplementary material for this article, please visit http://dx.doi.org/10.1017/S0007114513003887
Acknowledgements
The present work was supported by a research grant from the Jiangxi Provincial Health Department of China (20083168). The funding source played no role in the design and conduct of the study; the collection, management, analysis and interpretation of the data; or the preparation, review and approval of the manuscript.
The author's contributions were as follows: W.-S. Y. and X. W. had full access to all the data in the study and were responsible for the integrity of the data and the accuracy of the data analyses; W.-S. Y. and X. W contributed to the study concept and design; W.-S. Y., W.-Y. W. and W.-Y. F acquired the data; W.-S. Y., W.-Y. W., W.-Y. F. and X. W analysed and interpreted the data; W.-S. Y drafted the manuscript; W.-S. Y., W.-Y. W., W.-Y. F., Q. D. and X. W were responsible for the critical revision of the manuscript for important intellectual content; W.-S. Y. and X. W carried out the statistical analysis; X. W obtained funding for the study; X. W provided administrative, technical and material support; X. W supervised the study.
None of the authors has any conflicts of interest to declare.


