Breast cancer is the most commonly reported malignancy in women worldwide. In the USA, breast cancer accounts for nearly one in three female cancer diagnoses and is the second leading cause of cancer death(Reference Desantis, Siegel and Bandi1). Tumour metastasis – the spread of cancer from the original site of the primary tumour to distant organs – is the principal cause of death for the majority of cancer patients(Reference Steeg2). As there are few effective treatment options for tumour metastasis, preventative methods need to be developed. Lifestyle factors, including dietary factors, have been increasingly implicated as having a crucial role in both the development and survival of breast cancer(Reference Hauner and Hauner3). It is important that such factors, including dietary habits, are modified as a method of preventing the development and progression of breast cancer.
Several epidemiological studies have identified total fat intake, regardless of the type of fat, as a risk factor for the occurrence of postmenopausal breast cancer(Reference Thiebaut, Kipnis and Chang4, Reference Patterson, Cadmus and Emond5). The effect of a high-fat diet (HFD) on breast cancer has been investigated in correlation with obesity. However, certain individuals appear to be genetically predisposed to staying lean even with a high intake of dietary fat, whereas other people will more easily become obese(Reference Heitmann, Lissner and Sorensen6). In a previous study(Reference Kim, Choi and Park7) that evaluated the effects of a HFD on breast cancer development and progression, we inoculated 4T1 mammary carcinoma cells into the mammary fat pads of syngeneic, obesity-resistant BALB/c mice. The chronic consumption of a HFD (60 % energy from fat), without discernible increases in body weight, increased both lung and liver metastases, thereby increasing mortality. These results suggested that a HFD can promote breast cancer progression irrespective of obesity. However, to the best of our knowledge, the molecular mechanisms that provide the associating link between a HFD and breast cancer metastasis have yet to be fully elucidated.
In 1889, Paget(Reference Paget8) hypothesised that metastasis develops only when the ‘seed’ (i.e. particular cancer cells with metastatic capacity) and the ‘soil’ (tissue microenvironments providing growth advantages to the cancer cells) are well matched. Since this early hypothesis, it has been repeatedly shown that there exist many steps in the growth and metastasis of cancer (e.g. migration, invasion, adhesion and proliferation of cancer cells) that are promoted by local microenvironmental factors. The tumour microenvironment comprises multiple stromal cells including infiltrating immune cells, endothelial cells, fibroblasts and pericytes, as well as a wide variety of extracellular matrix components. These stromal cells produce various factors (e.g. growth factors, chemokines/cytokines, extracellular matrix components and pro-angiogenic and pro-invasive matrix-degrading enzymes) that are critical for tumour metastasis (reviewed in Hanahan & Weinberg(Reference Hanahan and Weinberg9) and Hanahan & Coussens(Reference Hanahan and Coussens10)). For example, these stromal cells express matrix metalloproteinases that cleave and remodel the extracellular matrix. Integrins are the primary matrix cell adhesion molecules that integrate the signals between the extracellular matrix and the intracellular signalling pathway in endothelial cells and thereby orchestrate tumour angiogenesis (reviewed in Jodele et al. (Reference Jodele, Blavier and Yoon11) and Weis & Cheresh(Reference Weis and Cheresh12)).
Earlier studies have reported that a HFD caused alterations in tissue microenvironments. Macrophages accumulate(Reference Weisberg, McCann and Desai13) and a variety of inflammatory and macrophage-specific genes(Reference Xu, Barnes and Yang14) are markedly up-regulated in the adipose tissues of C57BL/6J mice fed a HFD. Recently, we have shown that chronic consumption of a HFD results in increased infiltration of immune cells in tumours and increased serum levels of various cytokines in 4T1 mammary tumour-bearing BALB/c mice(Reference Kim, Choi and Park7). In vitro, some cytokines stimulate the growth, migration and adhesion of 4T1 mammary cancer cells(Reference Kim, Choi and Park7). We have also demonstrated that HFD feeding increases the tumour infiltration of leucocytes, increases the production of inflammatory markers such as cyclo-oxygenase-2 and inducible NO synthase in tumour tissues and increases the serum levels of various cytokines/chemokines in BALB/c mice injected with CT26 colon cancer cells(Reference Park, Kim and Kwon15). These studies have indicated the occurrence of HFD-induced inflammatory changes in tissue microenvironments, which may contribute to the stimulation of metastasis. We hypothesised that a HFD leads to changes in target organs including the lungs and liver (‘the soil’) which then provide more favourable microenvironments into which mammary cancer cells (‘the seed’) can infiltrate and then grow.
The aim of the present study was to identify differentially expressed genes (DEG) and their biological networks that are active in the early metastatic phase of lung and liver tissues of the 4T1 orthotopic model following chronic consumption of a HFD, without a discernible increase in body weight. Such early molecular alterations in gene expression and biological networks may yield insights into how a HFD stimulates breast cancer progression. In the present study, hepatic and pulmonary mRNA expressions in 4T1 tumourbearing mice fed a control diet (CD) and a HFD were compared with those observed in sham-injected mice fed a CD and HFD. From these data, we attempted to identify the biological processes and networks that contribute to the HFD-stimulated lung and liver metastasis of mammary cancer cells.
Materials and methods
4T1 cell culture
4T1 murine mammary carcinoma cells were acquired from the American Type Culture Collection and maintained in Dulbecco's modified Eagle's medium containing 100 ml/l of fetal bovine serum.
Animals, diets and experimental design
All experiments were conducted in accordance with the protocols approved by the Animal Care and Use Committee of Hallym University, Korea (ethical approval no. Hallym 2009-124). Female BALB/c mice, 3 weeks old (Orient Bio), were acclimatised to laboratory conditions for 1 week and maintained as described previously(Reference Kim, Choi and Park7). After this acclimatisation, mice were randomly divided into four groups: (1) SC, sham-injected+CD-fed; (2) SH, sham-injected+HFD-fed; (3) TC, 4T1 cell-injected+CD-fed; (4) TH, 4T1 cell-injected+HFD-fed. The SC and TC mice were fed a purified CD (10 % energy as fat, D12450B), whereas the SH and TH mice were fed with a HFD (60 % energy as fat, D12452; Research Diets) for 18 weeks as described previously(Reference Kim, Choi and Park7). At 16 weeks after feeding was initiated, 4T1 cells (5 × 10Reference Thiebaut, Kipnis and Chang4 cells suspended in 0·1 ml matrigel; BD Biosciences) were injected into the inguinal mammary fat pads of TC and TH mice. Vehicle (0·1 ml matrigel) was injected into the SC and SH mice. At 14 d after the injection of 4T1 cells, mice were killed via CO2 asphyxiation and the lungs and liver were quickly excised for RNA isolation.
RNA isolation
Total RNA was extracted using Trizol® reagent (Invitrogen) and purified using RNeasy columns (Qiagen) according to the manufacturer's instructions. After processing with DNase digestion and conducting clean-up procedures, RNA samples were quantified and aliquots were stored at − 70 °C until use. For quality control, RNA purity and integrity were evaluated using denaturing gel electrophoresis, and determination of the absorbance ratio at 260 v. 280 nm analysed on a Model 2100 Bioanalyzer (Agilent Technologies). For microarray analyses, three pooled RNA sample sets for each group were constructed from fifteen mouse samples.
Microarray analyses
Microarrays were conducted by Macrogen. Briefly, the total RNA was amplified and purified using the Ambion Illumina RNA amplification kit (Ambion) to yield biotinylated complementary RNA according to the manufacturer's instruction. Biotinylated complementary RNA samples (750 ng) were hybridised to each Mouse WG-6 v2 Expression Bead chip preparation (Illumina) for 16 h at 58 °C according to the manufacturer's instructions. The hybridised arrays were stained with fluorolink streptavidin-Cy3 (GE Healthcare Bio-Sciences) following the standard protocol from the bead array manual. The arrays were scanned with a bead array reader confocal scanner according to the manufacturer's instructions (Illumina). Array data export processing and analysis were performed using GenomeStudio v2009.2 (Gene Expression Module v1.5.4; Illumina). All probe signal values were log-transformed and normalised by the quantile method. An independent t test and fold change were applied. Statistical significance was adjusted by the Benjamini–Hochberg multiple-testing correction with a false discovery rate. Hierarchical cluster analysis was performed using complete linkage and Euclidean distance as measures of similarity. All data analyses and visualisation of DEG were conducted using ArrayAssist® (Stratagene) and R statistical language version 2.4.1 (Comprehensive R Archive Network). Biological ontology-based analysis was performed using the Panther database (http://www.pantherdb.org). The microarray data have been deposited in the Gene Expression Omnibus (GEO) repository (GEO accession no. GSE36211).
Functional annotation analysis
We divided the DEG into a ‘common’ gene list (207 genes in the liver and 436 genes in the lungs) and a ‘unique’ gene list (107 genes in the liver and 123 genes in the lungs). The former list indicates the DEG in both the TC/SC and TH/SH groups, whereas the latter indicates the DEG in the TH/SH group but not in the TC/SC group (Table 1). The DAVID Functional Annotation Clustering tool (v6.7b, January 2010; http://david.abcc.ncifcrf.gov)(Reference Huang da, Sherman and Lempicki16) was applied to the ‘common’ and ‘unique’ gene sets to identify the biological processes associated with the metastatic potential of HFD-responsive genes (Supplementary data S1, available online). This tool provides typical batch annotation and gene-Gene Ontology (GO) term enrichment analysis to highlight the most relevant gene ontology terms associated with a common or unique gene list. The analysis was performed using disease (OMIM), functional categories (COG_Ontology, SP_PIR_Keywords and UP_SEQ_Feature), gene ontology (GOTERM_BP FAT, GOTERM_MF FAT and GOTERM_CC FAT), pathways (BRID, BIOCARTA and KEGG) and protein domains (Interpro, PIR_Superfamily and SMART) based on the default settings, with classification stringency being performed at the medium level. An equivalent analysis was performed using separately up-regulated (ninety-four genes in the liver and fifty genes in the lungs) and down-regulated (thirteen genes in the liver and seventy-three genes in the lungs) unique genes (Supplementary data S1, available online).
Table 1 Number of differentially expressed genes (DEG) and the top ten genes of the TH/SH unique genes*

TH, 4T1 cell-injected, high-fat diet-fed mice; SH, sham-injected, high-fat diet-fed mice; TC, 4T1 cell-injected, control diet-fed mice; SC, sham-injected, control diet-fed mice; ↑ , number of up-regulated genes; ↓ , number of down-regulated genes.
* For description of gene symbols see text and Appendix 1.
† Common means the group of DEG involved commonly in both TC/SC and TH/SH groups.
‡ Unique means the group of DEG involved uniquely in the TH/SH group alone.
§ The top ten genes are displayed in a fold-change order.
Biological network analysis
We inputted the probe identifiers and the associated expression values from the Illumina BALB/c hepatic and pulmonary array data to upload into the Ingenuity Pathway Analysis (IPA) tool (Ingenuity® Systems, www.ingenuity.com, IPA version: 8.8 (2010), content version: 3204 (2010)). Each probe identifier was mapped into its corresponding gene object using the IPA Knowledge Base. These focus genes were overlaid onto a global molecular network developed from information contained in the database. The networks of the focus genes were then algorithmically generated based on their interaction type (direct and/or indirect). Scores were generated based on Fisher's test so as to rank the networks according to the degree of relevancy to the genes in the input dataset. Genes or gene products are represented as nodes, and the biological relationship between the nodes is represented by an edge (line). The connectivity of genes (nodes) is based on the data in the IPA Knowledge Base, which is a large repository of gene–phenotype associations, molecular interactions, chemical knowledge and regulatory events. Red nodes indicate differentially up-regulated genes (fold change >2) and green nodes indicate differentially down-regulated genes (fold change < − 2). Yellow nodes are slightly up-regulated genes (fold change < 2) and pale green nodes are slightly down-regulated genes (fold change > − 2). Yellow and pale green nodes also indicate that the genes in question were expressed in the opposite direction in the TH/SH group when compared with those in the TC/SC group. Information regarding the location and secretion of proteins was obtained from the LOCATE subcellular localisation database, which is a curated, Web-accessible database that houses the data describing the membrane organisation and subcellular localisation of proteins from the FANTOM3 Isoform protein sequence set.
Real-time quantitative RT-PCR
Quantitative RT-PCR was used to validate the expression patterns of the selected genes. Complementary DNA was synthesised from total RNA with SuperScript II RT (Invitrogen), as described previously(Reference Kim, Kang and Cho17). Real-time PCR was carried out using a Rotor-Gene 3000 PCR (Corbett Research) as described previously(Reference Cho, Seon and Lee18). Sequences for the PCR primer sets are listed in Table S1 (available online). PCR amplification of complementary DNA was carried out at 94 °C for 3 min, followed by thirty cycles as follows: 94 °C for 5 s, annealing temperature for 12 s and 72 °C for 15 s. The analysis of the PCR results and the calculations of relative concentrations were performed using Rotor-Gene software (version 6; Corbett Research). RT-PCR results are expressed as means with their standard errors and were analysed by Student's t test, using SAS for Windows, version 9.1 (SAS Institute). A P value < 0·05 was considered as statistically significant.
Results
Global transcriptional changes in high-fat diet-fed BALB/c mice
Hepatic and pulmonary mRNA expression levels in TC and TH mice were compared with those in SC and SH mice as a control. The expression values of 45 281 genes were obtained for each of the TC/SC and TH/SH groups. The ten most significant genes for the TC/SC and TH/SH groups were almost identical because cancer exerts a much stronger influence on transcriptional response than does dietary treatment (Supplementary data S2, available online). In an attempt to identify transcriptional changes according to tumour progression under the systemic environment of a HFD, but not a CD, we paid close attention to the DEG in TH/SH mice rather than those in TC/SC mice. We divided all DEG into three groups and obtained 207, 75 and 107 hepatic genes as well as 436, 53 and 123 pulmonary genes in the Common, TC/SC Unique and TH/SH Unique groups, respectively (Supplementary data S2, available online; Table 1). The top ten most significantly up-regulated and down-regulated genes in the TH/SH Unique group are listed in Table 1.
Functional annotation analysis
Based on the false discovery rate < 5 %, Benjamini and Hochberg-adjusted P value < 0·05 and log fold change >2, 272 and 314 hepatic genes, and 474 and 559 pulmonary genes were differentially expressed by 4T1 cell injection in the CD (TC/SC) and HFD (TH/SH) groups, respectively (Table 1). DAVID functional annotation clustering analysis for TC/SC and TH/SH was performed to identify significant genes as well as their protein interaction partners obtained from the Michigan Molecular Interactions database. The representative biological functions of the hepatic TC/SC gene set were energy metabolism, cell signalling-related process, protein biosynthesis and various metabolic processes. Those within the pulmonary TC/SC gene set were cell signalling-related processes, glucose metabolic process, cytoskeleton-related process, cell cycle and apoptosis, and oxidative stress. The representative biological functions of the hepatic TH/SH genes were similar to those of the hepatic TC/SC genes, and several additional terms were identified including complement pathway, ubiquitin conjugation, and cell adhesion and migration. The biological characteristics of the pulmonary TH/SH gene set were also similar to those of the hepatic TH/SH genes (Supplementary data S3, available online). These data demonstrate that the additional biological processes present in both hepatic and pulmonary TH/SH genes comprised immune response, complement pathways, cell adhesion and cell migration.
DAVID annotation clustering analysis of 207 hepatic and 436 pulmonary common genes revealed that the hepatic representative functions selected by the statistical thresholds (enrichment score >1·3, P < 0·05, false discovery rate < 0·05) were signal, inflammatory response and chemotaxis, enzyme inhibitor activity, haem binding and aminoglycan metabolic process. Pulmonary representative functions were inflammatory response and immune cell activation, signal, Src homology-3 domain, regulation of protein kinase cascade and glycoproteins (Supplementary data S4, available online). These results indicated that the functional biological features that appeared in the common genes of the two tissues were similar.
For 107 hepatic and 123 pulmonary TH/SH Unique genes, a functional annotation analysis was performed and an equivalent analysis for up- or down-regulated unique genes was again separately conducted. The results are provided in Supplementary data S5 (available online) and significant biological functions as well as the microarray expression of several representative genes are displayed as heat maps in Fig. 1. ‘Acute-phase inflammation’ and ‘cell mitosis’ were the most significant biological processes in the liver and lungs, respectively. Genes such as orosomucoid 1 (Orm1), lipopolysaccharide-binding protein (Lbp), complement component 1, s subcomponent (C1 s) and complement factor B (Cfb) encoding specific acute-phase proteins (APP) were significantly up-regulated in the hepatic TH/SH group. On the other hand, in the pulmonary TH/SH group, the genes encoding mitotic proteins involved in the regulation of the cell cycle and histone modification were up-regulated.

Fig. 1 Significant functional annotations in the 4T1 cell-injected, high-fat diet-fed mice (TH)/sham-injected, high-fat diet-fed mice (SH) Unique gene set. TH/SH Unique signifies the differentially expressed genes (DEG) (fold change >2 or < − 2) in only the TH/SH group. The DAVID Bioinformatic Database was used for functional annotation analysis, and significant biological functions were selected by enrichment score thresholds: >1·3; P< 0·05; false discovery rate < 0·25. Count is the number of genes related to each function term and P is the threshold of the Expression Analysis Systematic Explorer (EASE) score, a modified Fisher exact P value, for gene enrichment analysis. Usually, a P value ≤ 0·05 is considered to be strongly enriched in the annotation categories. The genes related to the indicated functions and mRNA expression levels of the indicated genes in the TH/SH and TC/SC groups are displayed with heat maps (red, up-regulated; black, no change; green, down-regulated). For description of gene symbols see text and Appendix 1. (A colour version of this figure can be found online at http://www.journals.cambridge.org/bjn).
In the hepatic TC/SC group, genes characterised by functions related to acetylation, peroxisome and fatty acid metabolism were significantly enriched. In the pulmonary TC/SC group, there was a significant enrichment of genes with functions related to pleckstrin homology, inflammatory response, oxidoreductase activity and cytochrome p450 (Supplementary data S6, available online). These results indicated that the TH/SH Unique genes have independent functional features that do not overlap with those displayed in the TC/SC group.
Core network analysis
For the core network analysis by the IPA tool, 107 hepatic and 123 pulmonary TH/SH Unique genes were inputted into the experimental gene sets. From this analysis, three significant networks were identified in the liver and two in the lungs (Figs. 2(a) and 3(a)). In the liver, network 1, which exhibited the highest score, was characterised as having functions related to cancer, inflammatory response and cellular movement. The main molecules of this network were several genes encoding APP (Lbp, Orm1 and Cfb) and critical genes regulating lipid metabolism (squalene epoxidase (Sqle), Sc4 mol sterol-C4-methyl oxidase-like (Sc4 mol), Ppard, carnitine palmitoyltransferase 2 (Cpt2) and leptin (Lep)) (Fig. 2(a) and (b)). Network 2 was composed of genes related to immune cell-mediated response (Il4, Il21 and Spleen focus forming virus provital integration oncogene (Spi1)) and cell adhesion and metastasis (lectin, galactose binding, soluble 1 (Lgals1), vimentin (Vim) and fibronectin 1 (Fn1)) (Fig. 2(a) and (c)). Network 3 was characterised by functions including cell death and cell cycle progression, and its representative genes were heat shock protein 90 kDa alpha (cytosolic), class A member 1 (Hsp90aa1), heat shock protein 90 kDa alpha (cytosolic), class B member 1 (Hsp90ab1), heat shock 70 kDa protein 8 (Hspa8), cyclin-dependent kinase 4 (Cdk4), tumour protein 53 (Tp53), oestrogen receptor 1 (Esr1) and YY1 transcription factor (Yy1) (Fig. 2(a) and (d)). The top biological functions of this gene set were cancer, inflammatory response, cell death, cell morphology and tissue development. The top canonical pathways in the hepatic response were acute-phase response signalling, cell cycle G2/M DNA damage checkpoint regulation, integrin-linked kinase signalling, the complement system and actin cytoskeletal signalling (Fig. 2(e); Supplementary data S7A, available online), in the order of low to high P values. Acute-phase inflammation proteins were the main components of the most significant hepatic network 1 as well as the top canonical pathway.

Fig. 2 Top core networks and top canonical pathways resulting from the hepatic 4T1 cell-injected, high-fat diet-fed mice (TH)/sham-injected, high-fat diet-fed mice (SH) Unique gene set. Core network analysis for the hepatic TH/SH Unique gene set was performed using Ingenuity Pathway Analysis. (a) Network numbers were assigned in the order of their significance score and the associated network functions are the three most significant functions for each network. Representative molecules indicate genes showing altered transcriptional expression or having a critical role in each network. The score is based on a P value calculation of the likelihood that the network eligible molecules are part of a network found therein by random chance alone. The greater the number of network eligible molecules in a network, the higher the score (lower the P value). Focus molecules indicate the number of network eligible molecules, i.e. the genes that are eligible for network generation. (b–d) Core networks in the liver. Genes or gene products are represented as nodes, and the biological relationship between the nodes is represented by an edge (line). In these networks, red nodes indicate differentially up-regulated genes (fold change >2) and green nodes indicate differentially down-regulated genes (fold change < − 2). Yellow nodes are slightly up-regulated genes (fold change < 2) and pale green nodes are slightly down-regulated genes (fold change > − 2). Yellow and pale green nodes also mean that the genes were expressed in the opposite direction in the TH/SH group when compared with those in the 4T1 cell-injected, control diet-fed mice (TC)/sham-injected, control diet-fed mice (SC) group. The various symbols indicate the representative biological roles of each gene investigated using the NCBI Gene database. (e) Top canonical pathways of the liver. (b) ![]() , Acute-phase inflammation;
, Acute-phase inflammation; ![]() , gap junction proteins;
, gap junction proteins; ![]() , cholesterol biosynthesis;
, cholesterol biosynthesis; ![]() , energy generation. (c)
, energy generation. (c) ![]() , Cell-mediated immune response;
, Cell-mediated immune response; ![]() , regulation of cell cycle and proliferation;
, regulation of cell cycle and proliferation; ![]() , cell adhesion and metastasis. (d)
, cell adhesion and metastasis. (d) ![]() , Regulation of cell cycle and proliferation;
, Regulation of cell cycle and proliferation; ![]() , heat shock proteins;
, heat shock proteins; ![]() , cell adhesion and junction. For description of gene symbols see text and Appendix 1. (A colour version of this figure can be found online at http://www.journals.cambridge.org/bjn).
, cell adhesion and junction. For description of gene symbols see text and Appendix 1. (A colour version of this figure can be found online at http://www.journals.cambridge.org/bjn).

Fig. 3 Top core networks and top canonical pathways resulting from the pulmonary 4T1 cell-injected, high-fat diet-fed mice (TH)/sham-injected, high-fat diet-fed mice (SH) Unique gene set. Core network analysis for the pulmonary TH/SH Unique gene set was performed using Ingenuity Pathway Analysis. (a) Network numbers were assigned in the order of their significance score and associated network functions represent the three most significant functions for each network. Representative molecules indicate genes showing altered transcriptional expression or having a critical network role. The score is based on a P value calculation of the likelihood that the network eligible molecules are part of a network found therein by random chance alone. Focus molecules indicate the number of network eligible molecules, i.e. the genes that are eligible for network generation. Mela, melanoma antigen. (b, c) Core networks in the lung. Genes or gene products are represented as nodes, and the biological relationship between the nodes is represented by an edge (line). In these networks, red nodes indicate differentially up-regulated genes (fold change >2) and green nodes indicate differentially down-regulated genes (fold change < − 2). Yellow nodes are slightly up-regulated genes (fold change < 2) and pale green nodes are slightly down-regulated genes (fold change > − 2). Yellow and pale green nodes also indicate that the genes were expressed in the opposite direction in the TH/SH group compared with those in the 4T1 cell-injected, control diet-fed mice (TC)/sham-injected, control diet-fed mice (SC) group. The various symbols indicate the representative biological roles of each gene investigated using the NCBI Gene database. (d) Top canonical pathways of the lung. (b) ![]() , Regulation of cell cycle and proliferation; ◆, APC/C:CDC20-mediated degradation of mitotic proteins;
, Regulation of cell cycle and proliferation; ◆, APC/C:CDC20-mediated degradation of mitotic proteins; ![]() , protein ubiquitination;
, protein ubiquitination; ![]() , IRAK4-NF-κB. (c)
, IRAK4-NF-κB. (c) ![]() , Regulation of cell cycle/cell division;
, Regulation of cell cycle/cell division; ![]() , implicated as regulators of cell proliferation. For description of gene symbols see text and Appendix 1. (A colour version of this figure can be found online at http://www.journals.cambridge.org/bjn).
, implicated as regulators of cell proliferation. For description of gene symbols see text and Appendix 1. (A colour version of this figure can be found online at http://www.journals.cambridge.org/bjn).
In the pulmonary TH/SH Unique genes, network 1 was composed of two sub-networks: cell cycle regulators (cell division cycle 20 (Cdc20), cyclin B1 (Ccnb1), Cdk1 and budding uninhibited by benzimidazole 1 homologue beta (Bub1b)) and inflammation-related critical signalling molecules (IL-1 receptor-associated kinase 4 (Irak4) and Toll-IL 1 receptor domain containing adaptor protein (Tirap)) (Fig. 3(a) and (b)). Network 2 also had two sub-networks: YY1-originated cell division regulators (kinesin family member 2C (Kif2c), centromere protein A (Cenpa) and protein regulator of cytokinesis 1 (Prc1)) and potential regulators of tumour cell proliferation (fos-like antigen 2 (Fosl2), Lgals1 and epidermal growth factor receptor kinase substrate 8 (Eps8)) (Fig. 3(a) and (c)). The top biological functions were development disorder, cell-to-cell signalling and interaction, and haematological system development and function. The top canonical pathways were the mitotic roles of polo-like kinase, hepatic fibrosis/hepatic stellate cell activation, the cell cycle control of chromosomal replication, glucocorticoid receptor signalling and the protein ubiquitination pathway (Fig. 3(d); Supplementary data S7B, available online). The genes (Cdc20 and Ccnb1) participating in the protein ubiquitination pathway were also components of the most significant pulmonary network 1 (Fig. 3(b)). The activation of cell cycle progression, especially the G2/M phase, appeared to be a main pulmonary biological process activated by the chronic consumption of the HFD in 4T1 tumour-bearing mice.
To investigate whether the molecules identified in the indicated networks are proteins secreted into the circulatory system, the LOCATE database was used to search for information regarding the subcellular localisation and secretion of each protein. Liver-secreted proteins are CFB, chemokine (C–X–C motif) ligand 2 (CXCL2), colony-stimulating factor 2 (CSF2), haptoglobin (HP), LBP, ORM1, LEP, C1S, APOA4, FN1, IL21, IL4, napsin A aspartic peptidase (NAPSA) and Secretory leucocyte peptidase 1 (SLP1). Among these, Cfb, Lbp, Orm1 and Fn1 were markedly up-regulated DEG of the TH/SH Unique group. Chemokine (C-C motif) ligand 5 (CCL5) is a protein secreted into the blood and was a down-regulated DEG in the lungs of the TH/SH Unique group (Supplementary data S8, available online).
Quantitative RT-PCR validation
To examine the reliability of the difference in expression levels detected by profiling analysis using microarray, quantitative RT-PCR analysis with the same RNA samples that were utilised for the microarray analysis was performed. For this, we selected four different genes in the liver and lungs. A strong correlation was observed between the gene expression levels determined by microarray and quantitative RT-PCR analyses. In the liver, the expression levels of three genes (chitinase 3-like (Chi3l1), Lbp and Orm1) that were shown to be markedly up-regulated in the TH/SH Unique group by microarray analysis were shown to be similarly changed using quantitative RT-PCR analysis. The expression of B-cell leukaemia/lymphoma 6 (Bcl6), which was significantly down-regulated in the TH/SH Unique group by microarray analysis, was also decreased as shown using quantitative RT-PCR analysis (Fig. 4(a)). In agreement with the microarray results, the results of quantitative RT-PCR analysis revealed that the gene expression of Prc1, Lgals1 and Cell division cycle 2a (Cdc2a) was increased, whereas that of α-2-HS-glycoprotein (Ahsg) decreased in the lung tissues of HFD-fed, tumour-bearing mice when compared with HFD-fed, sham-injected mice (Fig. 4(b)).

Fig. 4 Validation of the microarray results by quantitative RT-PCR (qRT-PCR) analysis in hepatic and pulmonary tissues of 4T1 orthotopic mice fed a high-fat diet (HFD). Total RNA was assayed by quantitative RT-PCR. The housekeeping gene glyceraldehyde 3-phosphate dehydrogenase (Gapdh) was used for data normalisation. Fold changes in (a) Chi3l1, (b) Lbp, (c) Orm1 and (d) Blc6 mRNA in hepatic tissues. Fold changes in (e) Prc1, (f) Lgals1, (g) Cdc2a and (h) Ahsg mRNA in pulmonary tissues. Values are means, with their standard errors represented by vertical bars. * Mean value was significantly different from that of the TC/SC group (P< 0·05). ■, TC/SC (4T1 cell-injected, control diet-fed/sham-injected, control diet-fed); ![]() , TH/SH (4T1 cell-injected, HFD-fed/sham-injected, HFD-fed). For description of gene symbols see text and Appendix 1.
, TH/SH (4T1 cell-injected, HFD-fed/sham-injected, HFD-fed). For description of gene symbols see text and Appendix 1.
Discussion
Global interpretation of the transcriptional response to tumour progression in the hepatic and pulmonary tissues of high-fat diet-fed, obesity-resistant BALB/c mice
We previously demonstrated that the chronic consumption of a HFD enhanced solid tumour growth and metastatic virulence when compared with a CD in 4T1 mammary cancer-bearing, obesity-resistant BALB/c mice(Reference Kim, Choi and Park7). Interestingly, both lung and liver metastases were increased, suggesting that the tissues of HFD-fed mice are better prepared to receive and nurture the invading tumour cells than those of CD-fed mice. In a preliminary study, metastatic nodules were not detected in the lungs and liver in this mouse model when mice were killed 14 d after 4T1 cell injection. We thus chose to examine early transcriptional responses to tumour progression in HFD-fed mice by examining the metastasis target tissues 14 d after the injection of tumour cells. Transcriptional responses to tumour progression were much stronger than those to the dietary treatment (HFD), indicating that marked changes in gene expression occurred due to the 4T1 mammary cancer progression. Consistent with this result, the top DEG in the TC v. SC group were similar to those in the TH v. SH group when significant genes were listed in the order of expression fold change. This result allowed us to presume that the annotated representative functions for each gene set would be similar. Thus, we focused our attention to the identification of specific DEG only in the target organs of tumour-bearing mice fed on the HFD (i.e. TH/SH Unique group).
When we examined the ten most up-regulated genes of the TH/SH Unique group, a marked change in hepatic mRNA transcription was observed in immune and inflammation response-related genes including Chi3l1, secretory leucocyte peptidase inhibitor (Slpi), Lbp and Orm1. Increased serum levels of CHI3L1 (cartilage glycoprotein-39) have previously been reported to be associated with disease severity, poorer prognosis and decreased survival in various types of cancers, including breast cancer(Reference Coffman19). It has also recently been shown that the in vivo administration of chitin to mammary tumour-bearing mice significantly decreased lung metastasis(Reference Libreros, Garcia-Areas and Shibata20). The second top hepatic gene, Slpi, has an angiogenic effect by inhibiting elastase, an activator of the antiangiogenic factor(Reference O'Reilly, Boehm and Shing21). Slp1 is up-regulated in breast cancer samples, and its serum levels correlate with overall survival, tumour stage and response to therapy(Reference Cimino, Fuso and Sfiligoi22). Other hepatic genes that were substantially altered in the TH/SH Unique group were growth arrest and DNA damage-inducible protein gamma (Gadd45 g), keratin 8 (Krt8) and Bcl6. GADD45G proteins function as stress sensors and mediate cell cycle arrest, DNA repair, genomic stability and apoptosis(Reference Fornace, Alamo and Hollander23). The major function of KRT8 in the liver is protection from liver injury stress and apoptosis(Reference Marceau, Loranger and Gilbert24), regulating the shape and function of mitochondria(Reference Tao, Looi and Toivola25). Thus, Gadd45 g and Krt8 appear to be overexpressed to protect liver tissue from metabolic or injury stresses that are promoted by excessive dietary fat and tumours. The intensity of 2,4-dienoyl-CoA reductase 1 (Decr1) and Bcl6 mRNA was substantially decreased; these are components of hepatic networks 1 and 2, respectively. DECR1 catalyses the rate-limiting step in a process that prepares PUFA to be utilised as substrates for β-oxidation(Reference Fillgrove and Anderson26). DECR1 is repressed during mammary tumour development(Reference Landis, Seachrist and Abdul-Karim27, Reference Landis, Seachrist and Montanez-Wiscovich28), and re-expression in ErbB2 ((v-erb-b2 erythroblastic leukaemia viral oncogene homolog 2, neuro/glioblastoma derived oncogene homolog (avian)))-expressing mammary tumour cells results in a marked suppression of tumour growth and decreased rates of de novo fatty acid synthesis(Reference Ursini-Siegel, Rajput and Lu29). Bcl6 has also been reported to repress the genes that function in lymphocyte differentiation, inflammation and cell cycle control(Reference Shaffer, Yu and He30).
Consistent with the present results, Park et al. (Reference Park, Lee and Yu31) reported that HFD feeding promotes liver inflammation and diethylnitrosamine-induced hepatocarcinogenesis in C57BL/6 mice by enhancing the production of IL-6 and TNF. The authors observed that infiltration of macrophages and neutrophils into the liver was markedly increased in HFD-fed mice. Their results indicate that IL-6 produced by immune cells leads to signal transducer and activator of transcription 3 (STAT3) activation in hepatocytes(Reference Naugler, Sakurai and Kim32), and that the chronic activation of the IL-6/STAT3 axis increases the likelihood of proliferation and further progression of transformed hepatocytes(Reference He, Yu and Temkin33). We postulate that in the premetastatic hepatic tissues of our HFD-fed mice, the alterations in transcriptional features may have led to the formation of a favourable pro-inflammatory microenvironment for the infiltration of immune cells into the liver. Currently, the detailed mechanism underlying the effect of a HFD on the interaction between immune cells and hepatocytes is not known. Additionally, we need to answer the question of how different dietary fatty acids affect the interaction between immune cells and hepatocytes in the near future.
The biological features of the pulmonary top-regulated genes in the TH/SH Unique group can be described as an up-regulation of cell cycle regulators and cancer cell-related factors. Among these, Lgals1 and tissue inhibitor of metalloproteinase 1 (Timp1) have been reported to show a positive correlation between their expression levels and the progression or metastasis of various types of cancer(Reference Rubinstein, Alvarez and Zwirner34, Reference Stetler-Stevenson35). Other notable pulmonary genes such as Prc1, Cdc2a and minichromosome maintenance complex component 10 (Mcm10) are involved in tumour cell division(Reference Nakayama and Nakayama36).
Taken together, the representative biological events interpreted by top-regulated genes of the TH/SH Unique group can be characterised as ‘inflammation and damage’ in liver tissues and ‘progressive cell division’ in lung tissues. These biological features in the hepatic and pulmonary tissues of metastasising mammary tumour-bearing mice, which are promoted by a HFD, appear to be very favourable for metastasising breast cancer cells to invade and grow.
In order to elucidate changes in the specific microenvironments induced by a HFD in the target tissues, it is necessary to determine changes in gene expression in different cell types including parenchymal cells, immune cells, adipocytes, endothelial cells and fibroblasts, and to determine the interactions between these different cells within the microenvironment. Since we extracted whole-tissue RNA in the liver and lung in the present study, it was impossible to investigate how a HFD caused changes in gene expression in specific cell types and affected the interactions between these different cells and tumour cells.
Acute-phase response inflammation, cholesterol synthesis and energy metabolism in the hepatic tissues of high-fat diet-fed, metastasising, tumour-bearing BALB/c mice
Several APP (Orm1, Lbp, Hp and Cfb) are components of hepatic network 1 alongside the significantly increased TH/SH Unique genes. Fn and Serpina1a (the serpin peptidase inhibitor, clade A) are also acute-phase response-related genes that were significantly up-regulated in the TH/SH Unique genes. However, these genes were not included in network 1. LBP is produced predominantly by hepatocytes and modulates various liver injuries(Reference Uesugi, Froh and Arteel37, Reference Su, Gong and Fan38). Cfb encodes complement factor B, a component of the alternative pathway of complement activation. The activation of this gene is critical to the development of innate inflammation against infections(Reference Li, Li and Stahl39, Reference Taube, Thurman and Takeda40). ORM1 has pro-angiogenic properties and supports the angiogenic effect of vascular endothelial growth factor A(Reference Irmak, Oliveira-Ferrer and Singer41). Therefore, the transcriptional reinforcement of APP could be a remarkable hepatic response that is associated with the establishment of favourable microenvironments for the infiltration of immune cells into the liver, thereby stimulating mammary cancer progression in HFD-fed mice. Among the APP genes identified in the TH/SH Unique group, the proteins encoded by Hp, Lbp, Cfb, Orm1/Orm2, Csf2 and Fn1 are secreted into the bloodstream. Various studies have used these APP as potential serum biomarkers of cancer progression or metastasis(Reference Irmak, Oliveira-Ferrer and Singer41–Reference Inufusa, Nakamura and Adachi46). For example, a glycoproteomic study of advanced breast cancer serum demonstrated that increases in ORM1 and HP β-chain may be candidates for improved markers in the monitoring of breast cancer progression in lieu of the CA 15-3 marker(Reference Abd Hamid, Royle and Saldova43).
In the hepatic core network 1, several genes (Sqle, Sc4 mol, Cpt2, mitochondrially encoded cytochrome c oxidase II (Mt-co2), C1 s and aldolase A, fructose-bisphosphate (Aldoa)) involved in PPARα-mediated glucose or lipid metabolism were significantly up-regulated. Sc4 mol is regulated by the transcription factor PPARα through the cross-talk between PPARα and sterol regulatory element binding protein signalling, and Sqle is an exclusive target of PPARα(Reference van der Meer, Degenhardt and Vaisanen47). SQLE catalyses the first oxygenation step in sterol biosynthesis and is thought to strongly influence the flux through the cholesterol biosynthesis pathway(Reference Astruc, Tabacik and Descomps48). Sqle mRNA expression in breast tumour tissues has been reported to be strongly associated with high-risk oestrogen receptor-positive stage I/II breast cancers(Reference Helms, Kemming and Pospisil49). CPT2 catalyses the conversion of acyl-carnitine to acyl-CoA, a rate-limiting step in mitochondrial fatty acid β-oxidation(Reference Mandard, Muller and Kersten50) and is an exclusive target of PPARα(Reference van der Meer, Degenhardt and Vaisanen47). Another significant energy-generating member is Mt-CO2, which is a component of the electron transport system of mitochondria. Tumour cells generate the majority of their ATP by glycolysis, even when grown in the presence of oxygen, and decrease the β-oxidation of fatty acids while stimulating the biosynthesis of fatty acids or cholesterol necessary for membrane synthesis for rapidly dividing cells(Reference Young and Anderson51). In our HFD-fed, tumour-bearing mice, there may have been sufficient accumulation of fatty acids from the diet for membrane synthesis in the liver. The production of more ATP through the β-oxidation of surplus fatty acids may have assisted in the proliferation of infiltrating cancer cells. This biological feature appearing in the hepatic core network 1 suggested that a HFD generates transcriptional alterations in several genes associated with PPARα that are involved in sterol biosynthesis and mitochondrial fatty acid oxidation, thereby stimulating metastasising tumour cell growth in the liver.
Negative association between heat shock proteins and p53 in the hepatic tissues of high-fat diet-fed, BALB/c mice bearing metastasising mammary cancer
The hepatic core network 3 clearly showed the negative association between HSP and p53, and the activation of the cell cycle through these two critical gene families. The liver of HFD-fed, tumour-bearing mice revealed transcriptional changes in several HSP including Hsp90aa1, Hsp90ab1 and Hspa8 as well as the suppression of p53. In addition, these two key gene families were linked to the activation of genes related to cell proliferation such as Cdk4, Mcm5, topoisomerase II α (Top2a), tyrosine 3-mono-oxygenase/tryptophan 5-mono-oxygenase activation protein gamma (Ywhag) and polo-like kinase (Plk1). HSP are highly conserved proteins that act as molecular chaperones and as a defence mechanism against metabolic and environmental stress, allowing the maintenance of cellular homeostasis(Reference Lindquist52). The role of HSP has been investigated in many cancers in terms of its relationships with p53, and the reported results suggest that HSP may play a role in p53-associated cellular oncogenesis(Reference Davidoff, Iglehart and Marks53). In cancer cells, oncogenes within the Ras pathway activate two parallel pathways: the proliferative response and the growth-inhibitory p53 pathway. However, proliferating cells acquire mutations in the p53 pathway and, alternatively, a high level of HSP inhibits p53 and allows cells to proliferate(Reference Sherman, Gabai and O'Callaghan54). CDK4 is a HSP90-dependent protein, and HSP90 inhibitors induce the degradation of CDK4(Reference Srethapakdi, Liu and Tavorath55). In addition, HSP90 has been shown to be expressed on the cell surface of highly metastatic cancer cells(Reference Becker, Multhoff and Farkas56) and involved in the maturation of the cell surface enzyme matrix metalloproteinase-2(Reference Sidera, Samiotaki and Yfanti57). We postulate that in HFD-fed, mammary cancer-bearing mice, fat accumulation in the liver leads to the damage of liver tissues, resulting in the activation of the stress protein HSP. Thus, the molecular events involved with HSP activation and the associated decline in p53 transcription may contribute to increased tumour cell proliferation in the liver of HFD-fed mice.
Deregulation of cell cycle control and inflammatory signalling in the lungs of high-fat diet-fed, tumour-bearing BALB/c mice
The important biological function of the pulmonary core network 1 is APC (anaphase-promoting complex/cyclosome)/C:CDC20-mediated degradation of mitotic proteins, which belongs to the protein ubiquitination pathway that was also identified as a top pulmonary canonical pathway. The levels of CDK and CDK inhibitors as well as other cell cycle-related regulators are quantitatively controlled by the ubiquitinating enzymes including APC/C which play a central role in cell cycle regulation. CDC20 is one of the most important activators in APC/C and targets mitotic cyclins and securin for degradation, thereby promoting sister-chromatide separation. In addition to Cdc20, several genes related to the cell cycle, including Ccnb1, Cdk1, CDC28 protein kinase regulatory subunit 18 (Cks1b), CDC28 protein kinase regulatory subunit 2 (Cks2), Bub1b, glypican 1 (Gpc1), and ubiquitin-like with PHD and ring finger domains 1 (Uhrf1), were also up-regulated in HFD-fed, tumour-bearing mice. These genes are mainly related to centrosome functions and spindle checkpoints, and also play a role in anaphase chromosome segregation(Reference Nakayama and Nakayama36).
The pulmonary core network 1 was also involved in the transcriptional activation of Irak 4 and Tirap, and the inhibition of Il-12. TIRAP plays a crucial role in the myeloid differentiation factor 88 (MyD88)-dependent signalling pathway shared by TLR(Reference Yamamoto, Sato and Hemmi58). MyD88 and TIRAP, adaptor molecules for Toll-like receptors, recruit IRAK. These events subsequently lead to the activation of the janus kinase and NF-κB signalling pathways, thereby finally activating the transcription of multiple pro-inflammatory cytokine genes(Reference Yamamoto, Sato and Hemmi58–Reference Bihl, Germain and Luci60). IL-12 has been reported to play a critical role in enhancing the activities of natural killer cells and T-lymphocytes(Reference Bihl, Germain and Luci60), and also has anti-angiogenic activity(Reference Airoldi and Ribatti61). IL-12 treatment of 4T1 tumour-bearing mice results in a significant decrease in tumour size and lung metastasis, as well as a substantial increase in their survival time(Reference Rakhmilevich, Janssen and Hao62, Reference Shi, Cao and Mitsuhashi63). In our HFD-fed mice, the sub-network of pulmonary cell cycle progression was enforced, which may have been associated with a deregulation of inflammatory responses.
The pulmonary core network 2 is mainly composed of genes encoding for proteins related to cell death and cancer such as Fosl2, Eps8 and Lgals1 (lectin, galactose binding, soluble 1 or galectin-1). The fos gene family encodes leucine zipper proteins that can dimerise with proteins of the Jun proto-oncogene (JUN) family, thereby forming the transcriptional factor complex AP-1. LGALS1 plays an important role in several aspects of cancer biology including inflammation and neoplastic transformation, as well as tumour cell adhesion, invasiveness and evasion of the immune response(Reference Rubinstein, Alvarez and Zwirner34, Reference Liu and Rabinovich64). This sub-network is linked to a gene cluster of YY1-originated cell division regulators such as Cenpa, Kif2c, Prc1 and Mcm6.
The collective results support the postulation that the events in networks 1 and 2 are important for stimulating the proliferation of tumour cells as well as inflammation in the lungs of HFD-fed mice, thereby contributing to the pulmonary metastasis of 4T1 mammary tumour cells.
Conclusion
The present study demonstrates that the chronic consumption of a HFD exerts metabolic stress in mammary cancer-bearing, obesity-resistant mice, which induces a disturbance in immune and inflammatory systems resulting in the promotion of lung and liver metastases. Excessive dietary fat appears to contribute to this phenotypic feature, at least in part, via the mediation of specific biological sub-networks and their molecules in the lungs and liver. The transcriptional responses of metastatic target tissues to a HFD revealed that inflammatory response, cholesterol biosynthesis, HSP/p53-mediated cell cycle progression, CDC20-mediated cell cycle regulation and the activation of other multiple cell proliferation regulators were the distinctive biological network characteristics present in HFD-fed, mammary cancer-bearing, obesity-resistant mice. The induction of pro-inflammatory and pro-mitotic conditions may provide a favourable microenvironment in the target tissues for the infiltration and differentiation of immune cells, as well as for the infiltration and proliferation of metastasising mammary cancer cells. Elucidation of the mechanisms involved in these responses, especially the potential role of APP, is essential for the identification of potential biomarkers or the creation of preventive targets in obese or non-obese breast cancer patients and for the future establishment of intervention programmes.
Supplementary material
To view supplementary material for this article, please visit http://dx.doi.org/10.1017/S0007114512004965
Acknowledgements
This study was supported by the SRC Program (Center for Food & Nutritional Genomics: grant no. 2012-0000642), the Mid-Career Research Program (grant no. 2012-0004903) and the Leap Research Program (2010-0029233) of the National Research Foundation of Korea, funded by the Ministry of Education, Science, and Technology, and the grants from an Omics-Based Integration Database for Cancer Interpretation (KGM1161012 and KGM0661113) funded by the Korea Research Institute of Bioscience and Biotechnology. E. J. K. and J. E. H. carried out the majority of animal studies including animal care, RNA isolation and real-time RT-PCR. H. Y. O., H.-S. H. and S.-J. J. carried out data processing, analysis and interpretation. K. W. L., J. H. P., C.-G. H. and J. H. Y. P. were responsible for the conception of the project and the oversight of the experiment. E. J. K., H. Y. O. and J. H. Y. P. drafted the manuscript. All authors read and approved the final manuscript. The authors declare no conflict of interest.
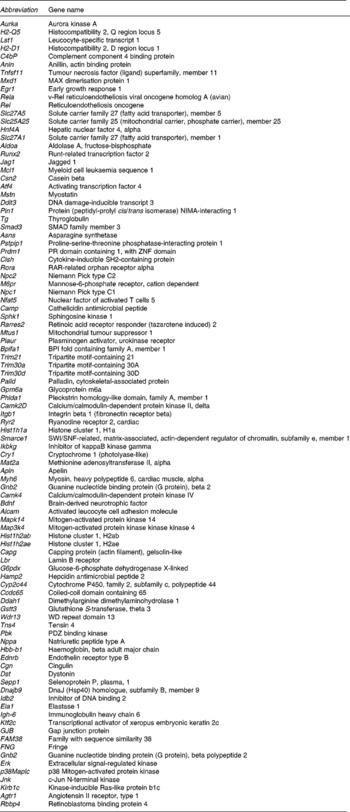
Appendix 1
Table 1a Gene names and abbreviations