


Resistant starch (RS) is the sum of starch and products of starch hydrolysis, which are not absorbed in the small intestine of healthy individuals(Reference Englyst, Kingman and Cummings1, 2). RS, like dietary fibre, can pass through the small intestine and directly enter into the large bowel where RS is fermented by anaerobic bacteria(Reference Topping and Clifton3–Reference Cummings and Macfarlane8). Consumption of RS-enriched foods has been shown to decrease the postprandial glycaemic and insulinaemic responses in some ethnic populations(Reference Behall, Hallfrisch and Scholfield9, Reference Park, Kang and Chang10). Chinese usually consume high levels of carbohydrates, especially for rice, almost every day. Whether their consumption with RS-enriched foods can reduce their glycaemic and insulinaemic responses is little explored. Furthermore, continual consumption of high-energy of foods, particularly for easily digestible starches, can impair glucose metabolism and is associated with obesity and insulin resistance, which are risk factors for the development of CVD and diabetes(Reference Jeppesen, Schaaf and Jones11, Reference Coutinho, Gerstein and Wang12). The characterisation of glycaemic and insulinaemic responses to regular and RS-enriched foods will be of great significance for education and prevention of obesity-related diseases in China. Rice is probably the most important staple crop for many people to obtain energy and support their lives in the world because of its high carbohydrate. Regular rice (wild-type rice, WT) contains very low levels of RS, particularly after extensive processing(Reference Zhang, Bi and Yan13). Great effort has been taken to generate RS-enriched foods, such as transgenic crops, for human consumers in the world. Although the effect of maize and potato intake on glycaemic and insulinaemic responses in human subjects has been extensively studied(Reference Behall, Hallfrisch and Scholfield9, Reference Le Leu, Brown and Hu14–Reference Hedemann and Knudsen16), little is known about the safety and physiological effect of RS-enriched rice consumption, especially with transgenic rice. Assurance of its safety and physiological benefits is a critical base for human consumption. Consumption of RS-enriched foods has shown beneficial effects on reducing postprandial glucose and insulin responses in people with either normal glucose tolerance or impaired glucose tolerance(Reference Behall, Hallfrisch and Scholfield9, Reference Park, Kang and Chang10, Reference Higgins17, Reference Behall and Hallfrisch18). Continual intake of RS can also promote the production of high levels of SCFA, such as acetic, propionic and butyric acids, in the large bowel(Reference Topping and Clifton3–Reference Cummings and Macfarlane8). Furthermore, fermentation of RS also produces high levels of different gases, CO2, CH4 and H2, which can be excreted in breath. However, little is known about whether consumption with the GM RS-enriched rice can promote the production of high levels of H2 in healthy Chinese adults. Notably, the levels of breath H2 are well correlated with the amount of H2 produced in the large bowel(Reference Levitt19–Reference Tormo, Bertaccini and Conde22). Accordingly, the determination of breath H2 can be useful for the evaluation of whether the GM RS-enriched rice can be fermented in the large bowel. The present study aimed to evaluate the postprandial glycaemic and insulinaemic responses to GM RS-enriched rice and determined whether consumption of this type of rice could promote the production of colonic fermentation-related H2 in young and healthy Chinese adults.
Subjects and methods
Subjects
Nine voluntary men of 23–26 years of age (24·3 (sem 1·0)) and seven women of 24–26 years of age (24·6 (sem 0·7)) were recruited for the present study. All subjects were firstly subjected to routine medical examination. All participants met the criteria of eligibility: BMI of 18–24 kg/m2; normal ranges of fasting plasma glucose, total cholesterol, TAG, HDL-cholesterol, total bilirubin, urea, alanine aminotransferase and blood cell counting; without history of smoking, diabetes and other chronic metabolic or gastrointestinal diseases; no recent infectious diseases, surgery or antibiotic therapy within 8 weeks. After the routine medical examination, eligible individuals were subjected to the oral glucose tolerance test. They were orally administrated with 50 g glucose in 300 ml water, and their venous blood samples were collected at 0, 15, 30, 45, 60, 90, 120, 180 and 240 min post-glucose challenge. Subjects agreed to avoid consuming any H2-produced foods, such as legumes and dairy products, high-fibre food, alcohol, beverages and others, for 24 h before their study session. Before each study session, subjects recorded their consumption of foods for 24 h. The present study was conducted according to the guidelines laid down in the Declaration of Helsinki, and all procedures involving human subjects were approved by the Ethical Committee of Institute for Nutrition and Food Safety, Chinese Center for Disease Control and Prevention. Written informed consent was obtained from all subjects.
Rice samples
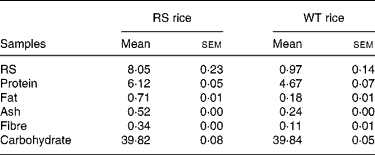
The RS and WT rice was provided from the Key Laboratory of Education Ministry for Plant Functional Genomics, Agricultural College of Yangzhou University (Jiangsu Province, China). The RS-enriched rice was generated by transgenic expression of the antisense complementary to the transcript of the starch-branching enzyme gene in an indica rice (Oryza sativa L. cv. Te-Qing), which is a rice cultivar with a high yield in southern China. Accordingly, the transgenic rice produced high levels of amylose and RS because of inhibition of starch-branching enzyme, which is critical for the synthesis of amylopectin. The RS and WT rice was grown in adjoining fields under the same environmental conditions and field management. After harvesting and paddy hulling, the RS and WT rice samples were obtained. Following milling, the contents of proteins (Chinese standard GB 5009.5-2003), fat (Chinese standard GB 5009.6-2003), fibre (Chinese standard GB 5009.10-2003), ash (Chinese standard GB 5009.4-2003) and moisture (Chinese standard GB 5009.3-2003) in the RS and WT rice were determined in Table 1. Total carbohydrate was equal to 100 % − (% protein+% fat+% ash+% water). The contents of RS in RS and WT rice were analysed using a commercially available kit (RSTAR11/02, Megzyme, Ireland), according to the manufacturer's instructions.
Table 1 The main nutrients profile of the resistant starch (RS) and wild-type (WT) rice test meals (g)
(Mean values and with their standard errors)
Experimental design and procedure
Individuals' postprandial glycaemic and insulinaemic responses to 40 g glucose, 40 g carbohydrate of RS or WT rice meal were tested by a crossover study with a washout period of 1 week. The dose was based on our preliminary data and the maximum amount for most subjects to consume comfortably within 10 min without intolerance symptoms like diarrhoea, nausea, abdominal cramping, distention and flatulence. Nine healthy men and seven women were randomly divided into three groups (three men and two to three women per group) and tested simultaneously. They consumed one of the 40 g glucose, 40 g carbohydrate of RS and WT rice meal in 300 ml water. The WT and RS rice were cooked for rice meal. One week later, they were administrated with the second type of food and after another week, they were provided with the third type of food. Individual subjects arrived at the study site between 06.00 and 06.30 hours. After resting for 30 min, their temperature, heart and respiratory rates were measured. Individuals were inserted with a catheter into the antecubital vein by a registered nurse. Their blood samples were collected and breath H2 was tested as the baseline values. At 07.00 hours, those subjects consumed individual food within 10 min. Their blood samples (2 ml) were collected at 0, 15, 30, 45, 60, 90, 120, 180 and 240 min post-food intake and subjected to H2 breath tests for the indicated time points. Subjects did not consume water for the first 2 h and then permitted to consume 150 ml water in the second 2 h. They were provided a special dinner on the day before testing, lunch and dinner after the last blood collection (5 and 11 h after the beginning of experiments) with little H2-producing foods. The amount and kind of foods individuals consumed were recorded. The subjects were requested to consume an equal amount of the same kind of foods at lunch and dinner when they participated in testing for the second and third type of foods.
Analysis of plasma glucose and insulin
The collected blood samples in grey-top BD Vacutainer blood tubes (special for blood glucose test) were centrifuged at 3000 g for 15 min at room temperature. The plasma was collected and stored at − 20°C for less than 3 d for analysis, which did not significantly change the value of plasma glucose in the present preliminary studies. The concentrations of plasma glucose for individual subjects were measured in duplicate using an automatic spectrophotometric analyzer (Vitalab Selectra E, Holland) as per the glucose oxidase method. The glycaemic index (GI) was calculated based on the incremental area under the curve (AUC) of 4 h blood glucose measurements using the trapezoidal rule and baseline value as the reference, as previously described(Reference Wolever, Jenkins and Jenkins23, Reference Brand-Miller, Fatema and Middlemiss24). Any area below the baseline was ignored. GI was calculated by using the following equation: GI = (AUC value of the tested rice meal/AUC value of the reference glucose meal) × 100. The levels of plasma insulin for individuals were analysed in duplicate using a commercial RIA kits (North Institute of Biological Technology Corporation, Beijing, China), according to the manufacturer's instructions. Insulin index for individuals was calculated using the same equation based on the AUC values of corresponding plasma insulin.
Hydrogen breath test
H2 breath tests for individual subjects were performed at 0 and 3·5–16 h post-food consumption with a half-hour interval between 3·5 and 14 h and 1-h interval between 14 and 16 h on a portable breath H2 analyser (HHBT-01, Headway Biotechnology Corporation, Shenzhen, Guangdong Province, China). Before testing, the breath H2 analyser was calibrated with standard gas (118 parts per million). During the period of 16-h H2 breath tests, the subjects were instructed to maintain awake and quiet without intensive activity.
Statistical analysis
Results were expressed as means with their standard errors. Differences in glucose, insulin and H2 responses to different types of foods were analysed using the Wilcoxon test, and the baseline values of individuals were used as their own controls. All statistical analyses were performed with the Statistical Analysis Systems 9.1 software (SAS Inc., Cary, NC, USA). A value of P < 0·05 was considered statistically significant.
Results
To test postprandial glycaemic and insulinaemic responses to the GM RS-enriched rice, a group of young and healthy adults were recruited and randomly divided into three groups. During the study period of 3 weeks, they consumed once with each of 40 g glucose, 40 g carbohydrate of RS or WT rice in the morning with an interval of 1 week. There was no single uncomfortable complaint after eating any of the foods in this population. Before they consumed each type of meal, their fasting blood glucose concentrations were measured. Their baseline glucose concentrations before intake of each type of foods were similar (4·7 (sem 0·3) v. 4·6 (sem 0·4) v. 4·7 (sem 0·3) mmol/l, P>0·05), respectively. Following each type of meal, the concentrations of blood glucose were determined for 4 h (Fig. 1). The concentrations of blood glucose, in response to RS, WT rice or glucose intake, increased rapidly, reached at the peak 30 min after intake and then gradually declined to the baseline concentrations near 180 min after each meal. The highest levels of blood glucose after consuming RS rice (6·8 (sem 0·4) mmol/l) were significantly lower than that with WT rice (7·2 (sem 0·6) mmol/l, P < 0·05), although both values were significantly lower than that of glucose intake. Furthermore, the value of AUC for the RS rice meal was significantly smaller than that for the WT rice meal (P < 0·05), particularly at 1, 1·5, 2 and 4 h post-intake of meals. Importantly, the GI for the RS rice meal (48·4 (sem 21·8)) was lower than of the WT rice meal (77·4 (sem 34·9), P < 0·05). Together, these data indicated that consumption of RS-enriched rice reduced postprandial glycaemic responses in young and healthy Chinese adults. Insulin is a critical regulator for glucose metabolism. To determine the impact of RS rice meal on the production of insulin, the concentrations of plasma insulin for individual subjects were measured before and after consuming each type of foods (Fig. 2). The mean baseline insulin concentrations before the RS, WT rice or glucose intake were similar (6·7 (sem 2·3) v. 6·8 (sem 2·7) v. 6·1 (sem 1·5) × 10− 6 IU/ml, P>0·05), respectively. The highest concentrations of plasma insulin were detected 45 min after food intake and gradually declined near to the baseline levels 4 h after consuming foods. The concentrations of plasma insulin in subjects with the RS rice were significantly lower than that with WT rice at 45, 60, 90 and 120 min post-food intake, although their values were significantly lower than that with glucose intake. The values of insulin AUC at 1·5, 2 and 4 h post-intake of the RS rice were significantly reduced, as compared with that after WT rice. After adjusting to the reference glucose (100 %), the mean value of insulin index in subjects with the RS rice meal (34·2 (sem 18·9)) was significantly lower than that with the WT rice meal (54·4 (sem 22·4), P < 0·05). Collectively, consumption of RS-enriched rice reduced postprandial insulinaemic responses in those subjects.

Fig. 1 Analysis of the postprandial glycaemic responses in healthy Chinese adults. Young and healthy Chinese adults (n 16) were fasted overnight and consumed one type of the resistant starch (RS), wild-type (WT) rice and glucose meals. Their plasma glucose levels were measured before and after each type of foods at indicated time points. Data shown are the mean values with their standard errors of plasma glucose of all subjects after intake of each type of foods through the testing period of 4 h. Values of plasma glucose after the intake of the RS rice v. WT rice was determined by the Wilcoxon test (*P < 0·05). ♦, RS rice; ■, WT rice; ▲, glucose.

Fig. 2 Analysis of the postprandial insulinaemic responses in healthy Chinese adults. The levels of plasma insulin were measured before and after intake of each type of foods at indicated time points. Data are expressed as the mean values with their standard errors of plasma insulin of all subjects (n 16) after intake of each type of foods through the testing period of 4 h. Values of plasma insulin after the intake of the resistant starch (RS) rice v. wild-type (WT) rice was determined by the Wilcoxon test (*P < 0·05). ♦, RS rice; ■, WT rice; ▲, glucose.
Consumption of RS-enriched foods is usually associated with the production of large amount of SCFA, accompanied by higher levels of gases, such as CO2, CH4 and H2 from the fermentation in the large bowel. To test the effect of RS-enriched rice consumption on the fermentation-related gas production, the levels of breath H2 by individual subjects after the RS and WT rice were characterised by H2 breath tests over a period of 16 h (Fig. 3). There was no significant difference in the baseline levels of breath H2 before the intake of RS and WT rice. In contrast, the levels of breath H2 after the RS rice were remarkably higher, as compared with that after the WT rice (P < 0·05). The levels of H2 significantly increased at 5 h post the RS rice, reached the highest level near 7 h and flattened until 14 h, followed by declining slightly. The peak levels of breath H2 after the RS rice meal (38·9 (sem 17·6) parts per million) were significantly higher than after the WT rice (10·5 (sem 3·7) parts per million, P < 0·05). Thus, consumption of RS-enriched rice promoted high levels of breath H2 in young and healthy Chinese adults.

Fig. 3 Determination of breath H2 in healthy Chinese adults. The levels of breath H2 were measured by the breath H2 test before and after RS or WT rice meal at indicated time points. Data shown are the mean levels with their standard errors of breath H2 of all subjects (n 16) after intake of resistant starch (RS) or wild-type (WT) rice meal through the testing period of 16 h. Values of breath H2 after intake of the RS rice v. WT rice was determined by the Wilcoxon test (*P < 0·05). ♦, RS rice; ■, WT rice; ppm, parts per million.
Discussion
In the present study, we determined the postprandial glycaemic and insulinaemic responses to the GM RS-enriched rice and WT rice in young and healthy Chinese adults. In comparison with intake of WT rice or glucose meal, consumption of 40 g carbohydrates of RS rice meal significantly reduced the values of postprandial glycaemic and insulinaemic responses. Although the kinetics of blood glucose responses were similar after each type of meals, the highest concentrations of glucose, AUC and GI after RS rice meal were significantly lower than that of WT rice or glucose meal. Notably, although those subjects only consumed about 8 g RS, the dynamics of glucose responses were similar to those who consumed high doses of RS(Reference Behall and Hallfrisch18, Reference Granfeldt, Drews and Bjorck25). Similar patterns of insulinaemic responses were also observed in this group of Chinese adults. These lower glycaemic and insulinaemic responses to GM RS-enriched rice in Chinese adults were consistent with previous observations in other ethnical populations(Reference Behall, Hallfrisch and Scholfield26–Reference Behall and Hallfrisch29). Therefore, consumption of RS-enriched rice, regardless of whether it was GM, mitigated the postprandial glycaemic and insulinaemic responses in young and healthy Chinese adults. These effects indicated that consumption of RS rice meal produced lower levels of absorbable glucose, which stimulated low levels of insulin secretion.
Consumption of RS-enriched foods usually promotes the production of high levels of H2, CH4 and CO2 because the undigested RS usually enters into the colon where the RS is fermented by anaerobic bacteria(Reference Topping and Clifton3–Reference Cummings and Macfarlane8). We characterised the breath H2 after intake of RS and WT rice by the H2 breath test and found that very low levels of H2 were detected after WT rice meal. In contrast, significantly higher levels of H2 were observed after RS rice meal.
These data further indicated that the majority of RS had escaped the digestion in the intestine and entered into the large bowel, in which the RS rice was fermented by anaerobic bacteria in those subjects. Importantly, high levels of gases are usually accompanied by high levels of SCFA production in the large bowel. It is possible that consumption of RS-enriched rice may also promote high levels of SCFA production in those subjects. Previous studies have shown that those SCFA, particularly for acetic, propionic and butyric acids, can lower caecal and faecal pH(Reference Le Leu, Brown and Hu30, Reference Li, Piao and Liu31) and promote electrolyte and fluid absorption(Reference Musch, Bookstein and Xie32), which assists in the prevention of diarrhoea. The butyrate may promote the growth of colonocytes(Reference Park, Kang and Chang10, Reference Vernia, Annese and Bresci33, Reference Luhrs, Gerke and Schauber34), but inhibit tumour growth(Reference Bauer, Florian and Muller35–Reference Mortensen and Clausen37). SCFA can also change residential bacterial colonies in the large bowel, benefiting the body's health. Therefore, consumption of GM RS-enriched rice may also have beneficial effect on the health of the large bowel. However, whether what types and how much SCFA can be produced by consumption of GM RS-enriched rice in human remain to be further determined.
Unlike many studies of RS-enriched maize origin using 13CO2(Reference Symonds, Kritas and Omari38, Reference Christian, Amarri and Franchini39), we chose H2 as an indicative gas of RS fermentation. The similar kinetics and levels of H2 suggest that this method is feasible and reasonable for the assessment of H2 from the fermentation of RS-enriched rice in human subjects. Notably, some subjects showed higher levels of baseline H2, which might be due to the residual accumulation of H2 in the colon. We observed that this high baseline H2 declined within the first few hours, near the real basal level 3·5 h after the beginning of the test, consistent with a previous report(Reference Asp, Hertzler and Chow40). Conceivably, the values of H2 at 3·5 h post-food intake may represent the true baseline level of breath H2. In addition, we continued to test breath H2 for 16 h, which was longer than 12 h commonly used(Reference Symonds, Kritas and Omari38, Reference Jenkins, Vuksan and Kendall41), because the levels of breath H2 12 h after the RS rice meal were still higher than that of control with WT rice. This longer effect of the RS rice intake on the production of H2 may be because of unique genetic background of Chinese. Alternatively, this may be attributed to the GM RS-enriched rice that was slow to be fermented. Nevertheless, prolongation of the breath H2 test to 16 h may be better to measure the fermentation of RS-enriched foods, particularly for the GM RS-enriched rice.
In summary, our data indicated that consumption of the GM RS-enriched rice reduced the postprandial glycaemic and insulinaemic responses, accompanied by producing high levels of the breath H2 in young and healthy Chinese adults. The present findings suggest that consumption of the RS rice may be beneficial for human health. Further studies are needed to determine the safety and beneficial effects of long-term consumption of the GM RS-enriched rice.
Acknowledgements
We thank the Key Laboratories of Plant Functional Genomics of the Ministry of Education in Agricultural College of Yangzhou University for providing the GM RS-enriched and wild-type rice samples. The present study was supported by the research grant (2007CB109207) from the Ministry of Science and Technology of the People's Republic of China (973 programme). We thank all volunteers for their understanding, cooperation and support in the present study. The authors' responsibilities were as follows: M. L. participated in the design of the experiment, the data collection, data analysis and writing of the manuscript; J.-H. P. assisted with the data collection and analysis; Y. T. participated in the design of the experiment, data collection and data analysis; W.-D. L. participated in the design of the experiment and assisted with the data analysis and the drafting of the manuscript; X.-G. Y. participated in the design of the experiment, guidance during all aspect of the experimental protocol, data analysis and writing of the manuscript. K.-J. L. assisted with the coordination of the field experiment and the data collection. All of the authors participated in a critical review and in the final approval of the manuscript. None of the authors had a personal or financial conflict of interest.


