


The macronutrient composition of a diet is known to influence energy intake, energy metabolism and long-term changes to body weight and body composition. High-protein diets (HP diets) have been studied extensively for their ability to reduce total energy intake and body weight, and to limit lipid depositionReference Baba, Sawaya, Torbay, Habbal, Azar and Ashim1–Reference Westerterp5. Of the dietary proteins, dairy proteins are widely employed as ingredients in order to increase the protein content in the formulation of high protein-containing foods. Dairy proteins comprise two major fractions, i.e. casein and whey protein, that represent 80 and 20 % of the total protein, respectively. Both caseins and whey proteins are considered to be high-quality proteins but they differ markedly with respect to their physicochemical properties, their amino acid composition, and their behaviour during digestion and absorption in the intestineReference Mahe, Roos, Benamouzig, Davin, Luengo, Gagnon, Gausseres and Rautureau6. These differences give rise to different patterns and kinetics of amino acid delivery to the blood, and are responsible for a variety of effects on protein metabolism following the ingestion of either casein or whey proteinReference Lacroix, Bos and Leonil4, Reference Boirie, Dangin, Gachon, Vasson, Maubois and Beaufrere7. Whether these differences might also affect energy intake, energy metabolism and long-term changes to body weight and body composition in response to high-protein foods formulated with casein or whey protein, remains poorly documented. Moreover, not only the protein content but also the associated carbohydrate to lipid (C/L) ratio has been demonstrated to influence lipid depositionReference Marsset-Baglieri, Fromentin, Tome, Bensaid, Makkarios and Even8, Reference Pichon, Huneau, Fromentin and Tome9. The aim of the present study was thus to evaluate energy intake, body weight, body composition, and plasma hormones and nutrients in rats adapted to different HP diets that differed in terms of both protein type (whole milk protein, whey protein or whey protein enriched with β-lactoglobulin (βLac), the main constituent of whey protein) and the C/L ratio.
Materials and methods
Animals and diets
Twelve-week-old male Wistar rats (Harlan, Horst, The Netherlands), weighing 290 ± 5 g at the beginning of the experiment, were individually housed in stainless-steel cages located in a temperature-controlled room (22 ± 1°C) with a 12 h light–dark cycle (lights on 00.00–12.00 hours), throughout the experiments. All experimental procedures used during the study complied with the guidelines issued by the French National Animal Care Committee. The composition of the ten diets used during the study is shown in Table 1. All were AIN 93M modified dietsReference Reeves, Nielsen and Fahey10 and were prepared by the “Feed Preparation Laboratory” (INRA, Jouy en Josas, France). Instead of casein and cystine, the P14L10C76 diet (normal protein (NP) diet) contained 140 g whole milk protein/kg feed. All other diets were HP diets. These diets were chosen in order to study the effects of both protein type and C/L ratio. Three formulations were chosen with respect to the C/L ratio of the diets. HP/low-fat/high-carbohydrate diets (P55C35L10) contained 55 % of energy as protein, 35 % as carbohydrate and 10 % as lipid. HP/high-fat/low-carbohydrate diets (P55C15L30) contained 55 % of energy as protein, 15 % as carbohydrate and 30 % as lipid. HP/high-fat/carbohydrate-free diets (P55L45) contained 55 % of energy as protein and 45 % as lipid. All three formulations were prepared using three different milk protein fractions. The following bovine milk protein fractions from Armor Protéines were used: Milk (whole milk proteins) was a mixture of casein (85 %) and whey milk proteins. Whey was a standard whey protein concentrate prepared from cheese whey. βLac was a specific whey protein isolate, prepared from cheese whey using ion-exchange chromatography, and was particularly rich in native β-lactoglobulin. Chemical data concerning these protein sources are shown in Table 2. Amino acid concentrations of the protein fractions were determined by HPLC combined with post-column ninhydrin derivatization. Separation was performed on a cation exchange resin column and the amino acids were detected at 570 nm (440 nm for proline). α-Lactalbumin, β-lactoglobulin and casein-glycomacropeptide concentrations of the protein fractions were determined by steric exclusion HPLC. Protein fraction profiles are presented in Fig. 1.
Table 1 Composition of diets
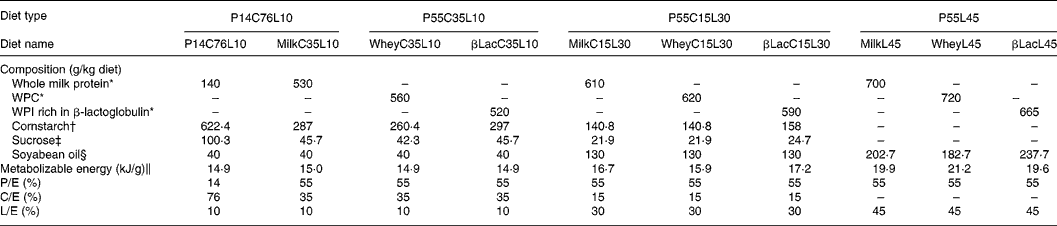
C/E, carbohydrate to energy ratio; L/E, lipid to energy ratio; P/E, protein to energy ratio; WPC, whey protein concentrate; WPI, whey protein isolate.
* Armor Protéines, Saint Brice en Coglès, France.
† Cerestar, Haubourdin, France.
‡ Eurosucre, Paris, France.
§ Bailly SA, Aulnay-sous-bois, France.
‖ Metabolizable energy was calculated.
Table 2 Chemical composition of the protein sources Milk, Whey and βLac
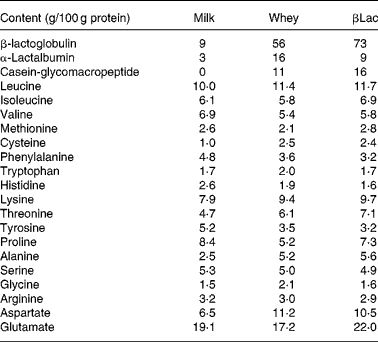
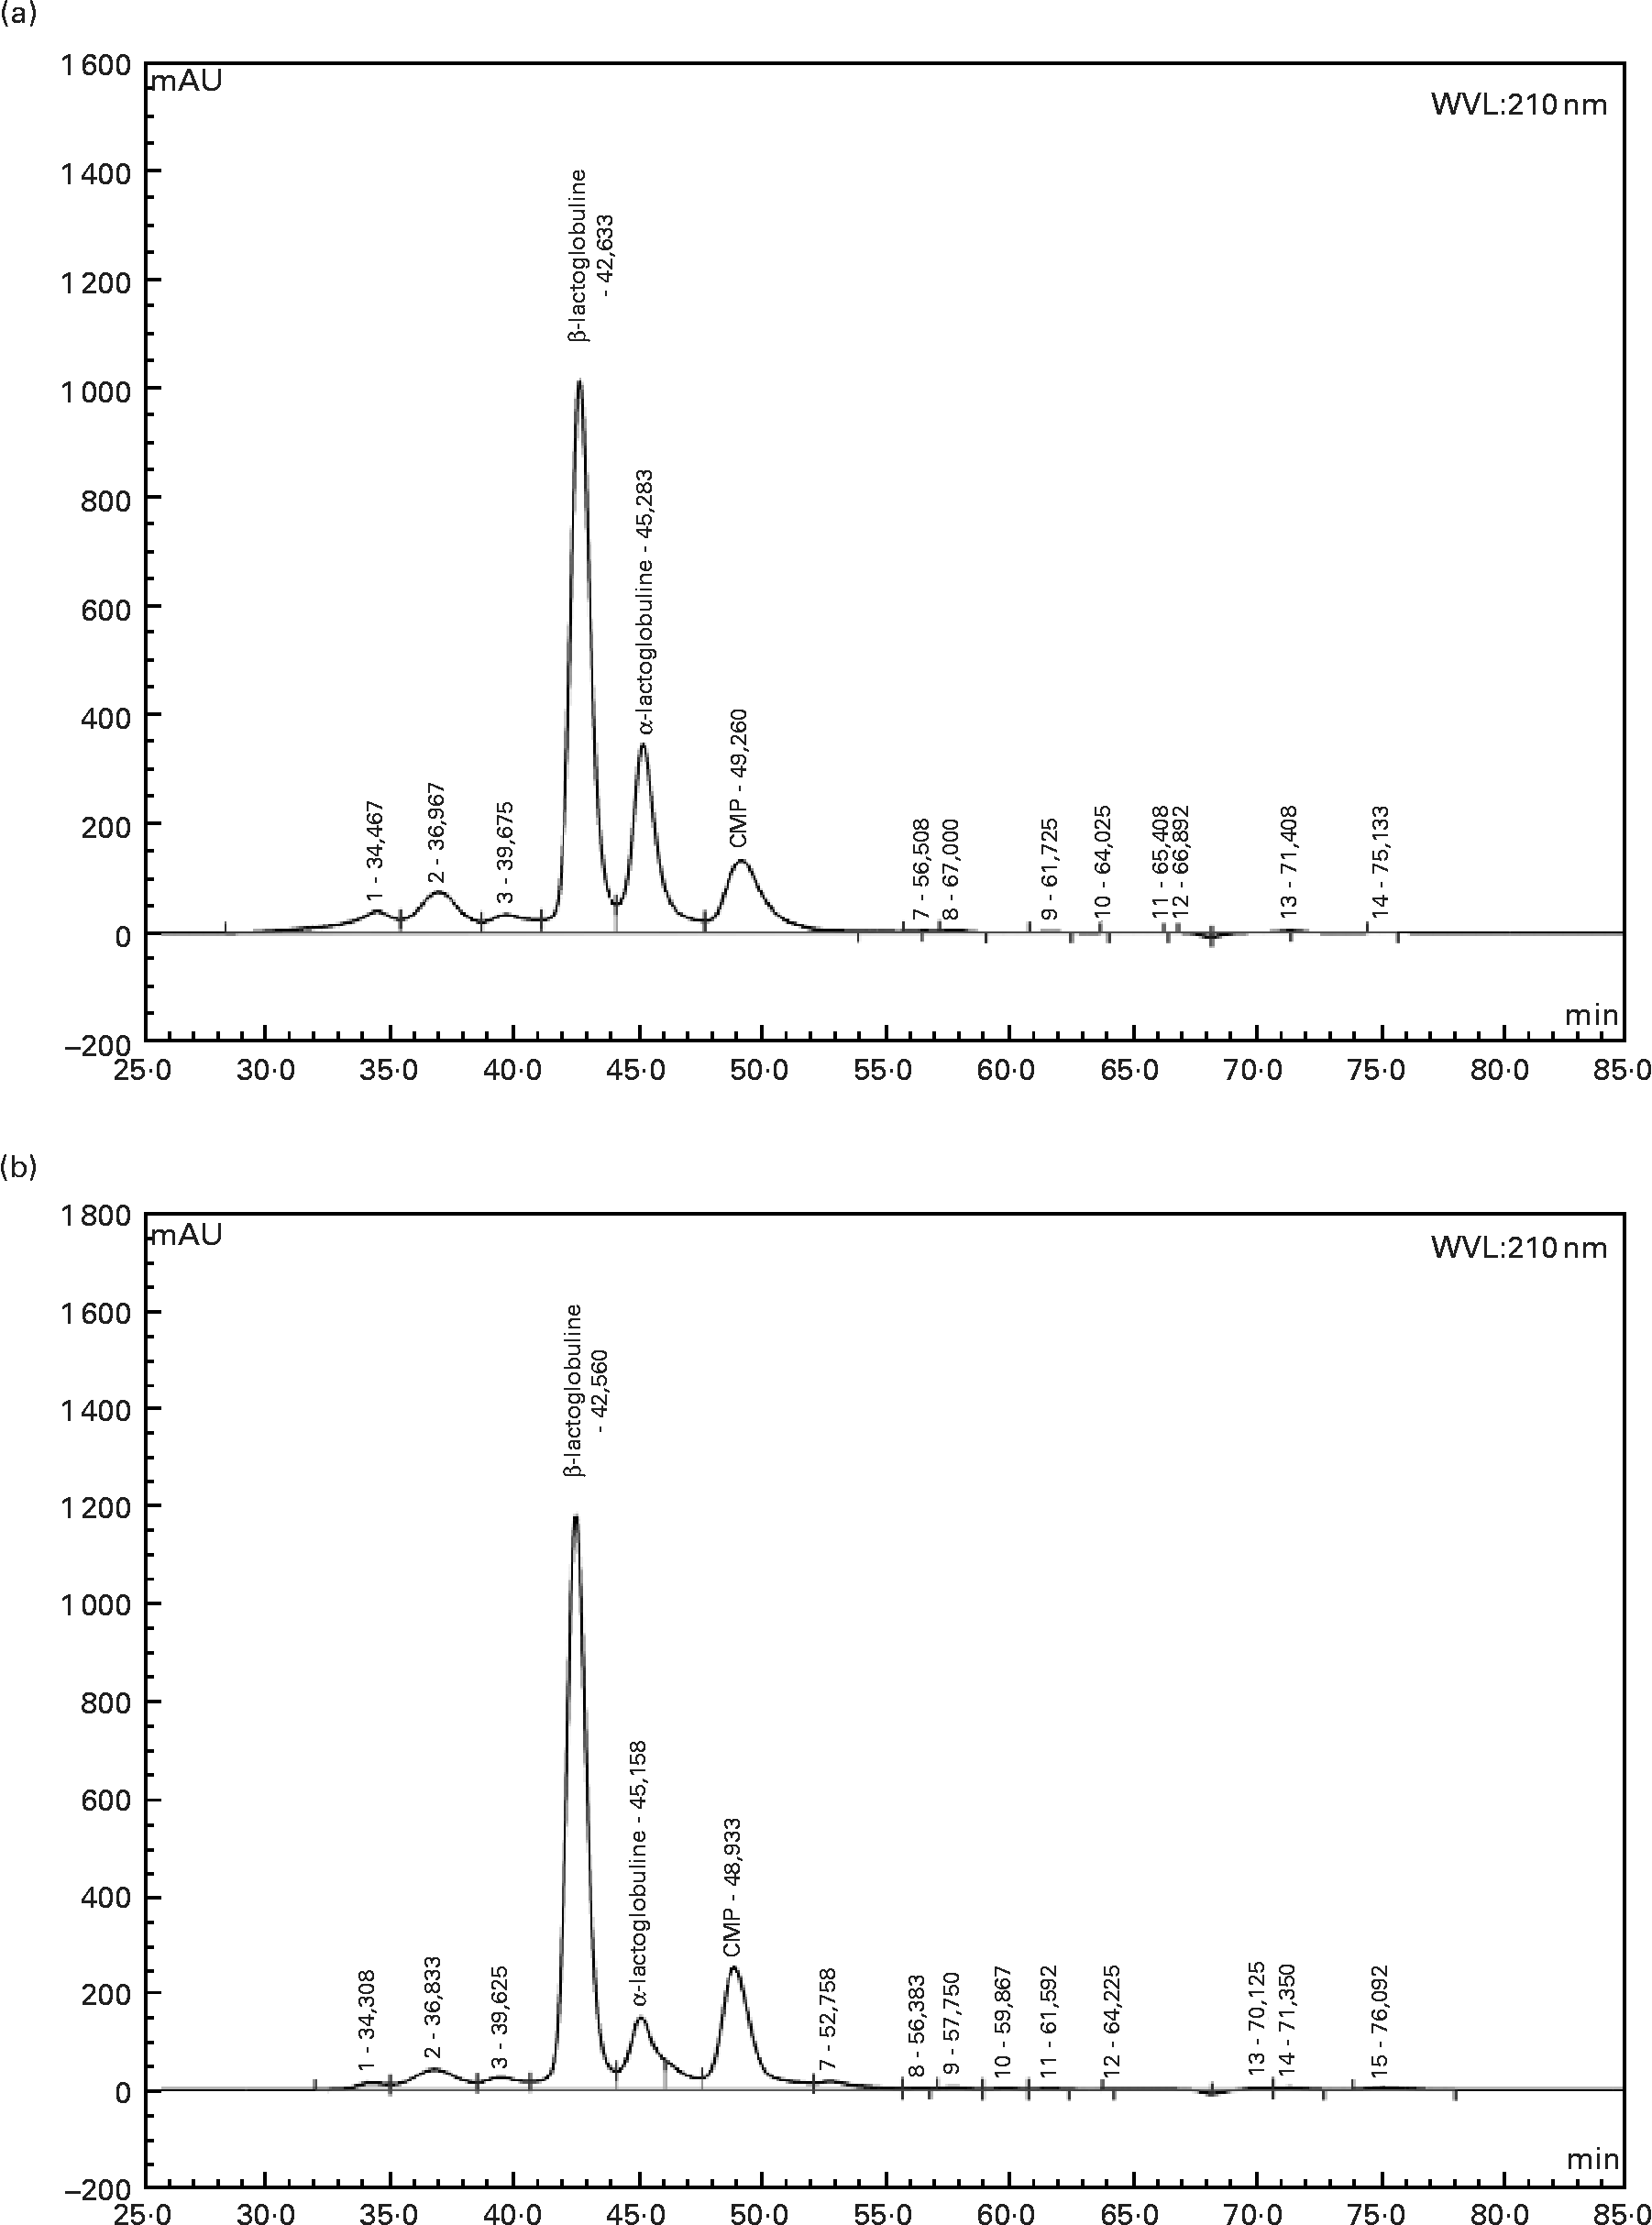
Fig. 1 HPLC chromatograms of whey (a) and β-lactoglobulin (b): determination of α-lactalbumin, β-lactoglobulin and caseino-glycomacropeptide (CMP) contents at wavelength 210 nm.
Unless otherwise specified, all diets were moistened to minimize spillage. Energy intake was determined by the difference in the weight of a food cup before and after each experimental period, corrected for spillage, the amount of water added and evaporation. These cups were refilled daily at 12.00 hours with fresh food. All rats had free access to water throughout the experiments.
Procedures
For the first 10 d of the experiment (pre-feeding period), rats were adapted to laboratory conditions and allowed free access to the P14C76L10 diet (baseline feed). During the last day of the pre-feeding period (referred to as day 0) the rats were divided into ten groups of eight rats with similar mean body weights (346 ± 2 g). Thereafter, each group was fed ad libitum for 25 d with the diet corresponding to its group. The NP group received the P14C76L10 diet. Three P55C35L10 groups (MilkC35L10, WheyC35L10 and βLacC35L10) were fed a HP/low-fat/high-carbohydrate diet containing each protein source. Three P55C15L30 groups (MilkC15L30, WheyC15L30 and βLacC15L30) were fed a HP/high-fat/low-carbohydrate diet. Three P55L45 groups (MilkL45, WheyL45, βLacL45) were fed a HP/high-fat/carbohydrate-free diet. Body weight and daily energy intake were monitored for 25 d. An energy efficiency ratio was calculated as the weight gain (g) observed during the experimental period divided by the cumulative energy intake over the same period (kJ). At day 25, after overnight food deprivation, the rats were weighed, anaesthetized with an overdose of sodium pentobarbital (45 mg/kg) and treated with heparin. Blood was collected from the vena cava. The following tissues and organs were then dissected and weighed to the nearest 0·01 g: liver, kidneys, carcass (muscles with skeleton, without head, paws and tail) and epididymal, retroperitoneal, mesenteric and subcutaneous white adipose tissues (WAT). An adiposity index (AI) was calculated by dividing the total WAT weight by the empty body weight.
Plasma hormones, glucose and lipids
Glycaemia was measured after overnight food deprivation. Blood was collected from a superficial vein in a hind paw and blood sugar levels were measured immediately using a glucometer (Glucotrend 2; Roche Diagnostic GmbH, Mannheim, Germany). Assays of plasma TAG and total and HDL-cholesterol were performed using a Mascott +3X spectrophotometer (Lisabio, Pouilly-en-Aixois, France). Plasma hormones were quantified using RIA kits with 125I as a tracer: INSIK-5 and GammaCoat 125I Cortisol RIA (Diasorin, Antony, France) for insulin and cortisol, and LEP-R61 (Mediagnost, Tuebingen, Germany) for leptin. The radioactivity of the tracer was quantified using a gamma scintillation counter (Cobra II Auto-Gamma; Perkin-Elmer). The Homeostasis Model Assessment of Insulin Resistance index (HOMA-IR) was calculated using the formula: fasting insulin (μUI/ml) × fasting glucose (mmol/l)/22·5Reference Conwell, Trost, Brown and Batch11.
Statistics
Results are expressed as means and their standard errors. Differences between the NP and HP groups were determined by one-way ANOVA (Proc GLM, SAS version 6.11, Cary, NC, USA). When a comparison between the NP and HP groups was necessary, group effects are presented in the text. Afterwards, only the nine HP groups were retained in order to study the protein type and C/L ratio effects in the context of a HP diet. Two-way ANOVA was performed to test the effects of the protein type, the C/L ratio of the diet and the interaction between these two parameters. Within each C/L ratio and each protein type, the effects of protein type and C/L ratio, respectively, were evaluated by one-way ANOVA. These effects are presented in the tables. The level of significance was set at P < 0·05, and when a significant effect was revealed by ANOVA, differences between individual means were determined using a post hoc test (Tukey's HSD, P < 0·05). A tendency was mentioned if P < 0·1.
Results
Energy intake, body weight gain and energy efficiency
Normal protein versus high-protein diets
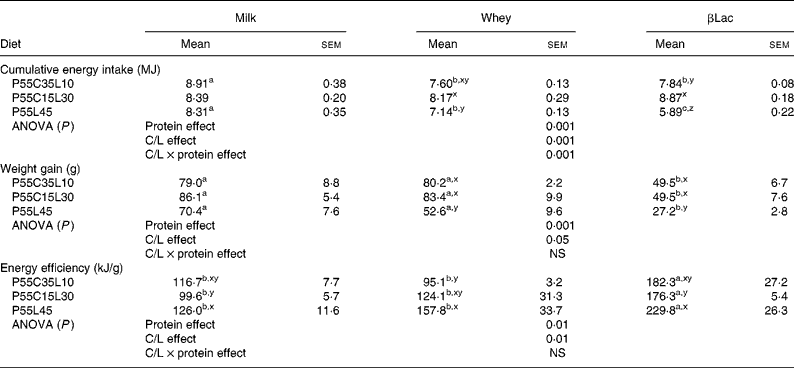
During the 10 d adaptation period with the NP diet, the daily energy intake was 417 (sem 11) kJ/d and body weight gain reached 5·7 (sem 1·1) g/d. During the last day of the adaptation period, the rats weighed 346 (sem 2) g. At the end of the experiment, the average cumulative energy intake of the normal group receiving the NP diet was 10 300 (sem 327) kJ and the body weight gain was 119 (sem 5) g. The NP group ate more and gained more weight than all other groups fed the HP diets (for HP values see Table 3, P < 0·001).
Table 3 Body weight gain, cumulative energy intake and energy efficiency of rats (n 8) after the ad libitum consumption for 25 d of normal or high-protein diets differing in terms of protein type and carbohydrate to lipid ratio (C/L)*
(Mean values with their standard errors)
abc For each C/L ratio, a protein type effect was calculated. Mean values within a row with unlike superscript letters were significantly different (P < 0·05).
xyz For each protein type, a C/L ratio effect was calculated. Mean values within a column with unlike superscript letters were significantly different (P < 0·05).
* See Table 1 for details of diets. Global protein type effect, C/L ratio effect and protein type × C/L ratio interaction effects were calculated for each parameter and are indicated in the lines entitled ANOVA.
Protein type and carbohydrate to lipid ratio effects in the context of high-protein diets (Table 3)
Firstly, cumulative energy intake was influenced by both the protein type and the C/L ratio of the diets (protein type effect and C/L ratio effect: P < 0·001 in both cases, interaction between protein type and C/L ratio effects: P < 0·001). If P55C35L10 diets only were considered, both Whey and βLac led to a greater reduction in energy intake than milk protein. No difference was observed when considering P55C15L30 diets. With the P55L45 diet, the differences between protein type were greater: Whey and βLac both led to a reduction in energy intake, with a stronger effect for βLac. On the other hand, the C/L effect depended on protein type: no C/L effect was observed with Milk, but the P55L45 diet led to a reduction in energy intake when considering the Whey or βLac protein fractions.
Secondly, the protein type and C/L ratio influenced weight gain and energy efficiency (protein effect, P < 0·001 in both cases; C/L effect, P < 0·05, P < 0·01, respectively, no interaction between protein type effect and C/L ratio effect). In each C/L ratio category, weight gain was significantly the lowest with βLac protein fraction. Moreover, for each protein type, P55L45 diets led to the smallest weight gain (except in the case of Milk, with which there was only a statistical trend). Energy efficiency was always the highest with βLac, whatever the C/L ratio, and it was the most marked with the P55L45 diet (except in the case of Whey, with which there was only a statistical trend).
In conclusion, the presence of βLac and a total absence of carbohydrate (P55L45 diet) significantly enhanced the depression of body weight gain and enhanced energy efficiency. In addition, an interaction between the C/L and protein effects was observed with respect to energy intake, showing that the depressive effect of βLac was the strongest with a P55L45 diet and that if each protein studied was considered separately, the depressive effect of the P55L45 diet on energy intake only existed with Whey and βLac fractions.
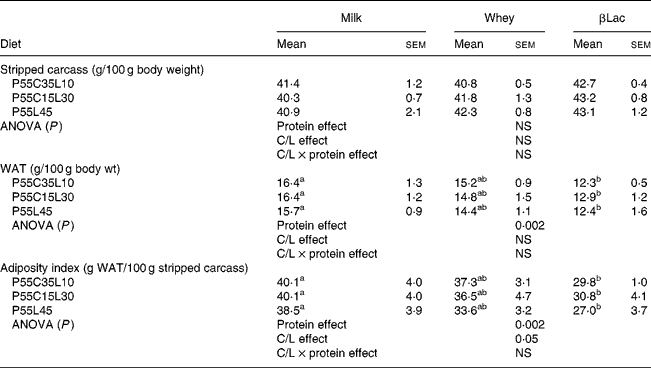
Body composition
Normal protein versus high-protein diets
The WAT content (expressed as the total WAT weight divided by the total body weight) and AI (expressed as the total WAT weight divided by the total empty body weight) were lower in rats fed HP diets when compared to the NP diet (NP values: 25·7 (sem 1·1) for WAT content and 68·7 (sem 4·4) for AI; for HP values see Table 4, P < 0·0001 for both parameters). The stripped carcass content was lower in rats fed the NP diet than in rats fed an HP diet (NP values: 37·7 (sem 0·9); for HP values see Table 4, P < 0·05).
Table 4 Organ weights of rats (n 8) after the ad libitum consumption for 25 d of high-protein diets differing in terms of protein type and carbohydrate to lipid ratio (C/L)*
(Mean values with their standard errors)
WAT, white adipose tissue.
ab For each C/L ratio, a protein type effect was calculated. Mean values within a row with unlike superscript letters were significantly different (P < 0·05).
* See Table 1 for details of diets. Global protein type effect, C/L ratio effect and protein type × C/L ratio interaction effects were calculated for each parameter and are indicated in the lines entitled ANOVA.
Protein type and carbohydrate to lipid ratio effects in the context of high-protein diets (Table 4)
The WAT content and AI were dependent on protein type (protein effect: P < 0·002 for both parameters). For each C/L ratio category, the WAT content and AI were lower in rats receiving βLac-containing HP diets than in rats fed the Milk-containing HP diet. No differences were observed between Whey and Milk or between Whey and βLac. Moreover, the C/L ratio exerted an effect on AI (C/L effect, P < 0·05). When each protein type was considered separately, this result was only a trend (P < 0·01): AI was lower in rats fed P55L45 diets than in rats fed P55C35L10 or P55C15L30 diets.
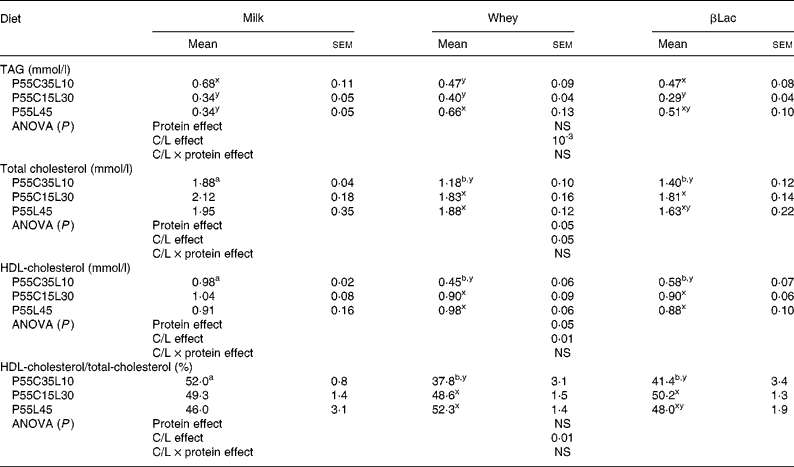
TAG and cholesterol
Normal protein versus high-protein diets
TAG levels were higher in the NP group than in HP groups (1·33 (sem 0·36) mmol/l in the NP group; for HP values see Table 5, P < 0·01). No difference was observed between NP and HP groups concerning total cholesterol levels (1·84 (sem 0·12) mmol/l in the NP group), but HDL-cholesterol levels and the HDL/total cholesterol ratio were lower in the NP group than in HP groups (HDL-cholesterol concentration: 0·95 (sem 0·10) mmol/l in the NP group; HDL/total cholesterol concentration: 51·7 (sem 4·1) % in the NP group). Considering that a high triglyceridaemia and a low HDL-cholesterol concentration are two of the five criteria for metabolic syndrome, we can conclude that the HP diet led to a more favourable lipid profile than the NP diet.
Table 5 Circulating lipid levels in rats (n 8) after ad libitum consumption for 25 d of high-protein diets differing in terms of their protein type and carbohydrate to lipid ratio (C/L)*
(Mean values with their standard errors)
ab For each C/L ratio, a protein type effect was calculated. Mean values within a row with unlike superscript letters were significantly different (P < 0·05).
xy For each protein type, a C/L ratio effect was calculated. Mean values within a column with unlike superscript letters were significantly different (P < 0·05).
* See Table 1 for details of diets. Global protein type effect, C/L ratio effect and protein type × C/L ratio interaction effects were calculated for each parameter and are indicated in the lines entitled ANOVA.
Protein type and carbohydrate to lipid ratio effects in the context of high-protein diets (Table 5)
Plasma TAG concentrations were not dependent on protein type but only on the C/L ratio (C/L effect: P < 0·001) and the P55C15L30 diet led to the most favourable profile. In the case of βLac, the P55C15L30 diet led to the lowest TAG concentration. The result was the same with milk and whey, but only a statistical trend could be observed.
Cholesterol levels are dependent on both protein type and the C/L ratio: Whey and βLac always led to the lowest concentrations (although only a trend was observed with the P55C15L30 and P55L45 diets). P55C35L10 always led to the lowest cholesterol concentration (only a trend with the Milk fraction). HDL-cholesterol levels were also dependent on both protein type and the C/L ratio. Differences between protein type only existed in the case of the P55C35L10 diet: Whey and βLac led to lower concentrations than milk. There was insufficient difference between the protein type in the P55C15L30 and P55L45 diets to reach any clear conclusions. Differences between the C/L ratio for whey and βLac showed that P55C35L10 always led to the lowest HDL-cholesterol concentrations. No differences were observed when diets contained milk.
The proportion of HDL-cholesterol was not globally dependent on protein type, but only on the C/L ratio (C/L effect, P < 0·01). For each protein type (except with the Milk fraction, where results were not significantly different), the P55C15L30 and P55L45 diets led to the highest proportion of HDL-cholesterol, whereas P55C35L10 diets led to the lowest proportion.
In conclusion, Whey and βLac led to lower, and thus more favourable total cholesterol concentrations than Milk; however, these two protein fractions could (as in the case of the P55C35L10 diet) produce less favourable profiles in terms of HDL-cholesterol concentrations. Concerning the C/L ratio, P55C35L10 diets led to lower, and thus more favourable total cholesterol concentrations than P55C15L30 or P55C35L10, but on the other hand, this diet led to a less favourable profile in terms of HDL-cholesterol concentrations. Finally, the crucial parameters affecting metabolic syndrome are the TAG concentration and the proportion of HDL-cholesterol. These parameters are globally independent of protein type, and the present results suggest that the most favourable lipid profile was obtained with the P55C15L30 diet.
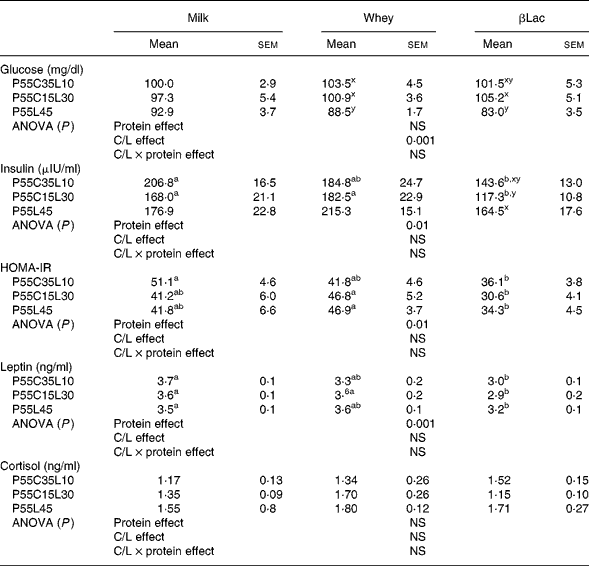
Plasma hormones and glucose
Normal protein versus high-protein diets
No differences were observed regarding glycaemia or cortisol between the NP and HP groups (99·8 (sem 7·3) mg/dl and 1·78 (sem 0·23) ng/ml for glycaemia and cortisol levels in the NP group). Insulin and leptin concentrations were higher in the NP group than in HP groups (insulin concentrations: 259·1 (sem 22·8) μUI/ml in the NP group, P < 0·005; leptin concentrations: 5·1 (sem 0·2) ng/ml in the NP group, P < 0·0001).
Protein type and carbohydrate to lipid ratio effects in the context of high-protein diets (Table 6)
Fasting glycaemia values were dependent on the C/L ratio but not on protein type (C/L effect, P < 0·001). P55L45 diets were the most effective in depressing glycaemia. Fasting plasma insulin and leptin concentrations and HOMA-IR were dependent on protein type (P < 0·01, P < 0·001, P < 0·01, respectively) but not on the C/L ratio. βLac was the most efficient in reducing insulinaemia, leptinaemia and HOMA-IR. Cortisol was neither protein type nor C/L ratio-dependent.
Table 6 Biochemical characteristics in rats (n 8) after ad libitum consumption for 25 d of high-protein diets differing in terms of their protein type and carbohydrate to lipid ratio (C/L)*
(Mean values with their standard errors)
HOMA-IR, Homeostasis Model Assessment of Insulin Resistance index.
ab For each C/L ratio, a protein type effect was calculated. Mean values within a row with unlike superscript letters were significantly different (P < 0·05).
xy For each protein type, a C/L ratio effect was calculated. Mean values within a column with unlike superscript letters were significantly different (P < 0·05).
* See Table 1 for details of diets. Global protein type effect, C/L ratio effect and protein type × C/L ratio interaction effects were calculated for each parameter and are indicated in the lines entitled ANOVA.
Discussion
The purpose of the present study was to determine whether different milk protein fractions (i.e. casein v. whey proteins) and the carbohydrate to lipid content of the diet affected daily energy intake, body weight and adiposity, blood glucose parameters and blood lipid profiles in rats fed a high-protein diet. In these animals, energy intake, body weight gain and adiposity are modulated both by protein type and the carbohydrate to lipid content of the diet. By contrast, metabolic hormone parameters are only modulated by protein type and blood lipid profiles by the carbohydrate to lipid content of the diet.
Normal protein versus high-protein diets
The results confirmed that the long-term feeding of rats with a HP diet reduced energy intake, body weight gain and fat deposition, and improved the plasma lipid profile when compared with a NP diet in the ratReference Peters and Harper3, Reference Jean, Rome, Mathe, Huneau, Aatouri, Fromentin, Achagiotis and Tome12, Reference Lacroix, Gaudichon, Martin, Morens, Mathe, Tome and Huneau13. The lower energy intake and adiposity observed with high-protein feeding may have resulted from both the greater satiety induced by proteinsReference Bensaid, Tome, Gietzen, Even, Morens, Gausseres and Fromentin2, Reference Blouet, Mariotti, Azzout-Marniche, Bos, Mathe, Tome and Huneau14–Reference Vandewater and Vickers16 and a different metabolic response to a protein meal intakeReference Klein and Wolfe17, Reference Soucy and Leblanc18. Substituting carbohydrates with protein may play a role (as explained later), but proteins also exert a specific thermogenic effect. The fact that HP diets lead to muscle deposition is still highly controversialReference Morens, Gaudichon, Fromentin, Marsset-Baglieri, Bensaid, Larue-Achagiotis, Luengo and Tome19, Reference Wolfe20, but we observed here that fat-free mass was enhanced with a HP diet compared to a NP diet. This difference may be due to the high quality of the protein used, which could lead to a greater availability of leucine, a key amino acid in muscle metabolismReference Greiwe, Kwon, McDaniel and Semenkovich21. Because it has been shown in adults that without physical activityReference Morens, Gaudichon, Fromentin, Marsset-Baglieri, Bensaid, Larue-Achagiotis, Luengo and Tome19, an excess of dietary amino acid does not lead to higher muscle deposition, the rats we used for our experiments were still more or less in a growing state. The high leucine concentrations to which they were exposed long term may have caused a different orientation of metabolites during the growing state. Further investigations on nitrogen muscle metabolism in this physiological context are required to elucidate this possibility.
Energy intake, body weight gain and adiposity
In rats receiving a HP diet, both the milk protein fraction (whole milk protein, whey protein or β-lactoglobulin-enriched fraction) and the C/L ratio (P55L45, P55C35L10 or P55C15L30) of the diet influenced energy intake, body weight and adiposity. However, the difference in energy intake depression observed within these HP diets may partly have been due to the fact that such diets combine parameters that can cause a greater (high lipid content and/or presence of carbohydrates) or less palatability (high protein content or protein type), Moreover, a difference in texture may also partly explain effects on energy intake.
Firstly, in the context of a HP diet, the C/L ratio exerts its own, independent effects: with every protein studied, HP/high-fat/carbohydrate-free diets (e.g. the Atkins diet) can reduce weight gain, energy efficiency and adiposity without any interaction with the protein type effect. On the other hand, during the present study, body weight gain and adiposity were also dependent on the type of milk protein fraction. Whey-derived protein fractions (i.e. Whey and βLac) enabled a more drastic reduction in energy intake, except in the case of P55C15L30 diets. Nevertheless, the reduction in energy intake observed with Whey and βLac was not related to a poorer palatability of the protein sources because the palatability of βLac, Whey and Milk was similar under the present experimental conditions (as determined from the choice experiments, results not shown). The reduction in energy intake observed with Whey and βLac was unlikely to originate from an imbalanced amino acid compositionReference Harper, Benevenga and Wohlhueter22 because both protein fractions contained well-balanced amino acids. By contrast, an enhanced satiating effect of whey-derived proteins was consistent with previous observationsReference Anderson and Moore23, Reference Hall, Millward, Long and Morgan24. This effect could be related to a more important secretion of gut neuropeptides in response to Whey and βLac, including cholecystokinin or glucagon-like peptide-1 (GLP-1) which are known to be involved in the induction of satiation and/or satietyReference Hall, Millward, Long and Morgan24, Reference Hayes and Covasa25 Both fractions contained high levels of the glycomacropeptide suspected of stimulating cholecystokinin secretionReference Corring, Beaufrere and Maubois26, Reference Pedersen, Nagain-Domaine, Mahe, Chariot, Roze and Tome27. The effects of Whey and βLac may also have partly originated from the release in plasma of branched chain amino acids (particularly leucine), previously described as modulating energy intake, energy metabolism and glucose homeostasisReference Cota, Proulx, Smith, Kozma, Thomas, Woods and Seeley28. Further investigations are needed to explain the energy intake depression observed with Whey and βLac. An interaction between the C/L ratio and protein type effects was observed with respect to energy intake, showing that the depressive effect of βLac was the strongest with a P55L45 diet. A synergistic effect appears to exist between whey-derived protein fractions and carbohydrate-free diets. The present results suggest that in order to optimize the satietogenic effect of whey-derived protein fractions, the diet must have a low carbohydrate content and/or a high lipid content.
Blood lipid parameters
Although HP/high-fat/carbohydrate-free diets are able to enhance energy efficiency by reducing anabolic and storage reactions and thus cause reduced weight gain and adiposity by enhancing lipolysis, they also produce a less favourable lipid profile than a P55C15L30 diet. Indeed, triglyceridaemia and HDL-cholesterol levels were the most favourable with the P55C15L30 diet. Moreover, it seems that the reduction in carbohydrate content when switching from a P55C35L10 to a P55C15L30 diet prevented excessive carbohydrate conversion into lipid and therefore produced a more favourable lipid profile (Fig. 2). A total absence of carbohydrate (P55L45 diets) led to a drastic reduction in fatty acid synthesis by the liverReference Pichon, Huneau, Fromentin and Tome9, which may have explained the reduction in the AI. However, this may have been counteracted by the very high lipid content in this diet which caused an unfavourable circulating lipid profile. The present results suggest that a P55C35L10 diet seemed to be more favourable than a P55L45 diet with respect to metabolic syndrome.
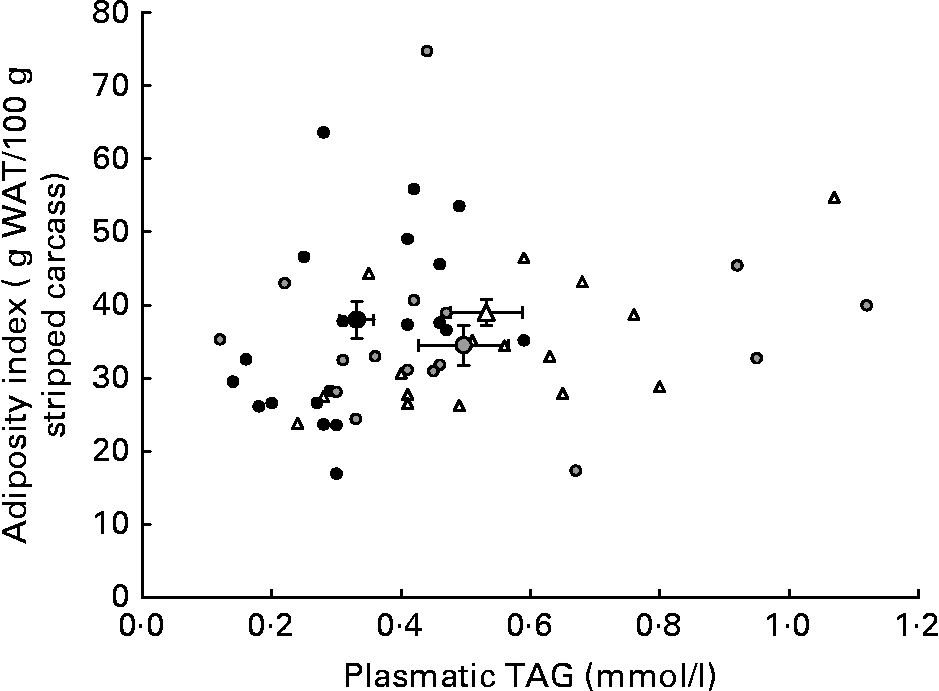
Fig. 2 Adiposity index as a function of plasma TAG concentration in rats fed ad libitum for 25 d with high-protein diets differing in terms of their protein type and carbohydrate to lipid ratio. The small symbols represent responses of individual rats receiving: (△) a P55C35L10 diet, whatever the protein type; (●) a P55C15L30 diet, whatever the protein type; (![]() ) a P55L45 diet, whatever the protein type. The large symbols represent means, with their standard errors indicated by horizontal and vertical bars: (△), mean of all P55C35L10 rats, whatever the protein type; (●), mean of all P55C15L30 rats, whatever the protein type; (
) a P55L45 diet, whatever the protein type. The large symbols represent means, with their standard errors indicated by horizontal and vertical bars: (△), mean of all P55C35L10 rats, whatever the protein type; (●), mean of all P55C15L30 rats, whatever the protein type; (![]() ), mean of all P55L45 rats, whatever the protein type. See Table 1 for details of diets. WAT, white adipose tissue.
), mean of all P55L45 rats, whatever the protein type. See Table 1 for details of diets. WAT, white adipose tissue.
Glucose and blood metabolism hormones
The metabolic results show that carbohydrates play a central role in energy homeostasis. Indeed, they demonstrated that it is not the dietary lipid content per se that is responsible for increased adiposity and weight gain. Rather, it is the combination of carbohydrates and lipids that leads to obesity. Indeed, carbohydrates are the principal insulin secretagogue nutrients. Without carbohydrates, postprandial insulin levels remain low so that the conversion of carbohydrates into lipid storage is not activatedReference Carmel, Konijn, Kaufman and Guggenheim29. In the context of a HP diet, we can hypothesize that the replacement of carbohydrates by lipids will enable a direct reduction in the amount of carbohydrates potentially converted into lipids, and also reduce insulin secretion. However, we did not observe any differences between C/L ratios concerning circulating insulin concentrations. The present measurements were performed in a fasting state, which might explain the lack of difference observed. Further studies focused on postprandial circulating insulin concentrations may make it possible to confirm this hypothesis. The reduction in circulating glucose levels observed with a carbohydrate-free diet is directly correlated to this absence of carbohydrates. As explained later, protein type (and specially βLac) and not the C/L ratio, improved blood glucose hormone values.
Interest of a β-lactoglobulin-enriched fraction
Globally, the presence of βLac significantly enhanced the depression of body weight gain and adiposity, enhanced energy efficiency, and improved fasting blood insulin and leptin levels and HOMA-IR. Whey led to an intermediate response between Milk and βLac regarding these parameters, without modifying energy efficiency when compared to milk. These effects were not solely related to the reduction in energy intake, because cumulative energy intakes did not differ after the ingestion of βLac and Whey-containing diets, whereas βLac but not Whey decreased energy efficiency when compared to milk. The effects observed on weight gain and adiposity may have resulted to some extent from the biochemical nature of βLac as a member of the lipocalin family, and its ability to trap hydrophobic moleculesReference Sawyer and Kontopidis30, thus participating in reducing intestinal lipid absorption. A specific effect of Whey (and particularly βLac) on lipid metabolism was evidenced by their enhanced effect in the context of a HP–high-fat diet (as if the interaction between protein type and the C/L ratio was not always significant). Nevertheless, the present results require further investigation in order to fully understand the effect of the whey-derived protein fraction on lipid absorption and metabolism.
The present findings support the concept that the C/L ratio of the diet can modulate the effects observed with HP diets with respect to energy intake, body weight gain, adiposity and circulating lipid profile. On the one hand, the lowering effect of a HP diet on weight gain and adiposity was enhanced by a HP/high-fat/carbohydrate-free diet (P55L45), but on the other hand, the high fat content of this diet could lead to a less favourable circulating lipid profile. By contrast, the P55C15L30 diet produced the most favourable lipid profile and did not cause a higher AI than the values observed with a more classic HP diet such as P55C35L10. The present results thus confirm previous observations that a carbohydrate-free, high-fat, HP diet was as efficient or even more efficient than a high-carbohydrate, low-fat, HP diet in reducing weight and adiposity, and that a high fat content in a diet was not sufficient per se to promote hyperphagia and-enriched fraction obesityReference Marsset-Baglieri, Fromentin, Tome, Bensaid, Makkarios and Even8, Reference Pichon, Huneau, Fromentin and Tome9, Reference Klein and Wolfe17. However, a HP/high-fat/carbohydrate-free diet does not produce a favourable circulating profile, and the absence of carbohydrate cannot compensate for a high lipid content. Consequently, the present results suggest that in the context of a HP diet, reducing the carbohydrate content without excessively enhancing the lipid content may generate an interesting metabolic status. The results also show that the protein type could also modulate the effects observed with HP diets with respect to energy intake, body weight gain, adiposity, circulating lipid and insulin sensitivity. Whey-derived protein fractions seemed to be able to reduce energy intake and reorientate energy metabolism in a more favourable way. This specificity of the whey-derived protein fraction may be mediated by the lipid-uptake ability of β-lactoglobulin. This possibility is in line with the enhanced metabolic effects observed in the case of a HP/high-fat/carbohydrate-free diet. Further investigations are required to fully understand the specificity of whey-derived protein fractions and their interaction with the composition of a diet.
Acknowledgements
We would like to thank Armor Protéines SAS for preparing the protein sources from bovine milk.


