


There are many health benefits related to the intake and plasma level of n-6 and, in particular, n-3 PUFA. Thus, an adequate PUFA intake is very important throughout life. In the last trimester of pregnancy and in the first postnatal months, a sufficient supply of DHA (22 : 6n-3) and arachidonic acid (AA; 20 : 4n-6) is important for the development of the central nervous system and the brainReference Ruxton, Reed, Simpson and Millington1, Reference Helland, Smith, Saarem, Saugstad and Drevon2. During the first years of life, a sufficient intake of essential PUFA linoleic acid (LA; 18 : 2n-6) and α-linolenic acid (LNA; 18 : 3n-3) and long-chain (LC) n-6 and n-3 PUFA is crucial for brain development, photoreception and reproductive system developmentReference Ruxton, Calder, Reed and Simpson3, Reference Muskiet, van Goor, Kuipers, Velzing-Aarts, Smit, Bouwstra, Janneke Dijck-Brouwer, Rudy Boersma and Hadders-Algra4. Moreover, there is increasing evidence that LC PUFA imbalances are associated with childhood developmental and psychiatric disorders, including attention-deficit hyperactivity disorder, dyslexia, dyspraxia and autistic spectrum disordersReference Richardson5, Reference Richardson6. In addition, an adequate intake of LC n-3 PUFA counteracts the atherosclerotic process, which is known to begin in youthReference Gidding and Dennison7. During adulthood, the intake of n-3 PUFA continues to be crucial, given that many fundamental, clinical and epidemiological studies have confirmed the relationship between n-3 PUFA and several chronic diseases, in particular cardiovascular and inflammatory diseasesReference Ruxton, Reed, Simpson and Millington1, Reference Kris-Etherton, Harris and Appel8–Reference Kris-Etherton, Harris and Appel10. Moreover, several observational studies have reported that clinical depression, depressed mood and postpartum depression may be accompanied by low n-3 PUFA levels in the blood or adipose tissueReference Ruxton, Reed, Simpson and Millington1, Reference Sontrop and Campbell11.
Despite all the favourable health effects, it has been repeatedly reported that modern diets in developed countries are very low in n-3 PUFAReference Muskiet, van Goor, Kuipers, Velzing-Aarts, Smit, Bouwstra, Janneke Dijck-Brouwer, Rudy Boersma and Hadders-Algra4, Reference Simopoulos12. The diet in developed countries has evolved from a diet rich in LNA and LC PUFA to a modern Western diet in which LA is the main PUFAReference Ruxton, Reed, Simpson and Millington1, Reference Sontrop and Campbell11, Reference Barbarich, Willows, Wang and Clandinin13. This is mainly due to optimized agricultural production processes and the increased consumption of margarines and food items containing vegetable oils that are rich in LA. A result of this dietary evolution has been an increased n-6/n-3 ratio, which has been shown to promote the pathogenesis of many diseases, including cardiovascular, inflammatory and autoimmune diseasesReference Simopoulos12.
From a public health perspective, dietary unbalances need to be addressed, starting in childhood. In order to develop appropriate interventional strategies at the population level, it is important first to quantify the differences between current dietary intakes and recommendationsReference Gidding and Dennison7. Therefore, in the present study, the dietary PUFA intake of pre-school children was evaluated and compared with Belgian, European and American recommendations14–16. An overview of these recommendations is given in Table 1. Furthermore, the food sources that contribute to the various PUFA intakes were identified, and potential ways to bridge the gaps between current intakes and recommended levels were explored. To the best of the authors' knowledge, this is the first paper that has described individual PUFA dietary intakes of pre-school children in Europe. In the past, only individual PUFA intake data of Australian, Canadian and Chinese children have been publishedReference Barbarich, Willows, Wang and Clandinin13, Reference Meyer, Mann, Lewis, Milligan, Sinclair and Howe17, Reference Innis, Vaghri and King18.
Table 1 National and international recommendations for PUFA intake in children as a percentage of total energy intake (E%) and in g/d
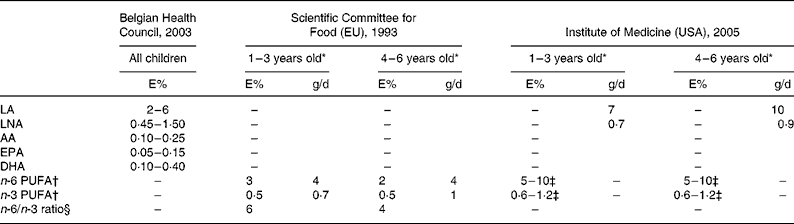
AA, arachidonic acid; DPA, docosapentaenoic acid; LA, linoleic acid; LNA, α-linolenic acid.
* 1–3 years old = 12–48 months; 4–6 years old = 49–72 months.
† Individual PUFA that are included are not specified.
‡ Approximately 10 % of the total intake can come from longer-chain n-3 or n-6 PUFA.
§ Calculated based on the recommended n-6 and n-3 PUFA intakes.
Methods
Study population
The target population for the present study included pre-school children living in Flanders, which is the northern, Dutch-speaking region of Belgium that includes approximately 60 % of the total Belgian population. Representative samples of Flemish pre-school children aged 2·5–6·5 years were selected on the basis of random cluster sampling at the school level, stratified by province and age. Details about the sampling strategy and the representativeness of the study sample have been described by Huybrechts et al. Reference Huybrechts, De Bacquer, Matthys, De Backer and De Henauw19, Reference Huybrechts and De Henauw20. A total of 2095 children were enrolled in the present study. Their parents were asked to complete a FFQ, a structured 3 d estimated diet record (EDR), and a general questionnaire on socio-demographic background, family composition and child characteristics. Only the EDR data were used to assess the PUFA intake, since the FFQ was developed to assess calcium intakeReference Huybrechts, De Bacquer, Matthys, De Backer and De Henauw19.
Overall, 1052 subjects returned an EDR completed between October 2002 and February 2003. Only EDR containing sufficiently detailed descriptions of the food products and the portion sizes consumed were used for analysis. The EDR of twenty-six children were excluded due to missing data. Of the 1026 remaining subjects, 696 completed 3 d diaries, 208 completed 2 d diaries and 122 completed only a 1 d diaryReference Huybrechts, De Bacquer, Matthys, De Backer and De Henauw19, Reference Huybrechts and De Henauw20. In the present study, only the data of children for whom 3 d diaries were available were used, since data from 1 or 2 d do not provide an accurate picture of usual intake on the individual level, due to within-subject diet variationReference Willett21. Since gender or age information was missing for thirty-five children, the EDR of 661 children (338 boys and 323 girls) were included in the analyses. None of the children took supplements containing PUFA. Additional information about the study population has been previously presented by Huybrechts et al. Reference Huybrechts, De Bacquer, Matthys, De Backer and De Henauw19, Reference Huybrechts and De Henauw20.
Food composition databases
The total fat content of the foods was obtained from the Belgian and Dutch food composition database (FCDB)22, 23. In total, 726 of the 936 food items consumed contained fat. To determine the PUFA concentration of the food items, a specific FCDB was developed that included the concentrations of LA (18 : 2n-6), LNA (18 : 3n-3), AA (20 : 4n-6), EPA (20 : 5n-3), docosapentaenoic acid (DPA, 22 : 5n-3) and DHA (22 : 6n-3). Eight previously developed FCDB were used, and, in order of the number of items that were used, they were: the Dutch FCDB24 (n 457); an extended French FCDBReference Astorg, Arnault, Czernichow, Noisette, Galan and Hercberg25 (n 78); the USDA National Nutrient Database26 (n 43); the British McCance & Widdowson's FCDB27 (n 42); the Finnish FCDB28 (n 13); the Danish FCDB29 (n 4); the Canadian Nutrient File30 (n 3); and the German FCDBReference Souci, Fachmann and Kraut31 (n 1). Furthermore, food composition information was obtained from food producers for forty food items, mostly for specific types of margarine, cheese and dressings. For forty-five composite food items, the fatty acid (FA) composition was calculated using local recipes describing the different ingredients and their proportions, as well as the FA composition of the ingredients as found in one of the FCDB. Detailed FA profiles of the fat-containing food items were then calculated by applying the proportional share of each FA in the newly compiled database to the total fat content of the food as listed in the particular FCDB22, 23.
Statistical methods
The average PUFA intakes were calculated as the mean of the 3 d period and expressed in absolute amounts (mg/d) as the percentage of the total energy intake (E%). The usual PUFA intakes were computed using the NUSSER-method, a statistical method developed at Iowa State University, based on the advice of the American Institute of Medicine with respect to the need to determine the distribution of usual nutrient intakes when assessing diets of population groups in relation to the recommended levels16. The NUSSER-method estimates the usual intake distributions by accounting for within-individual variation in nutrient intakes, while requiring relatively few days of intake data per individualReference Nusser, Carriquiry, Dodd and Fuller32. C-side software (Iowa State University, 2006) was used for the NUSSER-method.
The statistical analyses were done using SPSS software version 12.0 (SPSS Inc., Chicago, IL, USA). Normality was tested using the Kolmogorov–Smirnov test (P < 0·01). A non-parametric Mann–Whitney U test was used to determine differences in PUFA intakes between boys and girls, as well as between different age groups (P < 0·01).
Percentages of individual PUFA provided by the different foods were calculated as population proportions, as defined by Krebs-Smith et al. Reference Krebs-Smith, Kott and Guenther33. The population proportion is calculated by summing the amount of a FA from a certain food item for all individuals and then dividing this number by the sum of that FA from all food items for all individuals. The food items were grouped in thirty-six subgroups and eight major groups, according to Astorg et al. Reference Astorg, Arnault, Czernichow, Noisette, Galan and Hercberg25.
Results
Table 2 shows the individual PUFA intakes, the LA/LNA ratios, and the n-6/n-3 PUFA ratio for all children and for two different age groups, 2·5–3-year-olds (30–48 months) and 4–6·5-year-olds (49–78 months). The NUSSER-method was useful only for LA, LNA, the sum of LA and AA (referred to as Σn-6 PUFA), and the sum of LNA, EPA, DPA and DHA (referred to as Σn-3 PUFA), but not for individual LC PUFA (AA, EPA, DPA and DHA). This was due to the fact that, in many children, the intake of these PUFA over the 3 d was zero, resulting in a skewed distribution, as reflected by the small differences between the mean intake and the 75th percentile. Other than for LA expressed in E%, the intakes of no other PUFA were normally distributed (in mg/d or in E%). No significant differences in the calculated intakes were found between boys and girls and between children younger and older than 4 years of age. The results of the present study are compared to those of other studies in Table 3.
Table 2 Flemish pre-school children's PUFA intakes for the whole group and by separate age groups

AA, arachidonic acid; DPA, docosapentaenoic acid; LA, linoleic acid; LNA, α-linolenic acid.
* 2·5–3 years–old = 30–48 months; 4–6 years–old = 49–78 months.
† Results using the NUSSER-method (see Methods) to assess the usual intake.
‡ Sum of LA and AA.
§ Sum of LNA, EPA, DPA and DHA.
Table 3 Pre-school children's PUFA intakes in various studies*
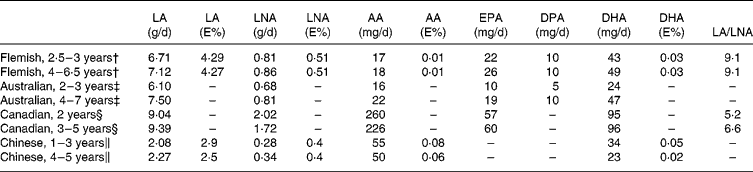
AA, arachidonic acid; DPA, docosapentaenoic acid; E%, percentage of total energy intake; LA, linoleic acid; LNA, α-linolenic acid.
* Since the values expressed as E% were not reported in other studies for EPA and DPA, these are not included in the table.
† Present study.
‡ Meyer et al., 2001Reference Meyer, Mann, Lewis, Milligan, Sinclair and Howe17.
§ Innis et al., 2001Reference Innis, Vaghri and King18.
‖ Barbarich et al., 2006Reference Barbarich, Willows, Wang and Clandinin13.
Fig. 1 shows the dietary sources of the different PUFA for Flemish pre-school children. It is remarkable that the contribution of sweet products (including biscuits, chocolate products, pastry & desserts, and sugar & sweets) to the LA intake was as high as the contribution of fats & oils (including fatty sauces, margarines, vegetable oils, and mixed fats). Within the group of sweet products, the most important contributor was chocolate products (11·6 %), followed by biscuits (8·3 %). Two other important LA contributors were cereal products (with bread as the most important contributor) and meat, poultry & eggs. For LNA, the contribution pattern of the different food groups was similar to that found for LA, with almost one-third of the LNA intake coming from the consumption of fats & oils, with margarines being the most important subgroup (Fig. 1). The AA intake was mainly obtained from meat, poultry & eggs (32·6 % by poultry and 34·3 % by meat & meat dishes). The second important contributor to AA intake was fish & seafood (11·1 % from lean fish and 7·4 % from molluscs & crustaceans). For the LC n-3 PUFA, fish & seafood were the major source, with fatty fish being the most important subgroup (contributing 53·4, 42·8 and 48·1 % for EPA, DPA and DHA, respectively). A substantial part of DPA intake came from poultry (23·5 %) and meat & meat dishes (18·1 %). Given that margarines are fortified and that eggs are used in the preparation of certain sweet products and snacks, these products also contributed to LC n-3 PUFA intake; sweet products contributed 1·2, 0·1 and 1·3 % of EPA, DPA and DHA, respectively, and snacks contributed 1·5, 0·5 and 1·9 % of EPA, DPA and DHA, respectively.

Fig. 1 Food sources of the different PUFA of Belgian pre-school children. AA, arachidonic acid; DPA, docosapentaenoic acid; LA, linoleic acid; LNA, α-linolenic acid.
Exploratory calculations were done to assess the amount of seafood that should be consumed to achieve the recommended amount of LC n-3 PUFA. Based on the Belgian nutrient recommendations for EPA and DHA intake, as well as a mean energy intake of 6543 kJ for boys and 5757 kJ for girlsReference Huybrechts, De Bacquer, Matthys, De Backer and De Henauw19, Reference Huybrechts and De Henauw20, the EPA intake has to be 608–1824 mg/week in boys and 535–1605 mg/week in girls, and the DHA intake has to be 1216–4865 mg/week for boys and 1070–4281 mg/week for girls. Based on the food composition data, it was calculated that two 50 g fatty fish (e.g. mackerel, sardines, salmon) portions per week are needed to fulfil the requirements, assuming that seafood is the only source of EPA and DHA. This recommended level of seafood consumption was compared with the current seafood consumption of the pre-school children. On the basis of the 3 d EDR, it was found that only 207 of the 661 children consumed seafood, and only fifty children consumed fatty fish (salmon being the most important species). The mean seafood consumption over the 3 d was 8·6 g/d for the total sample and 27·4 g/d for the subsample who consumed seafood.
Discussion
Comparison with dietary recommended intakes and previous studies
The PUFA intakes calculated in the present study were compared to the results from other studies: (1) Canadian children (n 84; 1·5–5 years), based on a FFQ; (2) Australian children (2–3 years (n 383) and 4–7 years (n 799)), based on one 24 h recall; and (3) children in rural China (n 196; 1–5 years) based on three 24 h recalls (Table 3). Without doubt, different food composition data and different methodologies used to collect food consumption data were used in the various studies, which hampers the comparability of the data. Nevertheless, it is worth comparing the results to evaluate the PUFA intake data of Flemish pre-school children in an international context.
Based on the Belgian recommendations, it was found that a large proportion of the studied population had an LA intake that was within the recommended range. This confirmed the abundance of LA sources in the modern Western dietReference Sontrop and Campbell11. Previous PUFA intake assessments in other subgroups of the Flemish population (adolescents and women of child-bearing age) showed that they also have a sufficient LA intakeReference Sioen, Pynaert, Matthys, De Backer, Van Camp and De Henauw34, Reference Sioen, Matthys, De Backer, Van Camp and De Henauw35. Therefore, it can be concluded that no dietary changes are required to increase the current LA intake. However, based on the American adequate intakes for LA, the mean LA intake of the pre-school children was low; this demonstrates that any overall conclusions depend on the recommendations that are used. Overall, the intake of Flemish pre-school children was similar to the intake of Australian, lower than that of Canadian, but much higher than that of Chinese children (Table 3).
For LNA, only 56·5 % of the sample had an intake within the Belgian recommended range; the others did not reach the lower level of the recommended intake. Previously, a similar result was found for Flemish women and adolescentsReference Upritchard, Zeelenberg, Huizinga, Verschuren and Trautwein36, Reference Korver and Katan37. The food sources of LA and LNA are quite similar (Fig. 1); thus, a general shift in the consumption of a certain food group to increase the LNA intake will simultaneously have an effect on the LA intake. Therefore, a shift between foods within a certain food group is required to address the low LNA intake. The consumption of LNA-rich foods by the Flemish population should be encouraged, specifically by encouraging the consumption of food items with a lower LA/LNA ratio (rapeseed oil, linseed oil, soyabean oil and walnut oil). This can be achieved either by direct consumption of these foods or by increased use of these ingredients in processed foods, such as margarines and biscuits, which can be implemented in new and highly developed food manufacturing techniques. With respect to margarine, the food industry must keep the trans-FA concentration of their products as low as possible, since these FA are known to increase the risk of CHDReference Mann, Johnson, Warrick and Sinclair38, Reference Taber, Chiu and Whelan39. This is in line with the American Heart Association statement that it is crucial for the growth and development of healthy children that foods and beverages must fulfil nutritional requirementsReference Gidding and Dennison7. The intakes of Flemish pre-school children seem to be quite similar to the American adequate intakes for LNA. Just as was found for the LA intake, the LNA intake of Flemish pre-school children was comparable to that of Australian, but much lower than that of Canadian children. The LNA intake of Chinese children appears very low when expressed in g/d, but only slightly lower than the Flemish intakes when expressed in E%, due to the low energy intake of rural Chinese children.
The rather high LA intake and the excessively low LNA intake of Flemish pre-school children resulted in a high LA/LNA ratio that was much higher than that of Canadian children. This confirms that the consumption of food items with a lower LA/LNA ratio by Flemish pre-school children (and by the Flemish population in general) should be encouraged, and that food industries must be encouraged to lower the LA/LNA ratio of their products, if possible.
All Flemish pre-school children had an AA intake that was lower than the recommended lower limit. Different possible explanations or influencing factors can be put forward: the overall diet truly contains very little AA; the recommended AA intake range set by the Belgian Health Council is too high; or the AA concentrations in the foods consumed were underestimated in the FCDB that were consulted. Considering the second explanation, neither the EU nor the American Institute of Medicine has given specific AA recommendations, which hampers any comparison. However, the American Institute of Medicine has indicated that 5–10 E% should come from n-6 PUFA, with approximately 10 % from LC n-6 PUFA. The literature is equivocal on the issue of AA concentration estimation in FCDB. An Australian study stated that AA values in their FCDB are too high, which leads to an overestimation of the AA intake40. In contrast, an American study concluded that AA values in the American FCDB (version HB-8) were significantly lower compared to the analytical resultsReference Diehl41.
The AA intakes of Flemish and Australian pre-school children were comparable. The AA intakes of Chinese children were more than two times higher, while those of Canadian children were more than 10 times higher (for many of the Canadian children, chicken was the major source of dietary AA). One possible way to increase the current AA intake of Flemish children would be to increase the consumption of poultry meat. However, any recommendation to increase meat consumption should ensure that the overall SFA intake is not increased.
The EPA and DHA intakes of Flemish pre-school children were low compared to the Belgian recommendations. Low seafood consumption was probably the main cause of this deficit. Canadian children had the largest LC n-3 PUFA intake; it was twice as high as the intake of Flemish children (Table 3). Preliminary calculations showed that encouraging fatty fish consumption among Flemish pre-school children would be a possible solution to increase their intakes to recommended levels. Nevertheless, there are various barriers to recommending increased seafood consumption. First, there are concerns that higher fatty fish consumption could impact on the intake of pollutants, such as dioxins and heavy metals. Currently, an increasing number of studies have found that the potential benefits from n-3 PUFA outweigh the risk of exposure to toxicological levels of contaminantsReference Ruxton, Reed, Simpson and Millington1, Reference Gidding and Dennison7, 40. Second, the food choice of young people is mostly driven by taste, smell and convenience; seafood does not have a high preference rateReference Diehl41. Furthermore, parents and school catering services must decide whether seafood will be regularly placed on the menu. Although parents' food consumption decisions are shaped by personal norms or moral obligation to serve their children a nutritious meal, children's preferences and their compliance with these play a role in food consumptionReference Kelly, Turner and McKenna42. Moreover, recent empirical evidence suggests that the presence of young children in a family acts as an important barrier to increased seafood consumption, particularly in countries with a relatively weak seafood consumption tradition, such as BelgiumReference Sioen, Matthys, De Backer, Van Camp and De Henauw35. The presence of young children in Belgian households has been associated with a lower impact of external social norms, that is the parents' interest and willingness to take into account advice from external information sources in their social environment, such as medical sources, in determining seafood consumptionReference Verbeke and Vackier43. Last but not least, Belgian adults have a rather limited awareness of the fact that seafood is an important dietary source of n-3 PUFA, and the fact that these PUFA have a potential beneficial impact on human healthReference Verbeke, Sioen, Pieniak, Van Camp and De Henauw44.
Methodological issues and limitations
The first methodological limitation is due to the fact that a 3 d EDR does not necessarily reflect individuals' usual intake and likely leads to more extreme high and low intake estimations, especially for nutrients abundantly present in foods that are not consumed on a daily basis, such as seafoodReference Willett21. Though the NUSSER-method was used to assess usual PUFA intake, it was inapplicable for PUFA for which a substantial part of the population had a zero intake. Nevertheless, the mean nutrient intake on the population level, based on 3 d EDR, did not differ much from the usual nutrient intake estimates derived from the NUSSER-method. This might be due to the rather small within-individual variation of the consumption pattern of young children.
The second limitation is related to the food composition data. On a regular basis, new (highly processed) food items become available. As a result of this variety, it was not possible to find the PUFA composition for some of the foods consumed. Eight different FCDB were used to determine the PUFA composition; this is not ideal, since they can all be based on different protocols. Furthermore, in some individual foods, PUFA, in particular the LC PUFA, are present in small amounts, but accumulate to significant levels of biological importance given the whole diet. For most foods, these low values are often rounded down to zero when the values are reported to a single decimal place in FCDB. Thus, it is likely that PUFA concentrations are consistently underreported, which would lead to an underestimation of the PUFA intakeReference Mann, Sinclair, Percival, Lewis, Meyer and Howe45.
The third methodological issue is related to the dietary recommended intakes. In most cases, the dietary recommended intake of a nutrient is expressed as the RDA. RDA are set to meet the needs of almost all (97 or 98 %) individuals in a group. Due to a lack of information on biochemical markers for n-3 PUFA status, the American dietary recommended intakes for PUFA are provided as adequate intakes based on the observed median intakes in the USA16. Nevertheless, no detailed information is available about the background of the other dietary recommended intakes reported in Table 1, which makes a proper comparison difficult.
Conclusions
The intake of LA fell within the recommended range, the intake of LNA was rather low, and, as a result, the mean LA/LNA ratio was high. Therefore, Flemish pre-school children would benefit from a higher consumption of LNA-rich foods, which could be accomplished by replacement of n-6-rich oils by n-3-rich oils, such as linseed and rapeseed oils, in food formulations. Moreover, dietary changes are necessary to increase intakes of LC n-6 and n-3 PUFA to recommended levels. Regular replacement of meat products rich in SFA by poultry meat would be a possible solution to increase the AA intake. Fatty fish consumption should be encouraged because it is a rich source of LC n-3 PUFA whose current intakes are far below recommended levels.
Acknowledgements
The authors gratefully acknowledge financial support from the Belgian Nutrition Information Centre and the Institute for the Promotion of Innovation through Science and Technology in Flanders (IWT-Vlaanderen). We are grateful to the parents and teachers who participated in this project and generously volunteered their time and knowledge. We thank dietitians Mia Bellemans and Mieke De Maeyer for their data input, and the Flemish Association of Paediatricians (VVK) for their help in initiating this project. Isabelle Sioen was responsible for the PUFA intake assessment and the writing of the manuscript. Inge Huybrechts and Stefaan De Henauw were responsible for designing the study protocol and implementing the fieldwork. All co-authors assisted in the evaluation and interpretation of the results and contributed to the writing of the manuscript.


