
Introduction
Small-scale looting has been a hallmark of cultural heritage theft in Egypt for thousands of years. The intensity and frequency of looting in Egypt and worldwide have, however, increased in recent years, far beyond previous levels. Our data, presented here, indicate that significant spikes in looting within Egypt started in 2009, in connection with the global economic crisis, and were exacerbated by the chaos of the 2011 Arab Spring (Mackenzie & Davis Reference Mackenzie and Davis2014). The results from our analysis, compared with economic data from the World Bank and the Central Bank of Egypt, demonstrates that looting is fundamentally economic in origin. As desperation grows among local populations, many people turn to looting, attracted by the demand from a growing global antiquities market (Brodie & Tubb Reference Brodie and Tubb2001; Atwood Reference Atwood2004). Previous research has expanded our understanding of the motivations for local looting (Roosevelt & Luke Reference Roosevelt and Luke2006; Kersel Reference Kersel2007; Mackenzie & Davis Reference Mackenzie and Davis2014) and at known sites countrywide (Gutchen Reference Guthchen1983). Analyses of satellite imagery in targeted locations show that it can work to track looting (Stone Reference Stone2008; Coluzzi et al. Reference Coluzzi, Lasaponara and Masini2010; Brodie & Contreras Reference Brodie, Contreras, Lazrus and Barker2012), but ours is the first study to analyse satellite evidence for large-scale looting over time and across an entire country. While further, on-the-ground ethnographic work on looting is needed in Egypt, our goal is to address the ever present, ever elusive question of scale.
A brief history of looting in Egypt
Looting of archaeological sites has a long history in Egypt. In addition to physical theft from places such as the Valley of the Kings, individual tombs have been reused (Dodson & Ikram Reference Dodson and Ikram2008); archaeologists have also documented ancient block reuse in medieval Cairo from the Memphite region (Brand Reference Brand and Wendrich2012). Objects purchased or smuggled from Egypt (including those legally obtained from excavations) began to fill museum collections in the 1800s. The practice of partage, i.e. the dividing of archaeological finds between Egyptians and foreigners, built many global Egyptology museums until the 1980s (Ikram Reference Ikram and Silverman2011).
Egypt's first modern civilian uprising, The Peasant's Revolt (1919), resulted in widespread looting of farms for food, but there is virtually no record of archaeological site looting (Goldberg Reference Goldberg1992). The 1952 revolution changed land ownership and agricultural practices, drove urbanisation and resulted in the construction of the Aswan High Dam. It is not known how far these factors led to increased archaeological looting. In recent years, however, many field archaeologists in Egypt have seen looting first-hand (Proulx Reference Proulx2013), but it is not yet fully quantified. There is still a demand for Egyptian antiquities, with objects such as the St Louis Mummy Mask (Gill Reference Gill2014) apparently a consequence of storehouse theft. In fact, two-thirds of the Egyptian antiquities sold at Sotheby's auction house in the last decade have lacked a collection history prior to 1973. The lack of provenance for items sold by antiquities dealers has created questions surrounding the scale and extent of site looting in Egypt, which has not previously been studied (Gill Reference Gill, Hassan, Tassie, Owens, de Trafford, van Wetering and Daly2015).
Assessing reports of recent looting in Egypt
Prior to the Arab Spring, few looting stories had appeared in the media but, following the Egyptian Revolution in January 2011, anecdotal reports of systematic looting began to spread (Butler Reference Butler2011; Marchant Reference Marchant2011). With many sites lacking any police protection since 2009 and with most police being withdrawn from tourism in late January 2011, unarmed local guards could do little against armed looters at well-known sites such as Abusir, Giza, Dashur, Lisht, Abydos and Karnak (Viney Reference Viney2012; Hessler Reference Hessler2013; Hiel Reference Hiel2013), or at less visited sites such as el Hibeh, Buto and Tell ed-Dab'a. It is reported that civilians occasionally risked their lives driving away would-be looters (CBS International 2011; Crossan Reference Crossan2012). Such looting stories have continued unabated since early 2011 (Hanna Reference Hanna2013).
From an archaeological perspective, when a site is destroyed, the context of all material culture from that site is lost and a piece of our history vanishes forever. Site looting also represents a lucrative business for crime cartels, with the proceeds from looted materials (estimated at billions of dollars) funding terrorism and insurgency (Pringle Reference Pringle2014). Until we can grasp the full extent of the damage done to Egypt's archaeological heritage, the total cost of these losses and the long-term global impact cannot be understood. Only by comprehending the root causes of large-scale looting in Egypt can we begin to propose plausible solutions to stem the problem.
Our assessment of the validity and scope of the looting reports required a nationwide analysis of archaeological sites to quantify looting and modern encroachment. Archaeologists have already used satellite imagery to detect looting at specific sites in Iraq, Peru, Afghanistan, Jordan and Syria (Hritz Reference Hritz2008; Stone Reference Stone2008; Thomas et al. Reference Thomas, Kidd, Nikolovski and Zipfel2008; Stone Reference Stone2009; Coluzzi et al. Reference Coluzzi, Lasaponara and Masini2010; Contreras Reference Contreras2010; Contreras & Brodie Reference Contreras and Brodie2010; Casana & Panahipour Reference Casana and Panahipour2014), but no previous study has attempted such a large-scale analysis anywhere in the Middle East. We hope that the presentation here of the first systematic, country-scale archaeological assessment for Egypt will serve as a preliminary effort to clarify the situation and that others will conduct similar assessments for other countries in the near future.
Mapping looting from space
We used GoogleEarth Pro (GEP) to obtain satellite data from 2002–2013, with complete coverage for 2013 (see online supplementary material). Coverage was limited during the initial development of high-resolution satellites: available imagery was <20% for 2003 and 2006–2008, <30% for 2002 and 2012, <50% for 2004–2005 and 2010, and <70% for 2009 and 2011. For 100% coverage, we extrapolated the data for incomplete satellite coverage years. Where appropriate, the values for both the partial and adjusted datasets are noted.
To assess the looting and damage, we compiled a list of sites for analysis from numerous Egyptological atlases, archaeological reports, online databases, maps and previous remote-sensing analyses (Porter et al. Reference Porter, Moss and Malek1934–2004; Baines & Malek Reference Baines and Malek2000; EAIS GIS Centre 2006; Parcak Reference Parcak2007; EES Delta Survey 2014). We assessed each site individually prior to the looting and damage analysis, noting that many had either disappeared completely prior to 2002 (under fields), lay beneath modern towns or could not be mapped visually (e.g. tombs).
In Egypt, sites range in size from a simple scatter of potsherds to a 42km2 area such as the region of Luxor (Ancient Thebes), which contains hundreds of individual components (e.g. palaces, housing, temples, shrines and tombs). We focused on sites in the Nile Valley and Delta (including the Fayoum), which had better satellite coverage and site data compared to more remote desert regions. It is important to note that reports also exist of looting in the oases and other areas (Ikram & Hanna Reference Ikram and Hanna2013). From this initial survey, 1100 individual sites were defined according to ‘sitescape’, sometimes comprising several geographically or historically related ancient locations and features (e.g. the entirety of ‘Luxor’ was considered to be one ‘site’ for the purposes of this study). Some sites had to be excluded because of missing or low-quality imagery.
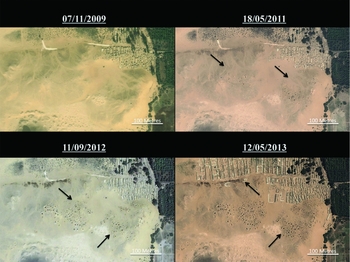
Each sitescape was inspected for every year of available GEP imagery (between 2002 and 2013) to determine whether a site had been affected by looting pits or encroachment. The latter includes building development, cemetery growth, agricultural expansion and intentional damage through targeted destruction. Looting pits appeared as dark voids surrounded by lighter coloured earth, reflecting pit depth and new soil being overturned. These appeared clearly within the satellite data (Figure 1). It can be difficult to distinguish between smaller pits and vegetation patches, so we excluded any ambiguous results. The results presented here therefore represent the lowest possible count of looting pits (Parcak Reference Parcak2008). Archaeologists seeking to document looting need to distinguish between previous excavation areas (as not every excavation is backfilled) and earlier looting pits, which requires multi-temporal imagery (Figure 2). Of the 1100 sites surveyed for damage, we determined that 267 (or 24.3%) displayed evidence of looting pits and/or encroachment.

Figure 1. A) Looting pits close-up; B) looting pits close-up with polygons; C) zoomed-out looted area; D) zoomed-out looted area with polygons.

Figure 2. Four stages of site looting near pyramid of Amenemhet III at Dashur; no looting had appeared by 7 November 2009; by 18 May 2011, minor looting is visible; by 11 September 2012, significant increases occur; by 12 May 2013, looting and encroachment covered a significant portion of the site (arrows) (2009 image courtesy of DigitalGlobe, 2011; 2012 images courtesy of Geoeye; 2013 image courtesy of GoogleEarth).
A high-resolution image (0.5–0.8m ground resolution) was acquired for every available year at each of the 267 affected sites and geo-referenced within ArcGIS. Individual polygons were then drawn over each looting pit (with an average size of 1.5–2m), or a series of larger polygons were placed over areas affected by the various types of encroachment (Figure 3). While earlier papers (Contreras & Brodie Reference Contreras and Brodie2010) observe that satellite resolution was insufficient to mark pits, we could do this easily via GEP. These were then converted to shapefiles to quantify the areal extent of the separate pits and encroachments.

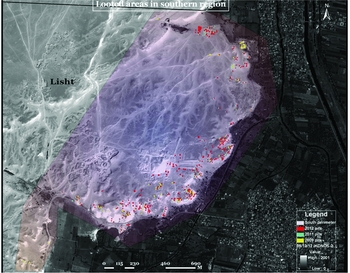
Figure 3. The southern part of Lisht, shown with red polygons; IKONOS-2 satellite image is from 12 September 2012; there were 873 pits from 2009–2012, with a total area of 8730 m2.
A polygon was drawn around the estimated perimeter of a given site, based on a consistent method of using either accepted archaeological site boundaries or modern boundaries such as fields, roads and the desert. From this we could generate an approximate area for each site. The percentage of each site affected by looting and/or encroachment could then be calculated, as well as the extent of looting and encroachment in m2 (see online supplementary material). With these data, we employed inverse distance weighting (IDW) to create thematic maps, illustrating the density of the areas worst affected by looting. IDW is a spatial interpolation algorithm that weighs values from specific known points, and uses the inverse of the distance between those points to assign or predict approximate weights for the unknown areas within the extents of the known points (Figure 4).

Figure 4. Thematic map illustrating the density of the affected area at 267 looted sites; areas in pink and red represent those worst affected (based on the % of each site) using inverse distance weighting.
Looting pits appearing in satellite imagery can only indicate an effort by looters to find objects, but cannot identify whether any objects were looted or what specific items were removed. Looting locations and the published archaeological data from the affected (or similar) sites can, however, be used to hypothesise the probable types of objects taken and to create generalised international watch lists. For example, if a New Kingdom site has been heavily looted in the area of a partially excavated cemetery, one could generate an informed guide as to what object types to anticipate based on previous adjacent finds. While this is not exact, similar on-the-ground observations have already been used to create international watch lists.
Results
Table 1 contains a chronological representation of the data, including both looting pits and encroachment (see also online supplementary material Table S1 & Figures S1–4). Data from 2002–2008 depict the situation prior to the global recession of 2008–2009 and the Arab Spring of 2011. The values for both the looting pits and encroachment areas are at a relatively low level during these years. The adjusted results (i.e. the extrapolated data projecting 100% imagery coverage) suggest that the percentage of total looting damage during the years 2002–2008 shows a slight upward trend, especially from 2006–2008, but this pales in comparison to the increase in the years 2009–2013.
Table 1. Unadjusted and adjusted number totals for each study year.

Immediately following the recession in 2008–2009, but prior to the Arab Spring, the years 2009–2010 show a statistically significant upward trend in site damage, indicating a greater frequency of intensive looting. This represents an adjusted increase of more than 400% (200% unadjusted) over the previous period from 2002–2008, even though the comparison is between a two-year and a seven-year period. The number of looting pits dug during 2009 and 2010 is, in our opinion, simply staggering, with more than 34 500 newly visible pits appearing (15 889 in 2009 and 18 634 in 2010). This is an increase of nearly 940% compared to 2008, when 3247 pits were visible. When adjusted for 100% coverage, the projected total number of pits reaches nearly 85 000, an increase of 300% compared to 2008 (20 642 in 2008 vs 25 252 in 2009 and 59 230 in 2010). The area affected by pits increases by 280% between 2008 and 2009–2010 in the unadjusted data, but only by 50% in the adjusted data (with the lower numbers probably due to poor imagery coverage for 2008). The site encroachment figures separately reveal an astonishing total increase of roughly 2300% (870% adjusted) when comparing 2008 with 2009–2010 (Table 1).
The period following the Arab Spring, from 2011–2013, gives the highest overall total values of both looting pits and encroachment. The average annual pit numbers for this period (38 000 unadjusted, 55 000 adjusted) are greater than those for the previous eight years (9000 unadjusted, 27 000 adjusted). The area of encroachment in the same period (900 000m2 unadjusted, 1.8 million adjusted) continues the sharp upward trend before appearing to level off in both the adjusted and unadjusted data. This represents an increase of 630% (420% adjusted) over the previous two-year period and is greater than the total for the entire 2002–2010 period (Table 1).
Overall, the pre-global economic crisis years from 2002–2008 account for only 5.4% of the total damage visible (both pit looting and encroachment) for the entire period studied (13.6% adjusted). In contrast, the next two years, 2009–2010, account for 22.2% of the total damage (30.9% adjusted), with the majority (13.4%; 23.3% adjusted) occurring specifically in 2010. Thus, these two years immediately after the beginning of the recession saw the level of looting more than double, if not quadruple, compared to the previous seven years (2002–2008). Looting subsequently grew even worse, however, with the next three years, from 2011–2013, representing 72.3% (55.6% adjusted) of the total damage since 2002. In brief, compared to the period from 2002–2008, looting levels doubled in 2009–2010, and then doubled again in 2011–2013. Such a dramatic increase in site damage suggests that the economic destabilisation of Egypt had begun by 2009 and grew worse following the January Revolution in 2011.
The types of encroachment can also be divided into the various functions for which the land is now being used: 57% building development, 23% agriculture, 16% cemetery and 4% flooding (both natural and intentional). Of the freestanding sites (i.e. those unconnected to towns), 72.8% were affected, as well as 16.8% of sites partially covered by towns. ‘Backyard’ looting, namely people digging in private areas near sites, occurred at 10.1% of affected sites.
In collaboration with the Ministry of Antiquities (MoA), we assessed the geographic locations of looted sites, major looting corridors within the Delta, the size and type of the sites affected, and the extent of site damage. Overall, 75.3% of affected sites are located in the Delta (West Delta, 26.2%; East Delta, 22.9%; Central Delta 26.2%); in contrast, 24.7% are in the Nile Valley. Media reports (The Echo 2011) alleged extensive damage to sites in the Fayoum, but our data indicate that only 1.9% of the affected sites lie in that region. This may reflect over-reporting on the part of the media, or poor imagery coverage for this area when compared with the Delta and Nile Valley.
The data seem to indicate the presence of a major looting and damage corridor along the Tanta to Alexandria Highway (Figure 5), within a 20-mile zone. 19.5% of all affected sites are located here, with 10.9% located specifically between Mansourah and Port Said in the Eastern Delta. Other analyses indicate that 85.3% of all the sites lie in the floodplain, and 14.2% in desert areas; 95.1% of the affected sites have road access; and 61.4% of the affected sites are freestanding tells, while 38.6% were already partially covered by urbanisation by 2002. In addition, the affected sites vary in size. Small, medium and large sites (<50ha) make up the majority of those affected, while extra-large and huge sites (≥50ha) make up only 12.7% of the affected sites: small sites (<1ha) 37.5%; medium sites (<10ha) 18.7%; large sites (<50ha) 30.7%; extra-large (<100ha) 5.2%; and huge sites (>100ha) 7.5%.

Figure 5. Map of Egypt, showing some sites and areas mentioned in this paper; basemap courtesy of ESRI.
Of the 267 affected sites, 182 exhibited post-revolution damage, counting both looting and encroachment (with 85 showing pre-revolution damage), in contrast to major media reports of looting at only 23 sites (Butler Reference Butler2011; Crossan Reference Crossan2012). Of the 267 sites analysed, at least 12 have current archaeological excavations, 9 are ticketed tourist sites and 3 are UNESCO World Heritage sites. Overall, 211 sites (79%) have suffered <10% damage; 25 sites (9%) have 11–50% damage, 19 sites (7%) have >50% damage and 12 sites (5%) have 90–100% damage.
The average size of looting pits (based on the imagery analysis and ground observations) is 2 × 2m, and the average depth of pits to be estimated at 1.24m (with a hemispherical shape). The total suggested volume for identified looting pits is hence 782 139m3, equal to 313 Olympic swimming pools or roughly one-third of the volume of the Great Pyramid of Giza.
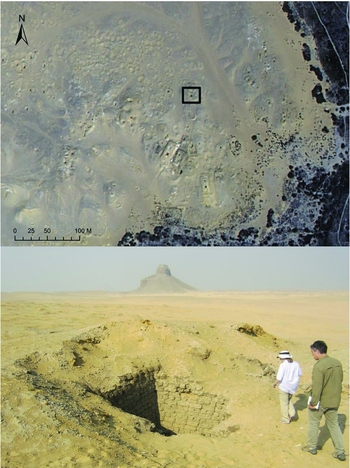
To confirm the suspected site damage visible from satellite imagery, we conducted on-the-ground validation at south Saqqara in March 2011: observations revealed both illegal cemetery construction and looting pits. In May 2011, we visited north Saqqara/south Abusir, photographing and measuring looting pits. We also visited and mapped looted areas at Dashur in December 2014 (Figure 6). At every pit examined during the three visits, we found evidence of broken coffins, pottery and human bone, indicating the presence of recently disturbed tombs (Figure 7).

Figure 6. A) satellite image of south Dashur taken 24 September 2014 (courtesy of DigitalGlobe); B) looting pit image taken 19 December 2014 (courtesy of G. Mumford); the looted pit (depth 10m) lies within the square in the satellite image (the pyramid of Amenemhet III is in the background).

Figure 7. Ground truthing in May 2011; evidence of fresh looting is apparent from the fragments of coffins and human bone (image courtesy of E.H. Cline).
The confirmed data from the observed looting (verified in part by the ground assessments) was used in an attempt to determine site damage by archaeological period. Overall, 55% of the affected sites were of Late Period (Dynasties 26–30) to Roman-period date, showing a bias on the part of the looters towards later Delta site surface remains, or the ease of obtaining high value and portable objects (e.g. statuary, amulets, carved reliefs) so close to the surface. In addition, we noted that anyone digging in Egypt would typically first reach Late Period to Roman-period remains, thus explaining the high percentage of affected sites from this time range. The New Kingdom is represented by 9% of the sites, with the Old and Middle Kingdoms at 8% each. Intermediate Periods and pre-dynastic sites and levels are the least affected, possibly reflecting poorer preservation compared to the other periods and the greater depth or a scarcity of high-value goods.
Discussion
It is commonly believed that looting is connected to a global antiquities market, with accusing fingers pointed at war, terrorism and crime as driving factors (Chuluv Reference Chuluv2014). Our study clarifies, however, that looting of archaeological sites may also be driven by other economic and political events that have destabilising social consequences (Brodie & Tubb Reference Brodie and Tubb2001; Brodie et al. Reference Brodie, Kersel, Luke and Tubb2006).
The data above show that extensive damage to Egyptian archaeological sites predates the political uncertainty following the Arab Spring; in fact, it had already intensified with the economic downturn of 2008–2009. Perhaps not surprisingly, there seems to be a relationship between the number of sites affected over time and various political, economic and social issues in Egypt. In 2008, the consumer price index rose from 40 to 150, resulting in significant financial constraints (World Bank Database 2014). Compounding this problem, tourism dropped from its peak in early 2008 to 180 000 tourists by late 2008; it began slowly returning to pre-2008 levels prior to the 2011 Revolution, and then dropped to 200 000 (a 90% decrease) by February 2011, immediately after the revolution (Central Bank of Egypt 2014).
The initial rise in looting in 2008–2009 might therefore be specifically linked to both the 2008 rise in the consumer price index and the fall in tourism in Egypt. Unemployment (especially among young adults (ages 15–24), which reached 36%) may also be strongly correlated with site damage. This matches media reports that suggest young men are primarily responsible for site looting. These data would seem to support a direct relationship between looting intensity, tourism levels and unemployment (Figure 8).

Figure 8. Economic data plotted against total affected sites area; rises in youth unemployment and falls in tourism correlate strongly with site damage, while total unemployment and short-term debt skyrocket post-Revolution; inflation rises during the recession and then drops.
Financial incentives are clearly a primary factor in site looting (Brodie & Renfrew Reference Brodie and Renfrew2005), yet the mechanics of the underground antiquities market in Egypt are still unclear at present. There are several potential smuggling routes departing Egypt (Ikram Reference Ikram and Hanna2013; Ikram & Hanna Reference Ikram and Hanna2013), some via Libya (and then across the Mediterranean), others traversing the Eastern Desert to Port Safaga (Cairo Post 2014). Removal of objects via tunnels to Gaza is another possibility (MAAN News 2013), but north-east Sinai is heavily policed. The detected looting corridors suggest that the looted goods end up in port cities (Alexandria and Port Said) for easier shipping; a recent police operation in Spain found 2200 objects hidden in vases in a shipping container from Alexandria (The Local 2015). The rise and fall of prices, and perhaps numbers, of Egyptian antiquities sold at Sotheby's from 2002–2010 can be seen in a chart (Figure 9) first published by Gill (Reference Gill, Hassan, Tassie, Owens, de Trafford, van Wetering and Daly2015). The total value of items sold in 2002 was approximately 3 million dollars; in 2009–2010, it was more than 13 million dollars. The increase mirrors that for looting indicated by our data, which suggests that the managed antiquities market and site looting may be closely connected. This has long been suspected but never proven on a countrywide scale, although it has been studied with regard to specific sites or types of looting (see Brodie & Contreras Reference Brodie, Contreras, Lazrus and Barker2012; Mackenzie & Davis Reference Mackenzie and Davis2014).

Figure 9. Rise and fall of the value of Egyptian antiquities sold at Sotheby's New York from 2002–2010; this matches the increase and decrease in looting in Egypt as indicated by our data (after Gill Reference Gill, Hassan, Tassie, Owens, de Trafford, van Wetering and Daly2015, fig. 2; reproduced by permission).
A look to the future
To date, legal deterrents to looting have had mixed results (Gerstenblith Reference Gerstenblith2007). The Egyptian MoA has a dedicated artefact recovery unit, with multiple success stories (Lynch Reference Lynch2014). The Egyptian government has also requested a bilateral agreement with the USA under the Convention on Cultural Property Implementation Act of 1983, the primary US law designed to curb the importation of unlawfully exported artefacts (Luke & Kersel Reference Luke and Kersel2013). Issues remain in domestic Egyptian law and policy, including limited policing at sites, ambiguous land ownership, land reclamation problems, corruption and overpopulation. Furthermore, the Egyptian MoA is suffering from severe revenue losses due to a decrease in tourism. To assist in their ongoing efforts, we have shared our maps and lists of affected sites with the MoA, and are developing future collaborative partnerships.
In a worst-case scenario, if the looting identified in this study continues at its current rate (assuming no changes or unseen variables), data extrapolation indicates that all of Egypt's 1100 known archaeological sitescapes and associated landscapes could be affected to varying extents by looting and/or encroachment by the year 2040 (Figures 10 & S6). The recent measures that Egypt has taken to combat looting and encroachment thus represent a test case for the effectiveness of various efforts to protect world heritage.

Figure 10. Adjusted percentage damage to sites projected to 2040, when all 1100 study sites could be affected.
We believe that Egypt's government is now in a position to curtail looting and encroachment by helping to re-establish a strong tourism market (El-Dorry Reference El Dorry2011) and by supporting training initiatives for site monitoring and protection. This is, at present, in juxtaposition to other countries such as Syria and Iraq where IS maintains control and is renting out antiquities land to professional looters (Chuluv Reference Chuluv2014). The extent to which looting is funding terrorism is a matter of debate and needs more research (Felch Reference Felch2014), but the economic motivation for looting in countries such as Iraq and Syria seems unquestionable, just as it may drive looting in Cambodia, Peru (Smith Reference Smith2005), the USA and elsewhere.
If our data are correct, the looting observed in Egypt since 2002 has not increased at a standard rate. Instead, it has fluctuated and increased dramatically in recent years owing to a host of issues, including political change and economic instability. Additional attention should therefore be given to such factors in the future, both in Egypt and elsewhere in the world. This will not only help to protect archaeological resources for posterity but will also eventually aid in our understanding of looting as a possible indicator of future political strife. In other words, if looting increases at rates related to economic instability, mapping looting patterns across a country may suggest potential tipping-point timeframes of interest to governments.
Furthermore, if in the future it is possible to discern and detect the economic and political indicators that seemingly foreshadowed the increases in looting in Egypt (and elsewhere), then it will be possible to take action to protect and bolster archaeological sites at risk. From our knowledge of the date(s) and type(s) of sites that have been looted in each country, increased numbers of particular artefact types on the antiquities market can be anticipated. It might prove possible to alert national and international agencies such as US Immigration and Customs Enforcement and INTERPOL as to the specific types of artefacts on the market.
Regardless of whatever efforts are made, looting in Egypt will not be easy to curtail. Building local connections, however, has significant potential for protecting sites. For example, the citizens of Luxor, whose main source of income is tourism, saved Karnak Temple from looting during the 2011 Revolution (Stanton Reference Stanton2011). One group has organised via Twitter and Facebook, with 700 people reporting site damage. Thousands of Egyptian archaeologists remain unemployed and could be trained in site monitoring and employed as archaeological site managers. Using a centralised database of Egypt's sites, they could provide site condition reports and direct efforts to protect affected sites. At a broader global scale, remote detection of looting could assist other governments lacking significant technical resources, with crowd sourcing potentially playing an important future role.
We hope that this study forms the first among many that will map recent looting in specific areas, regions or nations. This would allow archaeologists to assess the potential value of objects lost and assign an approximate value to the illegal international antiquities trade. Direct knowledge of the general periods of affected sites could translate into an indirect knowledge of the range of objects taken. This would aid international policing efforts such as ICOM's red list, which provides data for sites looted in other countries (ICOM 2012). Clearly, the future of our past is at stake.
Acknowledgements
Funding came from the National Geographic Society, The National Science Foundation (OISE-1103878), D. Lehr/Antiquities Coalition and UAB. We thank former and current members of the Ministry of Antiquities in Egypt (M. Damaty, H. el-Azm, K. Waheed, M. Ali, A. Ahmed, Z. Hawass). The data reported in this paper are tabulated in the online supplementary material. S.P., D.G. and C.C. analysed the data; D.G. georeferenced the imagery; C.C. and D.G. did primary database management; S.P. and G.M. did background research; S.P., G.M. and E.C. did ground truthing in Egypt; S.P. designed the study. All authors contributed to the manuscript.
Supplementary material
To view supplementary material for this article, please visit http://dx.doi.org/10.15184/aqy.2016.1